Transfection Technologies Market Size and Share
Market Overview
| Study Period | 2020 - 2031 |
|---|---|
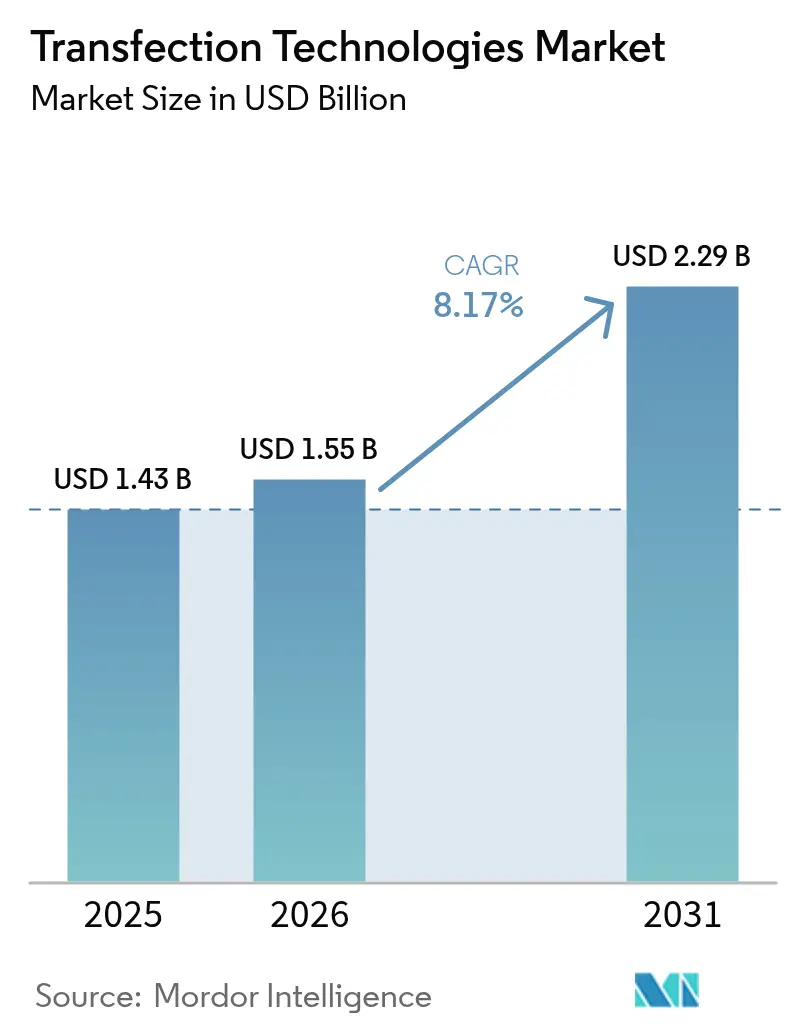
| Market Size (2026) | USD 1.55 Billion |
| Market Size (2031) | USD 2.29 Billion |
| Growth Rate (2026 - 2031) | 8.17% CAGR |
| Fastest Growing Market | Asia-Pacific |
| Largest Market | North America |
| Market Concentration | Medium |
Major Players *Disclaimer: Major Players sorted in no particular order Image © Mordor Intelligence. Reuse requires attribution under CC BY 4.0. | |
Transfection Technologies Market Analysis by Mordor Intelligence
Transfection Technologies market size in 2026 is estimated at USD 1.55 billion, growing from 2025 value of USD 1.43 billion with 2031 projections showing USD 2.29 billion, growing at 8.17% CAGR over 2026-2031. This trajectory reflects a rapid pivot from small-scale laboratory protocols toward scalable, cGMP-compliant platforms demanded by the gene and cell therapy sector. Uptake is paced by 37 FDA-approved gene therapy products that require high-efficiency, low-toxicity delivery of DNA, RNA, or protein cargos into primary cells.[1]Source: U.S. Food and Drug Administration, “Cellular and Gene Therapy Guidances,” fda.gov Instrument makers are automating electroporation, microfluidics, and lipid-nanoparticle workflows to satisfy commercial batch sizes that now exceed 200 billion cells. Top vendors differentiate through closed, single-use consumables that shorten validation cycles for mRNA vaccines, allogeneic CAR-T therapies, and in vivo CRISPR products. Regionally, United States and Canada maintain strong regulatory and manufacturing ecosystems, yet capital flows into Singapore, Japan, and China indicate a coming rebalance toward Asia-Pacific production hubs.
Key Report Takeaways
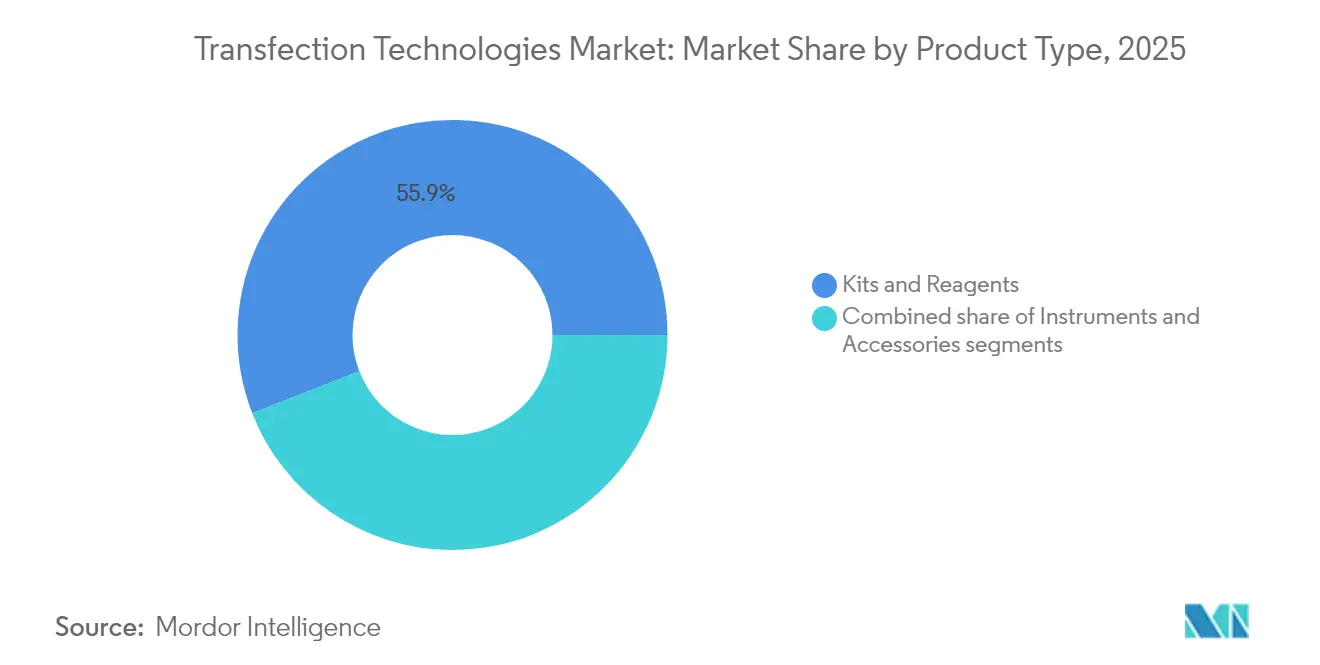
- By product type, kits and reagents led with 55.92% of transfection technologies market share in 2025, while instruments record the fastest 8.94% CAGR through 2031.
- By application, biomedical research held 43.10% revenue share in 2025; synthetic biology and genome engineering are projected to expand at a 9.28% CAGR.
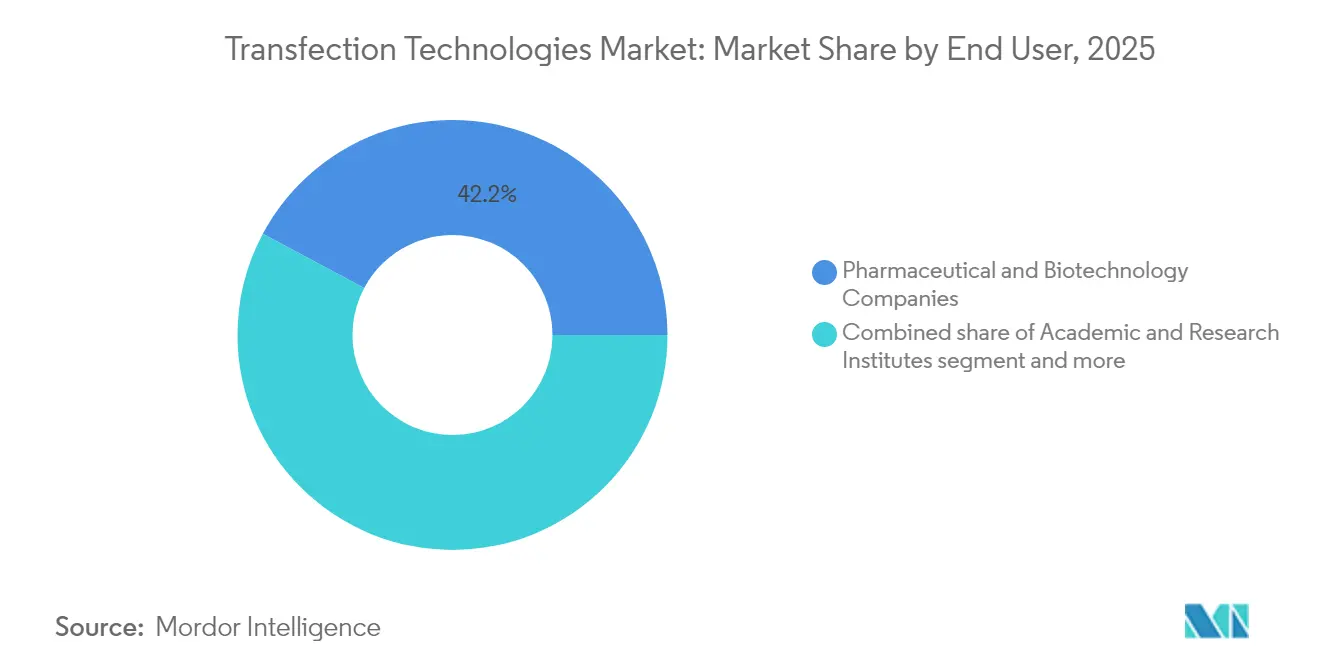
- By end user, pharmaceutical and biotechnology companies captured 42.20% of the transfection technologies market size in 2025, whereas academic institutes advance at a 9.46% CAGR.
- By geography, North America retained 38.40% of 2025 revenue, yet Asia-Pacific will outpace all regions with a 9.88% CAGR.
Note: Market size and forecast figures in this report are generated using Mordor Intelligence’s proprietary estimation framework, updated with the latest available data and insights as of 2026.
Global Transfection Technologies Market Trends and Insights
Drivers Impact Analysis*
| Driver | (~) % Impact on CAGR Forecast | Geographic Relevance | Impact Timeline |
|---|---|---|---|
| Rising incidence of chronic diseases | +1.8% | Global, with concentration in North America & Europe | Long term (≥ 4 years) |
| Expanding R&D in cell- & gene-based therapies | +2.1% | Global, led by North America, expanding to APAC | Medium term (2-4 years) |
| Growing demand for synthetic biology workflows | +1.5% | North America & EU core, spill-over to APAC | Medium term (2-4 years) |
| Government bio-foundry programmes | +1.2% | APAC core, with initiatives in North America | Long term (≥ 4 years) |
| mRNA-vaccine scale-up needs high-throughput transfection | +1.7% | Global, with early gains in US, Germany, Singapore | Short term (≤ 2 years) |
| Automation and standardization of manufacturing processes | +1.0% | Global, particularly North America & Europe | Medium term (2-4 years) |
| Source: Mordor Intelligence | |||
Rising Incidence of Chronic Diseases
Cancer, neurological disorders, and inherited hematologic conditions are rising worldwide, pushing healthcare systems toward curative approaches based on gene transfer and genome editing. CAR-T pipelines alone require transfection platforms capable of 90% efficiency in primary T cells while maintaining ≥85% viability, a threshold now achieved with optimized electroporation buffers. Focused ultrasound-assisted CRISPR delivery is demonstrating precise in-brain editing without viral vectors, signalling new therapeutic frontiers. High treatment prices—CASGEVY lists at USD 2.2 million—justify capital investment in advanced instruments that compress production timelines from weeks to days.
Expanding R&D in Cell and Gene-Based Therapies
Global clinical activity exceeded 1,200 active trials in 2024, creating a robust funnel for commercial launches that rely on scalable, repeatable transfection protocols. Allogeneic cell banks magnify demand because a single manufacturing run can treat hundreds of patients, intensifying the focus on closed electroporation systems with process analytical technology. Long-term supply contracts—such as Lonza’s agreement to produce CASGEVY—illustrate how platform providers convert R&D momentum into multi-year revenue streams.
Growing Demand for Synthetic Biology Workflows
Bio-foundries automate design-build-test-learn cycles for organism engineering, generating high-throughput transfection needs across microbes, plant cells, and mammalian lines. The U.S. NSF committed USD 24 million to shared infrastructure in 2024, pooling robotics, analytics, and microfluidics that demand reagent optimization at scale.[2]Source: National Science Foundation, “BioFoundries Program,” nsf.gov Industrial players such as Ginkgo Bioworks outfit fermentation strains through multiplex genome edits that require consistent delivery across thousands of clones. With chemical manufacturing via synthetic biology projected to reach USD 39 billion by 2030, vendors that couple instruments with proprietary cationic-lipid chemistries gain early-mover advantage.
Government Bio-foundry Programmes
Strategic autonomy in biotechnology motivates nations to subsidize pilot plants and standardize regulatory pathways. The ARPA-H EMBODY program earmarked USD 50 million to automate cell-therapy production, specifically citing transfection bottlenecks.[3]Source: Advanced Research Projects Agency for Health, “EMBODY Program,” arpa-h.gov Singapore is funding self-amplifying mRNA platforms to secure domestic vaccine capacity, accelerating demand for high-throughput lipid-nanoparticle mixers. Such initiatives establish reference protocols that often become de facto industry standards, guiding vendor product roadmaps toward closed, disposable flow-cell architectures.
Restraints Impact Analysis*
| Restraint | (~) % Impact on CAGR Forecast | Geographic Relevance | Impact Timeline |
|---|---|---|---|
| High capital cost of instruments | -1.4% | Global, particularly affecting smaller biotech firms | Medium term (2-4 years) |
| Cytotoxicity and low efficiency of legacy reagents | -1.1% | Global, with greater impact in cost-sensitive markets | Short term (≤ 2 years) |
| Complex cGMP plasmid supply chain bottlenecks | -0.9% | Global, with acute impact in North America & Europe | Medium term (2-4 years) |
| Regulatory scrutiny on gene-editing payloads | -0.8% | Global, led by North America & Europe regulatory frameworks | Long term (≥ 4 years) |
| Source: Mordor Intelligence | |||
High Capital Cost of Instruments
State-of-the-art electroporation skids exceed USD 500,000, placing advanced automation out of reach for many early-stage firms. Annual service contracts and single-use cartridges amplify total cost of ownership. Equipment-as-a-service models now spread that outlay over multi-year operating budgets, yet uptake remains modest. Contract development and manufacturing organizations relieve the burden, but slot constraints can delay IND filings by six months. Microfluidic chips fabricated through inexpensive laser engraving show promise to undercut capital costs while sustaining ≥90% transfection efficiency in suspension cells.
Cytotoxicity and Low Efficiency of Legacy Reagents
Widely used cationic-liposome systems often fall below 60% delivery efficiency in primary T cells and trigger apoptotic pathways that decimate yields. New ionizable lipids with optimized helper compositions reach 95% efficiency in hepatocytes, demonstrating translational potential for in vivo therapeutics. Acoustothermal and nanostraw approaches deliver similarly high performance while preserving membrane integrity, yet commercial adoption awaits consistent GMP manufacturing protocols.
*Our forecasts treat driver/restraint impacts as directional, not additive. The impact forecasts reflect baseline growth, mix effects, and variable interactions.
Segment Analysis
By Product Type: Instruments Accelerate Automation
Kits and reagents maintained their dominant position with 55.92% market share in 2025, reflecting the recurring revenue nature of consumables and the specialized formulation requirements for emerging applications. However, instruments represent the fastest-growing segment at 8.94% CAGR through 2031, driven by automation imperatives in cell therapy manufacturing and the need for scalable platforms that can handle diverse cell types with consistent performance.
Industrial buyers evaluate platforms on cross-cell-type performance, integration with MES software, and validated cleaning protocols. Thermo Fisher’s 5 L DynaDrive bioreactor pairs with its neon electroporation device to form an end-to-end solution that trims process development time by 27%. As a result, the transfection technologies market size for instrument sub-segments is projected to expand faster than legacy reagent lines, capturing an incremental USD 445.3 million by 2031.


By Application: Synthetic Biology Reshapes Demand Curves
Biomedical research commanded 43.10% market share in 2025, yet synthetic biology and genome engineering applications post a 9.28% CAGR that will materially alter revenue composition. High-throughput design-build cycles in bio-foundries require platforms capable of transfecting 384-well plates in a single robotic run, spurring purchases of microfluidic flow-cell arrays. Transfection efficiency directly influences protein yield in transient expression systems, making delivery platforms a critical cost lever for contract protein producers.
The transfection technologies market size for synthetic biology workflows is on track to quadruple its 2024 baseline as CRISPR-Cas13 and base-editing modalities move into commercial pipelines. Diversification is visible in plant-cell engineering, where sonoporation with piezoelectric nanomaterials achieves 70% delivery efficiency, opening non-GMO crop traits that circumvent regulatory barriers. The breadth of emerging targets forces vendors to support both suspension and adherent cultures, microbial strains, and hard-to-transfect primary cells.
By End User: Academia Gains Momentum
Pharmaceutical and biotechnology firms command 42.20% of spending, motivated by submission-ready data packages that hinge on fully characterized transfection processes. Academic and research institutes, however, register a 9.46% CAGR as public funding programs equip shared facilities with next-generation delivery platforms. The transition matters because graduate students trained on a particular system often champion that brand when they migrate to industry, reinforcing platform lock-in.
Contract development organizations bridge capability gaps for virtual biotech start-ups; yet supply-chain turbulence, especially in GMP plasmids, can extend project timelines. The transfection technologies market share held by contract manufacturers will therefore rise modestly but remains capped by sponsor preference for intellectual-property control. Hospitals exploring ex vivo gene editing at the point of care create a nascent channel that favors compact, closed cartridges with minimal user intervention.
Geography Analysis
North America retained 38.40% of 2025 revenue thanks to strong venture investment, FDA guidance that clarifies chemistry-manufacturing-control expectations, and a network of specialized CDMOs. The region’s dominance in mRNA vaccine scale-up taught process engineers to apply lipid-nanoparticle formulations to therapeutic payloads beyond infectious disease. Nevertheless, labor shortages and high facility overheads sustain interest in lights-out manufacturing suites that reduce operator exposure.
Asia-Pacific is the fastest-growing territory, expanding at a 9.88% CAGR. Singapore’s Cell Therapy Facility offers subsidized GMP suites, while Japan’s Moonshot R&D program subsidizes electroporation studies that ensure higher delivery rates in induced pluripotent stem cells. China’s synthetic-biology parks push for 1,000-strain per month design capacity, driving bulk procurement agreements for lipid-nanoparticle reagents.
Europe remains a mature but cautiously expanding arena. Germany leverages messenger-RNA manufacturing expertise from its vaccine boom to pivot toward rare-disease therapeutics, while EMA guidance on genetically modified cells harmonizes quality expectations across member states. Stringent GMO regulations slow agricultural applications, yet attractive research funding offsets some regulatory friction.


Competitive Landscape
Competitive intensity is moderate, with platform strategies dictating share shifts. Merck KGaA’s USD 600 million acquisition of Mirus Bio underscores consolidation aimed at combining lipid-nanoparticle expertise with global distribution. MaxCyte holds 29 strategic platform licenses, covering oncology, regenerative medicine, and autoimmune indications, locking partners into royalty arrangements that extend to commercial sales.
Thermo Fisher and Cytiva compete on integrated bioprocess suites that combine transient expression bioreactors with automated electroporation skids. Polyplus, now under Sartorius, diversifies into helper plasmids that complement its reagent line, aiming to capture a larger slice of per-dose cost in AAV vector production. Start-ups such as Cellares and Terumo refine closed, modular systems that shorten end-to-end CAR-T production from 14 days to 36 hours.
Competitive differentiation now turns on real-time analytics, process digital twins, and turnkey cGMP documentation. Vendors that package software with hardware and consumables gain recurring revenues while easing customer audits. White-space opportunities persist in agricultural biotechnology and decentralized clinical settings, where small-footprint devices paired with lyophilized reagents could unlock new user segments. High-performance non-viral delivery chemistries and acoustothermal devices represent nascent threats to conventional electroporation leadership, but regulatory familiarity with electroporation sustains its near-term advantage.
Transfection Technologies Industry Leaders
Lonza Group
Bio-Rad Laboratories, Inc.
Thermo Fisher Scientific
Qiagen NV
Merck KGaA
- *Disclaimer: Major Players sorted in no particular order

Recent Industry Developments
- May 2025: National University of Singapore unveiled Nanostraw Electro-actuated Transfection (NExT) technology delivering 94% protein and 80% mRNA efficiency while processing 14 million cells per run.
- July 2024: STEMCELL Technologies launched the CellPore Transfection System to enhance cell-engineering workflows.
- September 2023: Polyplus introduced pPLUS AAV-Helper plasmid, lowering cost per dose in AAV manufacturing. e-Zyvec technology has birthed the pPLUS AAV-Helper plasmid, now fine-tuned for use with the FectoVIR-AAV transfection reagent. This latest offering broadens the product lineup, introducing a vital raw material pivotal to the AAV production process, alongside existing transfection reagents.


Research Methodology Framework and Report Scope
Market Definitions and Key Coverage
Our study defines the transfection technologies market as the global value generated from products and platforms, kits, reagents, instruments, and supporting accessories used to introduce exogenous nucleic acids into eukaryotic cells for research, bioprocessing, and therapeutic delivery. The baseline year in Mordor Intelligence's model is 2025, when sales reached USD 1.43 billion.
Scope Exclusions: Consumables sold purely for viral vector manufacturing and general cell-culture plastics are excluded to avoid double counting.
Segmentation Overview
- By Product Type
- Kits and Reagents
- Instruments
- Accessories
- By Application
- Biomedical Research
- Therapeutic Delivery
- Protein Production
- Synthetic Biology and Genome Engineering
- Other Applications
- By End User
- Academic and Research Institutes
- Pharmaceutical and Biotechnology Companies
- CROs and CMOs
- Hospitals and Clinical Laboratories
- By Geography
- North America
- United States
- Canada
- Mexico
- Europe
- Germany
- United Kingdom
- France
- Italy
- Spain
- Rest of Europe
- Asia Pacific
- China
- Japan
- India
- Australia
- South Korea
- Rest of Asia Pacific
- Middle East and Africa
- GCC
- South Africa
- Rest of Middle East and Africa
- South America
- Brazil
- Argentina
- Rest of South America
- North America
Detailed Research Methodology and Data Validation
Primary Research
Mordor analysts conducted structured interviews with scientists at academic cores, process-development managers in biopharma, and procurement leads at contract manufacturers across North America, Europe, and Asia. These calls clarified cell-line transfection efficiencies, reagent-to-instrument spending splits, and region-specific pricing adjustments that could not be gleaned from desk work alone.
Desk Research
Our analysts first pulled public indicators from tier-1 sources such as the World Health Organization's cancer incidence files, ClinicalTrials.gov gene-therapy trial logs, OECD R&D expenditure dashboards, and World Bank biotech trade series. These were blended with association data from organisations such as the American Society of Gene and Cell Therapy, patent volumes from WIPO-Questel, and shipment-level reagent trade codes extracted through Volza. Company 10-Ks, recent investor decks, and reputable scientific journals then helped us benchmark average selling prices (ASPs) and adoption curves. This list is illustrative; many further documents were reviewed to resolve data gaps and cross-check trends.
Market-Sizing and Forecasting
A top-down construct converts biomedical R&D outlays, cell-therapy pipeline counts, and bioreactor capacity additions into a demand pool, which is then pressure-tested through bottom-up roll-ups of sampled ASP × volume data. Key variables like average plasmid dose per run, electroporation penetration in GMP facilities, success rates of gene-editing trials, reagent price deflation, and regional grant inflows drive the model. Multivariate regression with scenario analysis projects each driver through 2030, after which outputs are sense-checked against expert consensus and historical elasticity. Where supplier-level estimates were incomplete, interpolation was limited to nearest-neighbor cohorts before being filtered through our interview insights.
Data Validation and Update Cycle
Outputs undergo variance checks, senior analyst review, and anomaly reconciliation. Reports refresh annually; interim updates trigger when notable events, major approvals, large mergers, or sudden shifts in funding materially alter our view.
Why Mordor's Transfection Technologies Baseline Commands Reliability
Published numbers differ because each firm tweaks scope, variables, or refresh cadence.
Reagent-only lenses, aggressive ASP ramps, or conservative trial success assumptions all swing totals.
Key gap drivers here include: some publishers omit high-value electroporation systems; others cap forecasts at academic demand, overlooking CDMO scale-up; a few lock exchange rates at survey year levels, obscuring currency drift.
Benchmark comparison
| Market Size | Anonymized source | Primary gap driver |
|---|---|---|
| USD 1.43 Bn (2025) | Mordor Intelligence | - |
| USD 1.37 Bn (2025) | Global Consultancy A | Focused on reagents and equipment only, minimal primary validation |
| USD 1.34 Bn (2025) | Trade Journal B | Excludes emerging CDMO demand; static ASP growth assumption |
In short, our balanced top-down view, selective bottom-up checks, and yearly refresh give decision-makers a transparent baseline that traces every figure back to observable variables and repeatable steps.


Key Questions Answered in the Report
What is the current size of the transfection technologies market?
The transfection technologies market is valued at USD 1.55 billion in 2026 and is projected to reach USD 2.29 billion by 2031.
Which product segment is growing fastest?
Instruments grow at 8.94% CAGR because automated electroporation and lipid-nanoparticle mixers streamline commercial cell-therapy manufacturing.
Which region will expand most rapidly?
Asia-Pacific leads growth with a 9.88% CAGR, driven by government-funded bio-foundries and mRNA manufacturing hubs.
How are high instrument costs being mitigated?
Equipment-as-a-service contracts, shared GMP suites, and emerging low-cost microfluidic devices help smaller firms access advanced technology without large upfront outlays.
What advances are reducing cytotoxicity in transfection?
Next-generation ionizable lipids, acoustothermal delivery, and nanostraw-based electroporation achieve efficiencies above 90% while maintaining high cell viability.
Page last updated on:


