Market Overview
| Study Period | 2021 - 2031 |
|---|---|
| Forecast Data Period | 2026 - 2031 |
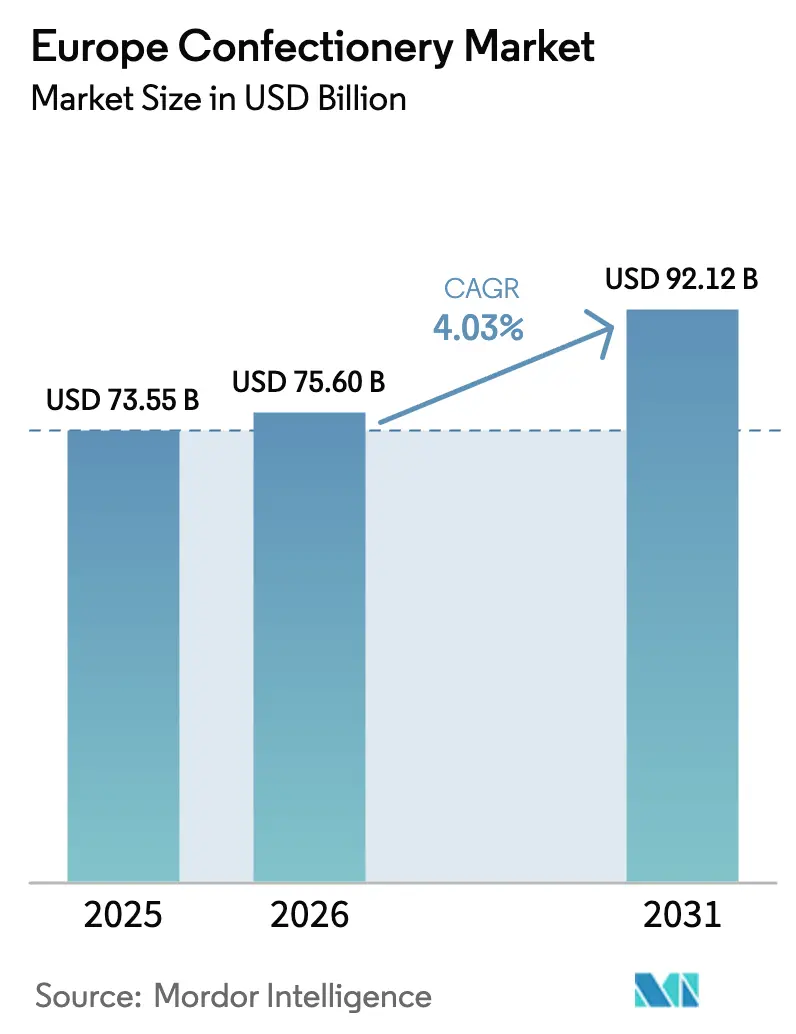
| Base Year Market Size (2025) | USD 73.55 Billion |
| Market Size (2026) | USD 75.60 Billion |
| Market Size (2031) | USD 92.12 Billion |
| Growth Rate (2026 - 2031) | 4.03% CAGR |
| Market Concentration | Medium |
Major Players *Disclaimer: Major Players sorted in no particular order Image © Mordor Intelligence. Reuse requires attribution under CC BY 4.0. | |
Europe Confectionery Market Analysis by Mordor Intelligence
The Europe confectionery market size is expected to grow from USD 73.55 billion in 2025 to USD 75.60 billion in 2026 and is forecast to reach USD 92.12 billion by 2031 at a 4.03% CAGR over 2026-2031. Amidst fluctuating cocoa prices and stringent EU regulations, three key drivers - premiumization, plant-based reformulation, and digital commerce - are fueling revenue growth. While chocolate dominates consumer spending, sugar confectionery is rapidly gaining ground, with functional gummies and portion-controlled hard candies capturing more shelf space. Retailers are reshaping the market dynamics, blending mass-priced private labels with curated premium sections. Simultaneously, manufacturers are racing to secure ethically sourced certifications tied to the December 2025 deforestation compliance deadline. In this evolving landscape, a robust omnichannel strategy has emerged as the key competitive edge, seamlessly connecting impulse-driven in-store purchases with subscription services and direct-to-consumer online platforms.
Key Report Takeaways
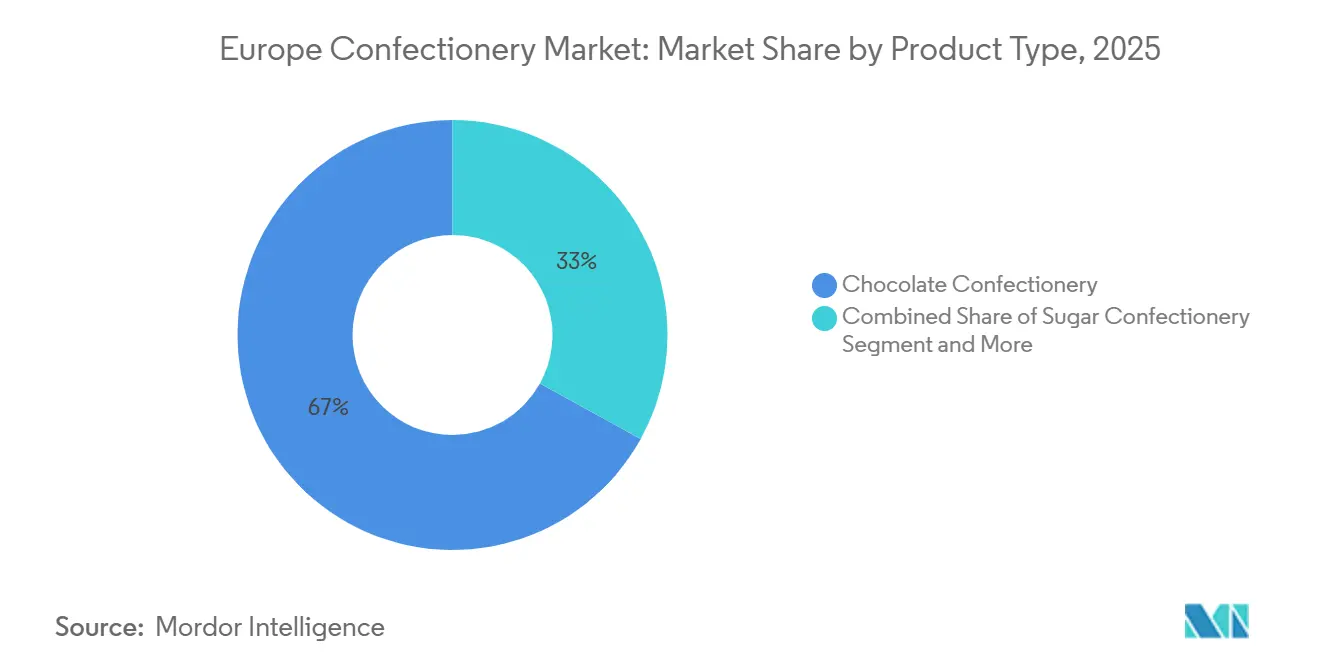
- By Product Type, chocolate confectionery held 66.96% of Europe confectionery market share in 2025; sugar confectionery is projected to expand at a 5.80% CAGR to 2031.
- By Price Category, the mass price tier accounted for 77.74% of sales in 2025, while the premium price tier is projected to expand at a 6.13% CAGR to 2031.
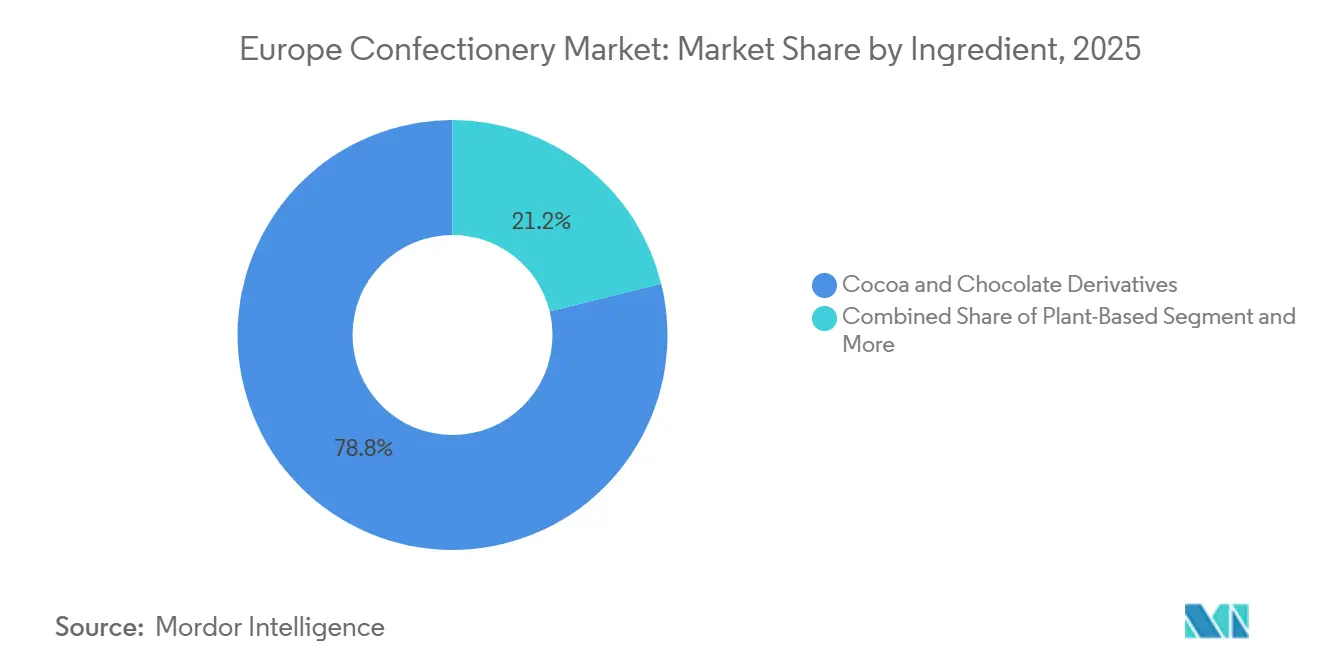
- By Ingredient, Cocoa and Chocolate Derivatives held 78.82% of Europe confectionery market share in 2025; Plant-Based is projected to expand at a 6.78% CAGR to 2031.
- By Distribution Channel, supermarkets and hypermarkets controlled 42.57% of value in 2025, whereas online retail represents the fastest channel at a 7.36% CAGR through 2031.
- By Geography, the United Kingdom dominated with 31.43% of 2025 revenue, yet Spain is the quickest riser at a 6.16% CAGR to 2031.
Note: Market size and forecast figures in this report are generated using Mordor Intelligence’s proprietary estimation framework, updated with the latest available data and insights as of January 2026.
Europe Confectionery Market Trends and Insights
Drivers Impact Analysis*
| Driver | (~) % Impact on CAGR Forecast | Geographic Relevance | Impact Timeline |
|---|---|---|---|
| Rising demand for premium and artisanal confectionery | +0.8% | Western Europe (the United Kingdom, France, Belgium, Germany); selective uptake in Spain, Italy | Medium term (2-4 years) |
| Expansion of impulse purchases in convenience retail | +0.6% | Global, with the highest intensity in the United Kingdom, Germany, Poland, Netherlands | Short term (≤ 2 years) |
| Seasonal gifting culture boosts volume spikes | +0.5% | Global, peak impact in the United Kingdom, Germany, France, and Belgium during Easter and Christmas | Short term (≤ 2 years) |
| Growth of online grocery and D2C channels | +0.7% | Western and Northern Europe (the United Kingdom, the Netherlands, Germany, and Sweden), and accelerating in Poland | Medium term (2-4 years) |
| Subscription-based confectionery boxes gain traction | +0.3% | United Kingdom, Germany, Netherlands; niche penetration in France, Sweden | Long term (≥ 4 years) |
| Plant-based/vegan confectionery acceleration | +0.9% | Western Europe (United Kingdom, Germany, France, Netherlands); early adoption in Spain, Italy | Medium term (2-4 years) |
| Source: Mordor Intelligence | |||


Rising demand for premium and artisanal confectionery
As consumers increasingly favor single-origin cocoa, artisanal recipes, and transparent supply chains, premium chocolate is reaping significant value growth. Buyers in Western Europe are willing to pay a 30-50% premium for products that highlight their provenance and ethical sourcing. Research from CBI reveals that 59% of consumers perceive chocolates with unique stories as premium, and 75% link single-origin claims to enhanced sustainability credentials. In line with this trend, Lindt is set to unveil its limited-edition Shortbread and Tokyo-Style Matcha bars in 2024, merging Swiss heritage with innovative flavors to command premium prices in the UK and Germany. Belgium's Neuhaus, in collaboration with two-Michelin-star chef Tim Boury, is launching festive Bûche offerings in September 2025, showcasing how artisanal partnerships can elevate seasonal products. In France, where dark chocolate consumption outpaces the EU average by 5%, the market's appreciation for cocoa complexity and intensity is evident. This trend of premiumization isn't limited to chocolate alone; sugar confectionery brands are now embracing artisanal approaches, using nostalgic formats, portion control, and natural colorants to command higher margins, a shift from their traditional volume-driven strategy.
Expansion of impulse purchases in convenience retail
Convenience stores are becoming pivotal arenas for confectionery sales, with most purchase decisions occurring at the checkout. This impulse-driven nature benefits manufacturers who secure prime shelf spots, invest in eye-catching displays, and customize pack sizes for consumers on the move. Spain's retail scene welcomed 244 new stores from January to April 2025, marking a 25% year-on-year increase. This growth, noted by the U.S. Department of Agriculture, underscores urban densification and the integration of physical stores with swift delivery apps. From 2019 to 2023, Germany's discount channel, spearheaded by Aldi and Lidl, expanded at a 5.2% CAGR, outpacing traditional supermarkets and reshaping promotional calendars to spotlight private-label chocolates and seasonal treats. In Poland, the convenience sector thrives on robust cross-border e-commerce, with one in three internet users shopping from international outlets. This trend is birthing hybrid models that merge spontaneous in-store purchases with online exploration. In the UK, regulations on high-fat, sugar, and salt products, which limit confectionery promotions, inadvertently led to a 4% uptick in gifting formats by volume in 2025. This surge came as manufacturers pivoted their SKU mix towards premium boxed assortments, cleverly sidestepping the placement restrictions.
Seasonal gifting culture boosting volume spikes
European confectionery brands heavily rely on Easter and Christmas for a significant portion of their annual direct-to-consumer revenue. This reliance creates pronounced demand fluctuations, putting pressure on supply chains and working capital. Lindt's UK seasonal catalogue boasts 66 SKUs, ranging from GBP 3.50 to GBP 198. Advent calendars, stocking fillers, and hampers push average order values above GBP 50, qualifying them for free shipping. Neuhaus, in 2025, rolled out a Spring Limited Edition featuring five duo Easter eggs with flavors like calamansi, almond praliné, and blood orange. This move underscores how limited-edition flavors can extend seasonal appeal and command premium prices. In Germany, where the average person consumes 11.9 kg of chocolate annually, manufacturers tackle pronounced seasonal demand spikes. They do this through pre-packed bundles and SKU rationalization, minimizing fulfillment errors during peak times. France's rich gifting culture, rooted in patisserie traditions, drives demand for boxed pralines and ballotins, especially during year-end holidays, with price points hovering around EUR 50-60. The takeaway is evident: Brands that excel in seasonal forecasting, employ thermal packaging for summer, and embrace omnichannel fulfillment stand to gain significantly during these concentrated revenue periods.
Plant-based/vegan confectionery acceleration
Driven by flexitarian diets, lactose intolerance, and sustainability concerns, plant-based confectionery is moving from niche to mainstream. In 2024, Nestlé launched KitKat V, made with rice milk, while Ferrero introduced Nutella Plant-Based in January 2025, using chickpeas and rice syrup. These moves highlight how major players are reformulating their flagship products to meet rising demand. Lindt showcased that premium offerings can embrace dairy-free formats with its 2024 releases: the Excellence Oat Milk bar and Oatmilk Truffles. Barry Callebaut, with its M_lk Chocolate and collaborations with ChoViva, offering a cocoa-free chocolate alternative crafted from oats and sunflower seeds, underscores a push for ingredient innovation that goes beyond mere dairy replacements. Adoption rates are highest among Western European consumers, especially in the UK, Germany, and the Netherlands. Many Western Europeans prioritize sustainably sourced chocolate and seek transparency about its origins and ingredients. While Spain and Italy are still in the early stages of plant-based adoption, their momentum is picking up, thanks to broader retail distribution. However, the regulatory landscape poses challenges: EU food-labeling rules restrict the "chocolate" label to cocoa-based products. This forces vegan alternatives to use terms like "confection" or "bar," complicating their shelf placement and consumer recognition. Additionally, plant-based ingredients cost 20-40% more than their dairy counterparts, pushing manufacturers to either scale up or accept slimmer margins. With a projected 6.78% CAGR for plant-based ingredients through 2031, the outlook hinges on continued retail growth, consumer education, and cost reductions as suppliers of oat and almond milk expand their capacities in Europe.
Restraints Impact Analysis*
| Restraint | (~) % Impact on CAGR Forecast | Geographic Relevance | Impact Timeline |
|---|---|---|---|
| Health concerns and sugar taxes are dampening demand | -0.6% | The United Kingdom, France (sugar taxes implemented); broader EU (reformulation pressures) | Short term (≤ 2 years) |
| Volatile cocoa and sugar prices are impacting margins | -0.7% | Global, acute impact in Western Europe (Germany, the United Kingdom, France) due to high import dependency | Short term (≤ 2 years) |
| Compliance costs under the EU deforestation due diligence | -0.4% | EU-27, the highest burden on importers in Belgium, the Netherlands, and Germany | Medium term (2-4 years) |
| Private-label price wars are compressing manufacturer margins | -0.5% | Germany, the United Kingdom, Spain (high discounter penetration); spreading to France, Italy | Medium term (2-4 years) |
| Source: Mordor Intelligence | |||
Health concerns and sugar taxes dampening demand
Health-driven mandates and sugar taxes are reshaping product portfolios and limiting volume growth. In 2023, the UK's soft drinks levy, which has been extended to confectionery through restrictions on high-fat, sugar, and salt placements, led to a 4% drop in confectionery volumes. However, by 2025, certain formats managed to partially counteract this decline. While France's sugar tax mainly targets beverages, it's nudged confectionery producers to pivot towards sugar-free and reduced-sugar options, leveraging sweeteners like stevia and erythritol, both of which are endorsed by the European Food Safety Authority. The market for natural sweeteners in Europe is on an upward trajectory, with confectionery being a prominent application, alongside breakfast cereals and dairy products. Reformulating products isn't a walk in the park: switching out sucrose for polyols or steviol glycosides demands rigorous sensory testing, navigating regulatory submissions, and educating consumers to address any skepticism about taste differences. In Germany, there's a growing appetite for sugar-free gum and low-calorie yogurts. However, mainstream chocolate producers remain steadfast to traditional recipes, relying on sugar for both mouthfeel and shelf stability. Spaniards consume an average of 3.1 kg of chocolate annually, trailing the EU average of 5 kg. This gap can be attributed to a heightened health consciousness and a dietary inclination towards savory snacks over sweets. The industry's response is twofold: premium brands are spotlighting the antioxidant perks of dark chocolate and advocating for portion control. In contrast, mass-market brands are grappling with margin pressures, adjusting to smaller pack sizes and reformulated products.
Volatile cocoa and sugar prices impacting margins
In April 2024, cocoa prices soared past the USD 10,000 per tonne mark, fueled by crop shortfalls in West Africa, adverse weather conditions in Ivory Coast and Ghana, and speculative trading activities. This spike marked a near tripling from 2023 prices, squeezing gross margins for manufacturers who couldn't hedge or transfer costs downstream. Sugar prices mirrored this volatility, with droughts in India and Brazil, alongside geopolitical disruptions in the Black Sea, playing pivotal roles. Germany, boasting Europe's largest chocolate industry, finds itself in a precarious position. The nation sources cocoa beans and semi-finished products from countries like Ivory Coast, Colombia, Thailand, Mexico, and Ghana, rendering it susceptible to supply shocks from these origins. France, ranking as the third-largest cocoa grinder with an annual capacity of 150,000 tonnes, and Belgium, producing a hefty 584,000 tonnes of bulk chocolate, also grapple with input-cost vulnerabilities. While industry giants like Barry Callebaut and Cargill, with their vertically integrated supply chains, can cushion the blow of volatility through long-term contracts and processing in origin countries, smaller manufacturers lack such safeguards. The margin squeeze intensifies with the rise of private-label products: UK and German retailers, pushing for fixed pricing on their own-brand chocolates, compel suppliers to either absorb commodity price swings or withdraw from contracts. In a bid to bolster its grinding industry, Ivory Coast has slashed export taxes on processed products: cocoa butter now sits at 11%, paste at 13.2%, and powder at 9.6%. While this move could stabilize the supply of semi-finished products, it demands significant capital investment and time to realize, as highlighted by the European Citizenship by Investment.
*Our forecasts treat driver/restraint impacts as directional, not additive. The impact forecasts reflect baseline growth, mix effects, and variable interactions.
Segment Analysis
By Product Type: Sugar Confectionery Outpaces Chocolate Growth
In 2025, chocolate confectionery held a dominant 66.96% market share. However, sugar confectionery is projected to grow at a 5.80% CAGR through 2031, outpacing chocolate's growth. This resurgence is driven by functional gummies, portion-controlled hard candies, and nostalgic formats. Ahead of the full implementation of HFSS placement restrictions, UK sugar confectionery volumes rose 3.7% in 2025, as manufacturers pre-loaded retail pipelines with compliant gifting formats and miniature assortments, according to the UK Office for National Statistics[1]Source: “UK HFSS Regulations Impact Assessment,” Office for National Statistics, ons.gov.uk. While gum has traditionally led in volume, it faces challenges in Western Europe but thrives in Central and Eastern markets with launches like Extra Mints, Orbit Drops, and Hubba Bubba Mix and Match in France, Germany, and Poland. To counter declining youth consumption in mature markets, the gum category is pivoting to sugar-free variants with xylitol and dental benefits. Meanwhile, other segments like protein bars, toffees, and nougats are adopting premiumization, with artisanal producers emphasizing natural ingredients and portion control to rival chocolate's dominance.
Chocolate's 66.96% market share reflects entrenched consumption patterns. In Germany, per-capita chocolate intake reaches 11.9 kg annually, while in France, dark chocolate consumption has risen. Seasonal variants and filled formats sustain milk and white chocolate volumes, while dark chocolate attracts health-conscious consumers with antioxidant benefits and lower sugar content. Sugar confectionery's faster growth partly reflects a correction after years of chocolate-centric innovation. Gummy brands are launching functional variants with vitamins, collagen, and fiber to appeal to wellness-focused buyers. Manufacturers that over-indexed on chocolate during the 2010s are now diversifying into sugar confectionery to hedge cocoa-price volatility and tap into faster-growing segments.


By Price Category: Premium Segment Gains Share Despite Mass Dominance
In 2025, mass-price confectionery dominated with a 77.74% market share. However, the premium segment is rising, with a 6.13% CAGR through 2031, driven by consumer preferences for single-origin cocoa, artisanal craftsmanship, and transparent supply chains. Research from European Citizenship by Investment shows 59% of European consumers perceive "unique-story" chocolate as premium, while 75% link single-origin claims to sustainability. Premium brands like Lindt and Neuhaus leverage flavor innovation and culinary partnerships, justifying price points 30-50% above mass-market counterparts. Belgium's chocolate hub sustains premium positioning for brands like Godiva and Pierre Marcolini, commanding EUR 50-60 for festive ballotins. In the UK, where 59% of consumers prefer premium options, demand for ethical sourcing and clean-label ingredients is pushing mass-market players to introduce mid-tier ranges.
Mass-price confectionery thrives on impulse purchases, seasonal promotions, and private labels. In Germany, Aldi and Lidl drive mass-market volumes with own-brand chocolates priced 20-40% lower than branded options. Spain's retail expansion, with 244 new stores in early 2025, amplifies mass-price availability through discounters[2]Source: “Convenience Retail Expansion in Spain,” United States Department of Agriculture, usda.gov. France's annual per-capita chocolate consumption of 12.5 kg spans both mass and premium tiers, with supermarkets stocking Lindt, Milka, and artisanal makers. Premium growth reflects margin expansion as manufacturers shift to higher-value SKUs to offset cocoa-price volatility and compliance costs. Online channels favor premium chocolates, with e-commerce sales driven by subscription boxes, limited editions, and direct-to-consumer platforms bypassing retail margin pressures.
By Ingredient: Plant-Based Formats Challenge Cocoa Derivatives
In 2025, cocoa and chocolate derivatives held 78.82% of the market share. However, plant-based ingredients are projected to grow at a strong 6.78% CAGR through 2031, driven by flexitarian diets, lactose intolerance, and sustainability concerns. Nestlé launched its rice milk-based KitKat V in 2024, while Ferrero introduced Nutella Plant-Based, made with chickpeas and rice syrup, in January 2025. Lindt entered the market with its premium oat milk bar and Oatmilk Truffles in 2024. Barry Callebaut is innovating with its M_lk Chocolate and partnerships with ChoViva, a cocoa-free alternative made from oats and sunflower seeds. Western European consumers, particularly in the UK, Germany, and the Netherlands, are leading adoption, with 63% seeking greater transparency in origins and ingredients.
The sugar-free and low-sugar confectionery segment is also expanding, driven by health-conscious consumers and sugar taxes. Europe’s natural sweeteners market is growing, with confectionery as a key application alongside breakfast cereals and dairy. France and Italy lead in stevia formulations and natural gum imports, supported by companies like MANE and Aromata Group. Spain’s sugar-free segment is growing, with brands like Trapa reformulating SKUs to meet health regulations and wellness trends. While cocoa derivatives dominate due to taste preferences and supply-chain infrastructure, the 6.78% CAGR for plant-based ingredients signals a shift. Manufacturers excelling in oat milk, almond paste, and cocoa-free alternatives are positioned for growth as retail distribution expands and ingredient costs decline with scale.
By Distribution Channel: Online Retail Disrupts Traditional Footprints
In 2025, supermarkets and hypermarkets commanded a 42.57% share of the market. However, online retail stores are charting a different course, expanding at a robust 7.36% CAGR through 2031, outpacing all other distribution channels. This surge isn't just a remnant of the pandemic; it's a testament to evolving dynamics in last-mile logistics, the rise of subscription boxes, and direct-to-consumer approaches that sidestep traditional retail. E-commerce in Germany is outpacing its offline counterparts, compelling established players to bolster their digital frameworks. Meanwhile, Poland stands out as a prime market: a third of its online users shop from international platforms, granting niche brands a foothold beyond conventional retail confines. Across the EU-27, the B2C e-commerce landscape is flourishing, with food and beverages leading the online shopping charge. In a strategic move, Ferrero has teamed up with Deliverti to unveil a dedicated D2C online store, underscoring how global giants are adapting to retailer margin pressures by seizing full economic control.
Convenience stores play a pivotal role in impulse buying, as evidenced by Cloetta's finding that 80% of confectionery choices in Northern Europe are made at the checkout. Spain's aggressive retail strategy is evident with 244 new store openings in early 2025, closely tied to rapid-delivery app partnerships. Specialty outlets, from chocolatiers to boutique retailers, maintain a premium stance for brands like Neuhaus and Lindt, leveraging curated selections and unique in-store experiences to command higher prices. While channels like vending machines, petrol stations, and travel retail still hold a share, they grapple with challenges from digital alternatives and shifts in mobility trends post-pandemic. The key takeaway is the importance of omnichannel integration: brands that harmoniously blend online exploration with in-store experiences, click-and-collect services, and subscription offerings are poised to dominate as consumer behaviors evolve.
Geography Analysis
In 2025, the United Kingdom held 31.43% of the market share, driven by high per-capita consumption, strong gifting traditions, and a mature retail network encompassing supermarkets, convenience stores, and specialty chocolatiers. While the UK confectionery market is growing, with chocolate accounting for a major share of the category, Q4 2024 saw a decline in consumer spending on food and beverages due to cost-of-living pressures, leading to increased downtrading and private-label penetration. The High Fat, Sugar, and Salt (HFSS) regulations, which restrict promotional placement of confectionery, unexpectedly boosted gifting formats by 4% in volume terms in 2025, as manufacturers shifted their SKU mix toward premium boxed assortments exempt from these restrictions. Sugar confectionery volumes also grew ahead of the full implementation of HFSS rules, reflecting category resilience and strategic pre-loading by manufacturers. In Germany, Europe’s largest chocolate manufacturing hub, growth is driven by rising cocoa prices rather than volume expansion. With per-capita consumption at 11.9 kg annually, e-commerce channels are expanding, while discounters are capturing offline growth, highlighting a market where price and convenience increasingly outweigh brand loyalty. Leading brands include Lindt, Milka, Kinder, Haribo, and Ritter Sport, with private-label penetration intensifying through Aldi and Lidl's own-brand offerings.
Spain is the fastest-growing market, with a projected CAGR of 6.16% through 2031. This growth is supported by a 25% year-on-year increase in retail expansion, marked by 244 new store openings in the first four months of 2025[3]Source: “Spanish Retail Infrastructure Report,” United States Department of Agriculture, usda.gov . Spain’s per-capita chocolate consumption of 3.1 kg annually remains below the EU average of 5 kg, indicating significant potential for volume growth as retail density improves and health-conscious consumers adopt dark chocolate and sugar-free variants. The country ranks as Europe’s seventh-largest cocoa importer and fourth-largest grinder, with domestic processing capacity supporting both export-oriented manufacturers and local brands. France, the third-largest cocoa grinder in Europe with an annual capacity of 150,000 tonnes, exhibits a unique consumption profile. Dark chocolate consumption has risen, reflecting a mature palate that values complexity and cocoa intensity. With per-capita consumption at 12.5 kg annually across both mass and premium tiers, Paris stands out as a global hub for artisanal chocolatiers and patisserie traditions, sustaining demand for boxed pralines and ballotins.
Italy, Belgium, and the Netherlands maintain steady growth, with Belgium’s bulk chocolate production reinforcing its role as a processing and export hub. Sweden’s market demonstrates relative inelasticity, with Cloetta reporting that pick-and-mix formats account for 30% of confectionery sales and 80% of purchase decisions occurring at the point of sale. In Poland, confectionery revenue is forecast to grow, with one in three internet users purchasing from international stores, enabling niche brands to bypass traditional retail barriers. Poland’s filled chocolate exports are on the rise, while a surge in cocoa butter imports signals expanding manufacturing capacity. The rest of Europe, including smaller markets such as Ireland, Austria, and Eastern European countries, collectively contributes a meaningful share but lacks the scale and infrastructure of Western European leaders.
Competitive Landscape
In the Europe confectionery market, multinationals such as Ferrero International S.A., Mars Incorporated, Mondelēz International Inc., Nestlé SA, and Chocoladefabriken Lindt & Sprüngli AG dominate through scale economies, vertical integration, and diverse brand portfolios that cater to both mass and premium segments. However, the market remains fragmented. Regional players like Haribo, Perfetti Van Melle, and August Storck hold strong positions by specializing in specific categories, leveraging local distribution networks, and emphasizing heritage branding. Private-label products are gaining traction, particularly in Germany and the UK, where retailers are enhancing the quality of their own-brand chocolates and introducing premium tiers to compete with established brands. Strategic trends in the market focus on three key areas: premiumization through single-origin cocoa and artisanal collaborations; plant-based innovations to address dairy supply challenges and meet flexitarian demand; and direct-to-consumer channels that reduce reliance on traditional retail margins. Notable examples include Ferrero's planned January 2025 launch of Nutella Plant-Based and Lindt's limited-edition Tokyo-Style Matcha bars, which reflect a shift toward wellness-focused offerings. Additionally, Barry Callebaut's partnership with ChoViva, a cocoa-free chocolate alternative made from oats and sunflower seeds, illustrates ingredient innovation aimed at mitigating cocoa price volatility.
Opportunities for growth exist in functional confectionery, subscription services, and origin-country processing. Gummy brands are introducing products enriched with vitamins, collagen, and fiber to attract health-conscious consumers. Subscription platforms like Stirrd and Love Cocoa are curating monthly assortments of artisanal chocolates to secure recurring revenue. The EU Deforestation Regulation, which was delayed until December 2025 for large operators, is driving supply chain consolidation. Vertically integrated companies with established certification programs, such as Rainforest Alliance, Fairtrade, and UTZ, are better positioned to comply, while non-compliant or under-resourced suppliers face challenges. In the Ivory Coast, reduced export taxes, 11% on processed cocoa butter, 13.2% on paste, and 9.6% on powder, are incentivizing local cocoa processing. While this policy could stabilize the supply of semi-finished products, it requires significant investment and time to scale effectively. Disruptors in the market include small-batch producers using e-commerce to bypass traditional retail channels and ingredient suppliers like ChoViva, which enable manufacturers to diversify beyond cocoa.
Technology adoption in the market is uneven. Larger companies are utilizing AI for personalized promotions, dynamic pricing, and demand forecasting, while small and medium enterprises (SMEs) face higher compliance costs due to new EU packaging and sustainability regulations. The strategic focus for manufacturers is on portfolio diversification. Companies that successfully balance mass-market production with premium innovations and reduce reliance on cocoa through plant-based alternatives are well-positioned to capture a larger market share by 2031.
Europe Confectionery Industry Leaders
Chocoladefabriken Lindt & Sprüngli AG
Ferrero International SA
Mars Incorporated
Mondelēz International Inc.
Nestlé SA
- *Disclaimer: Major Players sorted in no particular order

Recent Industry Developments
- September 2025: Neuhaus partnered with two-Michelin-star chef Tim Boury to co-create a festive Bûche for the 2025 holiday season, available in stores and online for 6-8 persons. The collaboration elevates seasonal products beyond commodity status and reinforces Neuhaus's premium positioning in the Belgian chocolate category.
- January 2025: Ferrero launched Nutella Plant-Based across European markets, formulated with chickpeas and rice syrup to replace dairy ingredients. The launch targets flexitarian consumers and hedges against dairy supply-chain volatility, marking Ferrero's first major plant-based extension of its flagship hazelnut spread brand.
- August 2024: Lindt introduced Excellence Oat Milk bar and Oatmilk Truffles across the UK and European markets, demonstrating that premium positioning is compatible with dairy-free formats. The launch followed consumer research indicating 51% of Western Europeans actively seek sustainably produced chocolate.


Europe Confectionery Market Report Scope
Confectionery refers to a broad category of food items that are primarily rich in sugar and carbohydrates, commonly known as "sweets". The Europe Confectionery Market is segmented into product type, price category, ingredient, distribution channel, and geography. By product type, the market is segmented into Chocolate Confectionery, Sugar Confectionery, Gums, and others. By price category, the market is segmented into mass and premium. By ingredient, the market is segmented into Cocoa and Chocolate Derivatives, Plant-Based, and Sugar-Free/Low-Sugar. By Distribution Channel, the market is segmented into supermarkets and hypermarkets, convenience stores, online retail stores, specialty stores, and other distribution channels. By geography, the market is segmented into the United Kingdom, Germany, France, Italy, Spain, Sweden, Belgium, Poland, the Netherlands, and the rest of Europe. The Market Forecasts are Provided in Terms of Value (USD).
Product Type
| Chocolate Confectionery |
| Sugar Confectionery |
| Gum |
| Others |
Price Category
| Mass |
| Premium |
Ingredient
| Cocoa and Chocolate Derivatives |
| Plant-Based |
| Sugar-Free/Low-Sugar |
Distribution Channel
| Supermarkets and Hypermarkets |
| Convenience Stores |
| Specialty Stores |
| Online Retail Stores |
| Other Distribution Channels |
Geography
| United Kingdom |
| Germany |
| France |
| Italy |
| Spain |
| Sweden |
| Belgium |
| Poland |
| Netherlands |
| Rest of Europe |
| Product Type | Chocolate Confectionery |
| Sugar Confectionery | |
| Gum | |
| Others | |
| Price Category | Mass |
| Premium | |
| Ingredient | Cocoa and Chocolate Derivatives |
| Plant-Based | |
| Sugar-Free/Low-Sugar | |
| Distribution Channel | Supermarkets and Hypermarkets |
| Convenience Stores | |
| Specialty Stores | |
| Online Retail Stores | |
| Other Distribution Channels | |
| Geography | United Kingdom |
| Germany | |
| France | |
| Italy | |
| Spain | |
| Sweden | |
| Belgium | |
| Poland | |
| Netherlands | |
| Rest of Europe |


Market Definition
- Milk and White Chocolate - Milk chocolates is a solid chocolate made with milk (in the form of either milk powder, liquid milk, or condensed milk) and cocoa solids. White chocolate is made from cocoa butter and milk and contains no cocoa solids whatsoever. The scope includes regular chocolates, low-sugar, and sugar-free variants
- Toffees & Nougats - Toffees include hard, chewy, and small or one-bite candies marketed with labels as toffee or toffee-like confectionery. Nougat is a chewy confection with almond, sugar, and egg white as a basic ingredient; and it originated in Europe and Middle East countries.
- Cereals Bars - A snack composed of breakfast cereal that has been compressed into a bar shape and is held together with a form of edible adhesive. The scope includes snack bars made with cereals such as rice, oats, corn, etc. mixed with a binding syrup. These also include products labeled as cereal bars, cereal treat bars, or grain bars.
- Chewing Gum - This is a preparation for chewing, usually made of flavored and sweetened chicle or such substitutes as polyvinyl acetate. The types of chewing gums included in the scope are sugar-chewing gums and sugar-free chewing gums
| Keyword | Definition |
|---|---|
| Dark Chocolate | Dark chocolate is a form of chocolate containing cocoa solids and cocoa butter without the milk. |
| White Chocolate | White chocolate is the type of chocolate containing the highest percentage of milk solids, typically around or over 30 percent. |
| Milk Chocolate | Milk chocolate is made from dark chocolate that has a low cocoa solid content and higher sugar content, plus a milk product. |
| Hard Candy | A candy made of sugar and corn syrup boiled without crystallizing. |
| Toffees | A hard, chewy, often brown sweet that is made from sugar boiled with butter. |
| Nougats | A chewy or brittle candy containing almonds or other nuts and sometimes fruit. |
| Cereal bar | A cereal bar is a bar-shaped food product, made by pressing cereals and usually dried fruit or berries, which are in most cases held together by glucose syrup. |
| Protein bar | Protein bars are nutrition bars that contain a high proportion of protein to carbohydrates/fats. |
| Fruit & Nut bar | These are often based on dates with other dried fruit and nut additions and, in some cases, flavorings. |
| NCA | The National Confectioners Association is an American trade organization that promotes chocolate, candy, gum and mints, and the companies that make these treats. |
| CGMP | Current good manufacturing practices are those conforming to the guidelines recommended by relevant agencies. |
| Unstandardized foods | Unstandardized foods are those that do not have a standard of identity or that deviate from a prescribed standard in any manner. |
| GI | The glycemic index (GI) is a way of ranking carbohydrate-containing foods based on how slowly or quickly they are digested and increase blood glucose levels over a period of time |
| Skimmed milk powder | Skimmed milk powder is obtained by removing water from pasteurized skim milk by spray-drying. |
| Flavanols | Flavanols are a group of compounds found in cocoa, tea, apples, and many other plant-based foods and beverages. |
| WPC | Whey protein concentrate- the substance obtained by the removal of sufficient nonprotein constituents from pasteurized whey so that the finished dry product contains greater than 25% protein. |
| LDL | Low density Lipoprotein- the bad cholesterol |
| HDL | High density Lipoprotein- the good cholesterol |
| BHT | butylated Hydroxytoluene is a lab-made chemical that is added to foods as a preservative. |
| Carrageenan | Carrageenan is an additive used to thicken, emulsify, and preserve foods and drinks. |
| Free form | Not containing certain ingredients, such as gluten, dairy, or sugar. |
| Cocoa butter | It is a fatty substance obtained from cocoa beans, used in the manufacture of confectionery. |
| Pastellies | A type of of Brazilian candy made from sugar, eggs, and milk. |
| Draggees | Small, round candies that are coated with a hard sugar shell |
| CHOPRABISCO | Royal Belgian Association of the chocolate, pralines, biscuit, and confectionery industry- A trade association that represents the Belgian chocolate industry. |
| European Directive 2000/13 | A European Union directive that regulates the labeling of food products |
| Kakao-Verordnung | The German chocolate ordinance, a set of regulations that define what can be labeled as "chocolate" in Germany. |
| FASFC | Federal Agency for the Safety of the Food Chain |
| Pectin | A natural substance that is derived from fruits and vegetables. It is used in confectionery to create a gel-like texture. |
| Invert sugars | A type of sugar that is made up of glucose and fructose. |
| Emulsifier | A substance that helps to mix to liquids that does not mix together. |
| Anthocyanins | A type of flavonoid that is responsible for the red, purple, and blue colors of confectionery. |
| Functional Foods | Foods that have been modified to provide additional health benefits beyond basic nutrition. |
| Kosher certificate | This certification verifies that the ingredients, production process including all machinery, and/or food-service process complies with the standards of Jewish dietary law |
| Chicory root extract | A natural extract from the chicory root that is a good source of fiber, calcium, phosphorous, and folate |
| RDD | Recommended daily dose |
| Gummies | A chewy gelatin-based candy that is often flavored with fruit. |
| Nutraceuticals | Food or dietary supplements that are claimed to have health benefits. |
| Energy bars | Snack bars that are high in carbohydrates and calories are designed to provide energy on the go. |
| BFSO | Belgian Food Safety Organization for the food chain. |


Research Methodology
Mordor Intelligence follows a four-step methodology in all our reports.
- Step-1: Identify Key Variables: In order to build a robust forecasting methodology, the variables and factors identified in Step 1 are tested against available historical market numbers. Through an iterative process, the variables required for market forecast are set, and the model is built on the basis of these variables.
- Step-2: Build a Market Model: Market-size estimations for the forecast years are in nominal terms. Inflation is not a part of the pricing, and the average selling price (ASP) is kept constant throughout the forecast period for each country.
- Step-3: Validate and Finalize: In this important step, all market numbers, variables, and analyst calls are validated through an extensive network of primary research experts from the market studied. The respondents are selected across levels and functions to generate a holistic picture of the market studied.
- Step-4: Research Outputs: Syndicated Reports, Custom Consulting Assignments, Databases & Subscription Platforms


