Veterinary Scales Market Size and Share
Market Overview
| Study Period | 2020 - 2031 |
|---|---|
| Market Size (2026) | USD 291.21 Million |
| Market Size (2031) | USD 354.66 Million |
| Growth Rate (2026 - 2031) | 4.02% CAGR |
| Fastest Growing Market | Asia Pacific |
| Largest Market | North America |
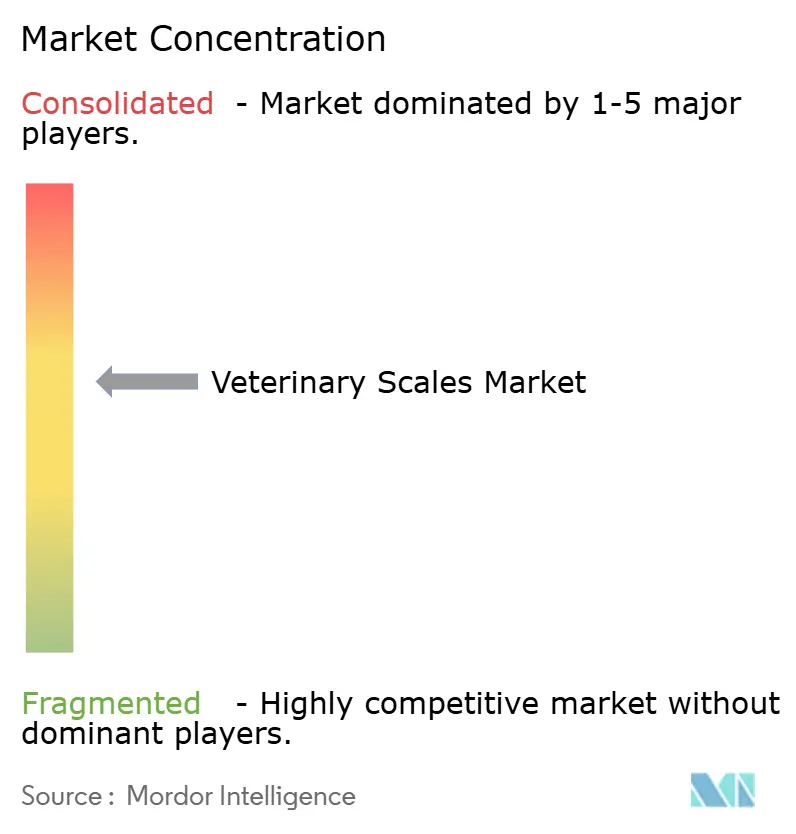
| Market Concentration | Medium |
Major Players *Disclaimer: Major Players sorted in no particular order Image © Mordor Intelligence. Reuse requires attribution under CC BY 4.0. | |
Veterinary Scales Market Analysis by Mordor Intelligence
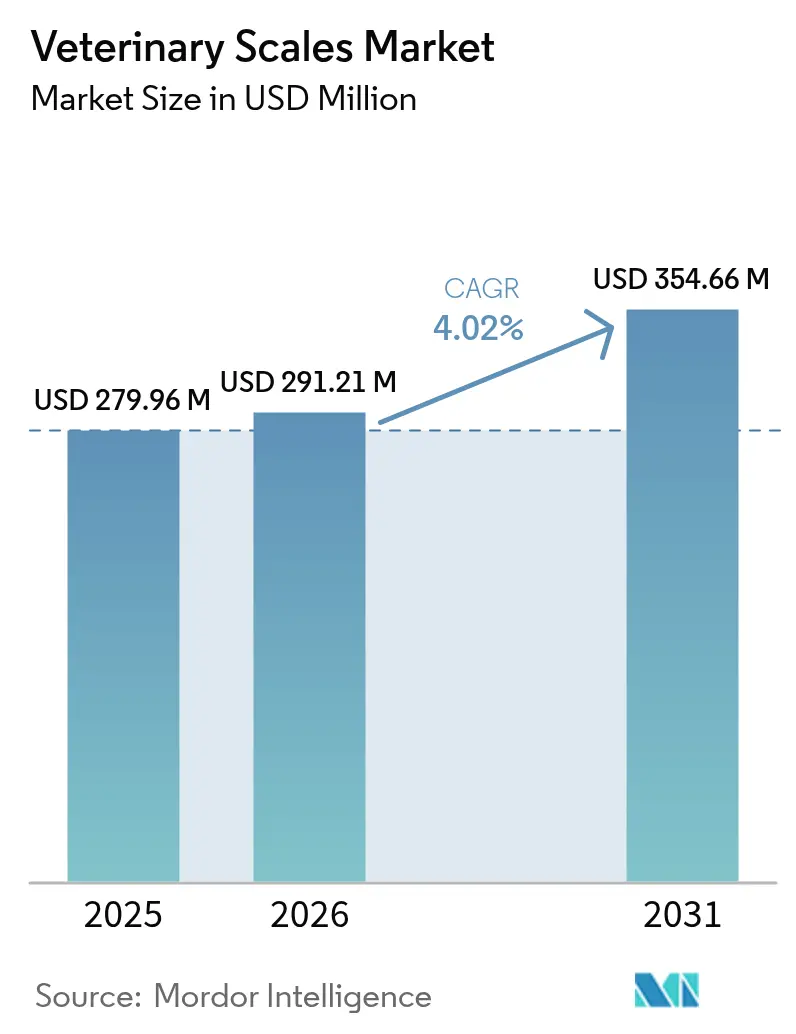
The veterinary scales market size was valued at USD 279.96 million in 2025 and estimated to grow from USD 291.21 million in 2026 to reach USD 354.66 million by 2031, at a CAGR of 4.02% during the forecast period (2026-2031). Steady growth stems from a combination of rising companion-animal spending, advances in IoT-enabled weighing technology, and regulatory requirements for precise weight records in clinical settings. Increased pet longevity, higher diagnostic frequency, and livestock farm modernization collectively expand the installed base of connected weighing equipment across clinics, farms, and home-use environments. Competitive intensity remains moderate as traditional scale makers add cloud connectivity while specialist start-ups push subscription and data-analytics models. Consolidation among veterinary service providers further stimulates equipment upgrades as chains seek standardized, traceable devices to satisfy compliance audits.
Key Report Takeaways
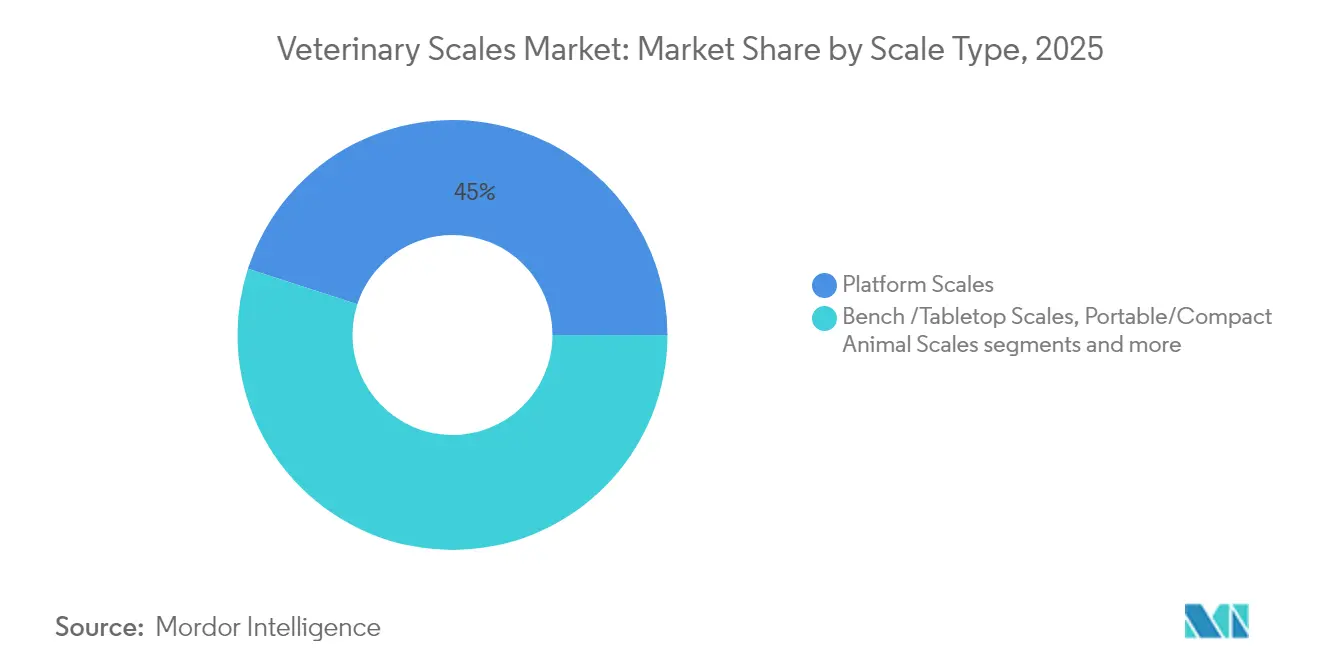
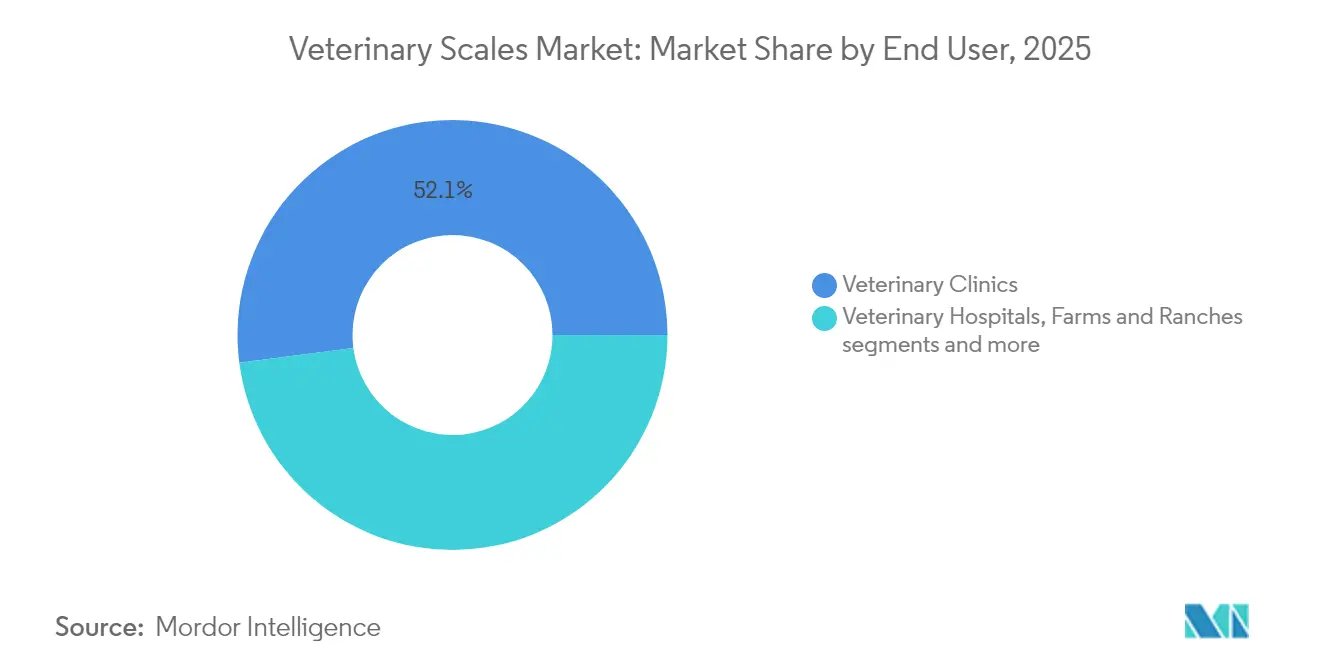
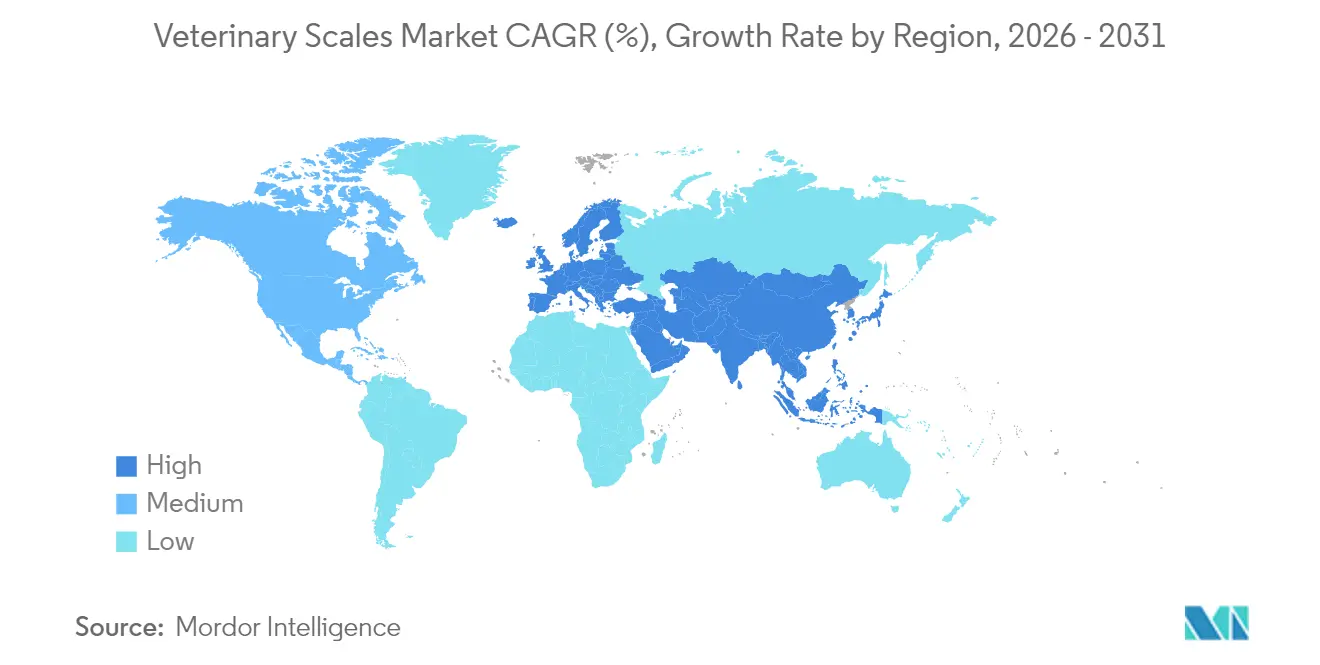
- By product type, platform scales led with 45.02% of veterinary scales market share in 2025; portable and compact scales are growing fastest at 5.54% CAGR to 2031. By animal type, companion animals accounted for 53.12% of the veterinary scales market size in 2025 and are projected to expand at 5.75% CAGR through 2031. By end user, veterinary clinics held 52.06% share of the veterinary scales market size in 2025, while home use applications are set to rise at 5.94% CAGR to 2031. By geography, North America dominated with 36.22% revenue share in 2025; Asia-Pacific is the fastest-growing region at 6.14% CAGR through 2031.
Note: Market size and forecast figures in this report are generated using Mordor Intelligence’s proprietary estimation framework, updated with the latest available data and insights as of 2026.
Global Veterinary Scales Market Trends and Insights
Driver Impact Analysis*
| Driver | (~) % Impact on CAGR Forecast | Geographic Relevance | Impact Timeline |
|---|---|---|---|
| Rising pet ownership & companion-animal expenditure | +1.2% | North America, Europe, global spill-over | Long term (≥ 4 years) |
| Growth in livestock farming & weight-based dosing norms | +0.9% | Asia-Pacific core, South America spill-over | Medium term (2-4 years) |
| Adoption of digital, IoT-enabled veterinary scales | +0.8% | North America, EU, expanding to APAC | Medium term (2-4 years) |
| Regulatory focus on accurate weight records for veterinary drugs | +0.6% | Global, led by FDA and EU regulators | Short term (≤ 2 years) |
| Telehealth-integrated mobile scales for home monitoring | +0.4% | North America, Europe | Long term (≥ 4 years) |
| Subscription-based “scale-as-a-service” for clinic chains | +0.3% | North America first movers | Medium term (2-4 years) |
| Source: Mordor Intelligence | |||
Rising Pet Ownership & Companion-Animal Expenditure
In 2024 United States households spent USD 1,733 per pet on average, positioning veterinary services as the fastest-growing cost line at 7.1% year over year. Higher spending underpins continuous demand for reliable weight measurement because accurate dosing and early disease detection require routine, precise checks. As pets age, chronic disorders such as diabetes and osteoarthritis demand tighter weight control, prompting clinics to install multi-platform systems that seamlessly feed data into electronic medical records for trend analysis. Premium service positioning makes integrated scales a standard item in full-service practices where clinical accuracy and client experience reinforce repeat visits. Clinics increasingly connect every weight session to automatic alerts, enabling real-time intervention where sudden changes flag potential health decline[1] Source: —, “IoT-Enabled Livestock Monitoring Enhances Herd Health,” biorxiv.org .
Growth in Livestock Farming & Weight-Based Dosing Norms
Precision livestock programs now rely on automated weighing stations that achieve around 95% accuracy when linked to calf feeders, waterers, and RFID ear tags. Modern dairy units and feedlots transmit continuous weight data to cloud dashboards that predict growth curves, flag underperforming animals, and calibrate antibiotic doses to new stewardship rules. Asian growers lead adoption because scale data supports export certification and premium branding for residue-free meat. National action plans on antimicrobial resistance further tighten weight-based prescription norms, making connected scales an operational necessity across large herds
Adoption of Digital, IoT-Enabled Veterinary Scales
Connected platforms feed weight, activity, and environmental data to practice management or farm ERP software. Narrowband-IoT radios maintain stable links in remote barns while edge processors deliver instant analytics even where broadband coverage is thin. Companion-animal clinics now integrate scales with automated reminders and API feeds to teleconsultation portals, allowing veterinarians to adjust diet plans without an in-person visit. Edge devices that pair weight pads with blood pressure cuffs and temperature sensors illustrate how the scale evolves into a multi-parameter vital station.
Regulatory Focus on Accurate Weight Records for Veterinary Drugs
The FDA’s revised Veterinary Feed Directive highlights weight documentation as a central compliance element for antimicrobial prescription audits. Similar language appears in EU Regulation 2019/6, obliging veterinarians to prove that dosages follow per-kilogram guidance. Devices certified to NTEP or CE metrology standards simplify inspections because each reading carries a secure audit trail. Clinics that fail to digitize records now risk financial penalties and reputational damage[2]Source: —, “Veterinary Feed Directive Guidance GFI 263,” fda.gov.
Restraint Impact Analysis*
| Restraint | (~) % Impact on CAGR Forecast | Geographic Relevance | Impact Timeline |
|---|---|---|---|
| High upfront cost for small practices | -0.7% | Global, particularly acute in emerging markets | Short term (≤ 2 years) |
| Limited awareness in emerging markets | -0.5% | Asia-Pacific, South America, Middle East & Africa | Medium term (2-4 years) |
| Calibration & maintenance compliance burden | -0.4% | Global, with highest impact in regulated markets | Medium term (2-4 years) |
| Cyber-security risks around connected scale data | -0.3% | North America & Europe, expanding to connected markets | Long term (≥ 4 years) |
| Source: Mordor Intelligence | |||
High Upfront Cost for Small Practices
Independent hospitals with annual revenue below CNY 2.4 million in China and similar income tiers elsewhere often delay equipment renewal because advanced digital scales can cost several thousand dollars plus annual calibration. Financing options remain scarce, and many owners prioritize visible imaging upgrades that promise faster payback. Pay-per-use or rental schemes exist but tend to target corporate groups where volume offsets administrative overhead. As a result, smaller sites keep older mechanical or entry-level digital units lacking connectivity, restricting their access to data-driven care.
Limited Awareness in Emerging Markets
In regions where livestock management still relies on visual body-condition scoring, the benefits of quantitative weight monitoring remain underappreciated. Limited access to training, language barriers, and scarce technical support blunt adoption, while the absence of local metrology rules reduces compliance pressure. Distributors struggle to justify service hubs in rural areas, prolonging downtime when devices fail. Manufacturers now partner with agricultural extension programs to run live demonstrations, but coverage remains patchy and progress incremental.
*Our forecasts treat driver/restraint impacts as directional, not additive. The impact forecasts reflect baseline growth, mix effects, and variable interactions.
Segment Analysis
By Product Type: Platform Scales Lead Despite Portable Innovation
Platform and walk-on units generated the largest revenue slice at 45.02% in 2025. Their dominance rests on high throughput capability, durable construction, and seamless integration with handling chutes that reduce animal stress. Clinics use them to weigh dogs, cats, and exotics in quick succession, whereas farms employ oversized platforms to capture cattle weights inside raceways. Platform devices increasingly ship with Wi-Fi or Bluetooth modules that post readings to the cloud in real time, aligning with broader digitization goals across the veterinary scales market. Portable and compact models, though representing a smaller base, will record the fastest volume gains through 2031 because mobile veterinarians and telehealth programs value lightweight, battery-powered pads that travel easily between locations.The migration toward smart design is redefining the competitive map.
Manufacturers now attach RFID or QR code readers to platforms to auto-identify animals and prevent transcription errors. Smart feeders with embedded load cells illustrate category expansion into husbandry equipment that automatically adjusts ration size based on real-time weights. Automated alleyway solutions such as C-Lock’s SmartScale collect continuous weight data through water or feed stations, freeing staff for higher-value tasks. This broadening functionality enlarges the total addressable portion of the veterinary scales market, encouraging providers to bundle software and analytics with hardware rather than compete solely on build quality.


By Animal Type: Companion Animals Drive Growth
Dogs and cats remained the primary revenue contributors with 53.12% share in 2025. Their standing reflects rising pet populations, growing preventive-care budgets, and the clinical importance of precise dosing for chronic diseases. Across urban markets, clinics record multiple weight checks per pet each year, leading to intensive scale utilization and frequent replacement cycles as accuracy standards tighten. The trend is amplified by wellness plans that bundle routine weigh-ins with vaccinations and bloodwork, embedding measurement into the care pathway. Livestock species still account for substantial unit shipments, yet their revenue share trails companion animals because per-device pricing is lower and procurement decisions hinge on farm-wide return on investment metrics. Exotic, avian, and zoo patients form a small but technically demanding niche that commands premium, custom-engineered solutions.Connected health ecosystems are reshaping expectations even within the companion segment.
AI-enabled behavior scoring tools correlate weight shifts with activity and feeding patterns, generating actionable alerts for veterinarians and owners. Such multi-parameter dashboards increase the perceived value of a connected scale, supporting subscription revenue that supplements device sales. On the farm side, integrated sensors log weight alongside ambient temperature, humidity, and feed intake, creating holistic dashboards that underpin predictive medicine and welfare certification.
By End User: Home Use Accelerates Amid Clinic Dominance
Veterinary clinics held 52.06% of 2025 revenue, reflecting the central role of in-house diagnostics during wellness visits, surgery prep, and medication dosing checks. Clinics typically deploy a mix of platform, bench, and infant scales to cover species varying from reptiles to Great Danes. Digital transformation drives upgrades because practice-management systems increasingly require automated weight import to avoid manual entry errors and maintain audit trails. Corporate practice consolidators negotiate frame contracts with leading scale vendors, accelerating fleet renewal cycles and cementing standards for connectivity and calibration.Home-use devices will post the quickest CAGR at 5.94% through 2031.
Affordable Bluetooth pads synchronize with smartphone apps that forward trends to veterinarians, enabling remote monitoring for obesity, renal disease, or oncology cases. Pharmacies and insurers encourage frequent at-home weigh-ins by offering premium discounts linked to data sharing. Veterinary hospitals, zoos, and rehabilitation centers complete the end-user matrix, favoring specialized scales with higher capacities or rugged construction to handle sedated wildlife or critical-care patients. Farms and ranches expand adoption of corridor-mounted units that capture large-animal weights during normal movement, minimizing labor costs and stress.
Geography Analysis
North America retained the leading 36.22% revenue share in 2025. High pet ownership, established veterinary infrastructure, and rigorous FDA dosage rules foster repeat purchases and fast replacement of obsolete equipment. Extensive dealer networks ensure prompt calibration, bolstering customer trust and underpinning the sizable regional slice of the veterinary scales market. Investment by corporate practice groups and the rise of subscription offerings further reinforce demand by smoothing capital outlays and standardizing equipment fleets.
Asia-Pacific is the growth locomotive, projected to expand at 6.14% CAGR to 2031. Livestock modernization programs in China, India, and Southeast Asia embed automated weighing into broader precision-farming rollouts. The Chinese pet medical sector, already valued at CNY 106.2 billion in 2022 and climbing at 19% CAGR, signals strong downstream demand for clinic-grade scales as service providers align with international quality norms. Urban families adopt tele-consultation apps that include weight tracking, boosting sales of consumer-grade pads with veterinary-level accuracy. Government initiatives supporting smart agriculture contribute parallel momentum as producers procure connected systems to meet sustainability and residue-control targets.
Europe shows steady, regulation-driven demand. The continent’s welfare rules mandate documented weight entries for drug records and transport certificates, ensuring a stable baseline replacement cycle. Sustainability policy under the European Green Deal nudges farms toward data-rich husbandry, where automated scales feed CO₂ and feed-conversion metrics into compliance reports. Consolidation of companion-animal clinics under pan-European chains harmonizes buying criteria across markets, encouraging suppliers to certify devices to both CE and OIML standards, adding another layer of complexity and opportunity within the veterinary scales market.

Competitive Landscape
Traditional weighing brands such as Mettler-Toledo, Rice Lake Weighing, and Detecto use broad portfolios, nationwide service technicians, and trusted calibration protocols to protect share. They update legacy platforms with Wi-Fi modules and API kits to remain relevant. Mid-tier challengers focus on veterinary-specific firmware and lighter chassis designs, prioritizing ergonomics vital to high-volume small-animal clinics. Several IoT start-ups position the scale as a data node inside a larger health ecosystem, selling predictive analytics dashboards that identify outlier growth curves before clinical signs emerge.
Business models evolve alongside technology. Scale-as-a-service contracts bundle devices, cloud access, periodic recalibration, and firmware updates for a monthly fee, easing budget pressures in multi-location groups. Hardware revenue therefore blends with analytics and maintenance income, creating annuity streams for suppliers. Patent filings concentrate on non-contact load cell alignment, vibration filtering, and sensor fusion, aiming to improve accuracy under field conditions. Competitive pressure also arrives from adjacent categories: smart feeders, automatic milking stations, and kennel flooring with embedded sensors all encroach on traditional scale territory by baking in weighing capability.
M&A remains active as suppliers broaden their diagnostics footprint. Zoetis’ imminent launch of the AI-driven Vetscan OptiCell analyzer indicates how device makers bundle weight with hematology to deliver one-stop workflows. Patterson Companies’ recent acquisitions add infusion and supply-chain reach, positioning it to offer integrated equipment kits. EQT’s deal for VetPartners underscores buyer appetite for scalable platforms where upgraded diagnostics, including connected scales, boost service differentiation. Fragmentation persists, yet top-tier firms collectively account for almost half of global revenue, giving them leverage to set connectivity and interoperability standards across the veterinary scales market.
Veterinary Scales Industry Leaders
Adam Equipment Co. Ltd.
apexx Veterinary Equipment, Inc.
Bosche GmbH & Co. KG
Brecknell
Detecto Scales
- *Disclaimer: Major Players sorted in no particular order

Recent Industry Developments
- January 2025: Tractor Supply completed its acquisition of Allivet to enter the veterinary pharmaceuticals sector, marking a significant expansion into veterinary care supply chains that could impact equipment procurement patterns.
- August 2024: November 2024 – Mission Veterinary Partners and Southern Veterinary Partners announced a merger combining over 730 practices to create one of the largest veterinary practice owners in the US, potentially standardizing equipment procurement including weighing systems across the consolidated network.


Research Methodology Framework and Report Scope
Market Definitions and Key Coverage
Our study defines the veterinary scales market as all new electronic or mechanical weighing devices purpose-built for animals, including platform, bench-top, portable, and compact models used in clinics, hospitals, farms, research labs, zoos, and home settings. Each unit must be sold with veterinary-specific calibration and load limits suitable for live-animal measurement.
Scope exclusion: devices branded for general industrial or food-processing use, even if occasionally employed with animals, are not counted.
Segmentation Overview
- By Product Type (Value)
- Platform / Walk-on Scales
- Bench / Tabletop Scales
- Portable / Compact Animal Scales
- Others
- By Animal Type (Value)
- Companion Animals (Dogs, Cats)
- Large Animals (Cattle & Buffalo)
- Others (Avian, Exotic)
- By End User (Value)
- Veterinary Clinics
- Veterinary Hospitals
- Farms & Ranches
- Home Use / Pet Owners
- Zoos & Wildlife Rehabilitation Centers
- By Geography (Value)
- North America
- United States
- Canada
- Mexico
- Europe
- Germany
- United Kingdom
- France
- Italy
- Spain
- Rest of Europe
- Asia-Pacific
- China
- India
- Japan
- South Korea
- Australia
- Rest of Asia-Pacific
- South America
- Brazil
- Argentina
- Rest of South America
- Middle East and Africa
- GCC
- South Africa
- Rest of Middle East and Africa
- North America
Detailed Research Methodology and Data Validation
Primary Research
Our analysts interviewed scale design engineers, procurement heads at mixed-animal hospitals across North America and Europe, large-animal veterinarians in Brazil and India, and distributors serving smallholder farms in Southeast Asia. These discussions clarified average selling prices, replacement cycles, and the share of portable devices moving through online channels, thereby fine-tuning model coefficients.
Desk Research
We began with publicly available datasets such as USDA livestock inventories, Eurostat farm structure surveys, and FEDIAF companion-animal population estimates, which frame the demand pool. Additional context came from import-export codes in UN Comtrade, patent filings gathered through Questel, and financial statements retrieved via D&B Hoovers that reveal revenue splits for leading scale makers. News archives from Dow Jones Factiva and guidelines from the World Organisation for Animal Health helped us trace regulatory and technology shifts. This list is illustrative; many other open sources supported fact-checks and context building.
Secondary inputs alone rarely reveal actual unit flows, so we use them mainly to set ceilings, sanity bands, and growth drivers before moving to validation.
Market-Sizing & Forecasting
We employ a top-down build that starts with animal population cohorts and the density of veterinary service points; these are multiplied by observed scale penetration and replacement rates, which are then cross-checked with selective bottom-up roll-ups of manufacturer shipment data and channel checks. Key variables like pet ownership growth, bovine herd expansion, clinic start-ups, average service tickets, and scale lifespan feed a multivariate regression that projects value and unit demand through 2030.
Where bottom-up evidence runs thin (for instance, fragmented online sales), gaps are bridged with benchmark ASPs gathered during primary research and adjusted for currency movements.
Data Validation & Update Cycle
Before sign-off, another analyst re-runs variance screens that flag outliers against historic ratios and peer indicators. Models refresh every twelve months, and interim updates are triggered by material events such as drastic commodity price swings or major regulatory changes. Clients therefore receive numbers reflecting the latest validated view.
Why Mordor's Veterinary Scales Baseline Commands Reliability
Published estimates often diverge because firms anchor on different product mixes, geographic spans, and forecast cadences. We acknowledge these unavoidable gaps upfront so users can see precisely where figures part ways.
Key gap drivers include narrower scope that omits compact home-use scales, differing currency conversion dates, and reliance on extrapolating premium-market ASPs without validating volumes in emerging regions. Mordor, by contrast, aligns scope with real veterinary use cases, applies blended ASPs by region, and refreshes every year, which keeps distortions in check.
Benchmark comparison
| Market Size | Anonymized source | Primary gap driver |
|---|---|---|
| USD 279.96 M (2025) | Mordor Intelligence | - |
| USD 266.10 M (2024) | Global Consultancy A | Excludes compact home-use units |
| USD 286.44 M (2024) | Industry Publication B | Premium ASPs from high-income markets skew total |
| USD 201.57 M (2024) | Regional Consultancy C | Limited coverage outside North America and Europe |
The comparison shows that when scope breadth and variable choices shift, totals swing widely. By grounding estimates in transparent variables and a yearly audit cycle, Mordor Intelligence delivers a balanced, defensible baseline that decision-makers can trace back to clear, repeatable steps.


Key Questions Answered in the Report
What is the current value of the veterinary scales market?
The market was valued at USD 291.21 million in 2026 and is forecast to reach USD 354.66 million by 2031 at a CAGR of 4.02% during the forecast period (2026-2031).
Which product category holds the largest share?
Platform and walk-on scales lead with 45.02% revenue share, driven by high throughput needs in clinics and farms.
Why is Asia-Pacific the fastest-growing region?
Rapid livestock modernization, growing urban pet ownership, and supportive government programs fuel a 6.14% CAGR through 2031.
How are regulations influencing purchasing decisions?
FDA and EU rules demand documented weight records for drug dosing, prompting clinics to invest in certified, connected scales.
What business models are emerging in the veterinary scales industry?
Subscription “scale-as-a-service” contracts bundle hardware, calibration, and analytics, converting capital costs to predictable operating fees.
Page last updated on:


