
Veterinary Diagnostics Market Size and Share
Market Overview
| Study Period | 2020 - 2031 |
|---|---|
| Market Size (2026) | USD 9.53 Billion |
| Market Size (2031) | USD 15.05 Billion |
| Growth Rate (2026 - 2031) | 9.57 % |
| Fastest Growing Market | Asia Pacific |
| Largest Market | North America |
| Market Concentration | Medium |
Major Players *Disclaimer: Major Players sorted in no particular order Image © Mordor Intelligence. Reuse requires attribution under CC BY 4.0. | |
Veterinary Diagnostics Market Analysis by Mordor Intelligence
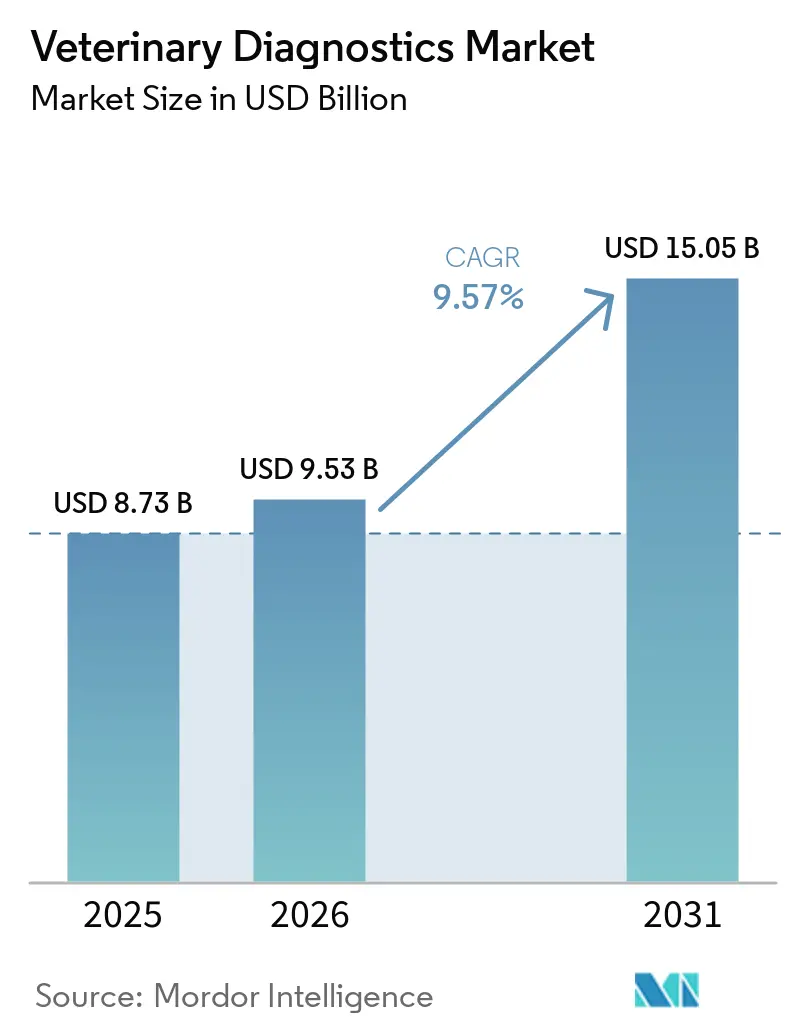
The Veterinary Diagnostics Market size was valued at USD 8.73 billion in 2025 and is estimated to grow from USD 9.53 billion in 2026 to reach USD 15.05 billion by 2031, at a CAGR of 9.57% during the forecast period (2026-2031).
Companion-animal humanization, mandatory livestock disease surveillance, and artificial-intelligence-enabled point-of-care systems are reshaping diagnostic demand, compressing turnaround times from days to hours and allowing veterinarians to start treatment before reference-lab confirmation. Robust pet insurance uptake in North America and parts of Europe is softening price sensitivity, while rising disposable income in China and India supports higher diagnostic spending per visit. Meanwhile, governments in Asia-Pacific, Latin America, and Africa continue to fund mass screening programs for transboundary diseases such as African swine fever and avian influenza, converting once-episodic test purchasing into predictable, compliance-driven volumes.
Key Report Takeaways
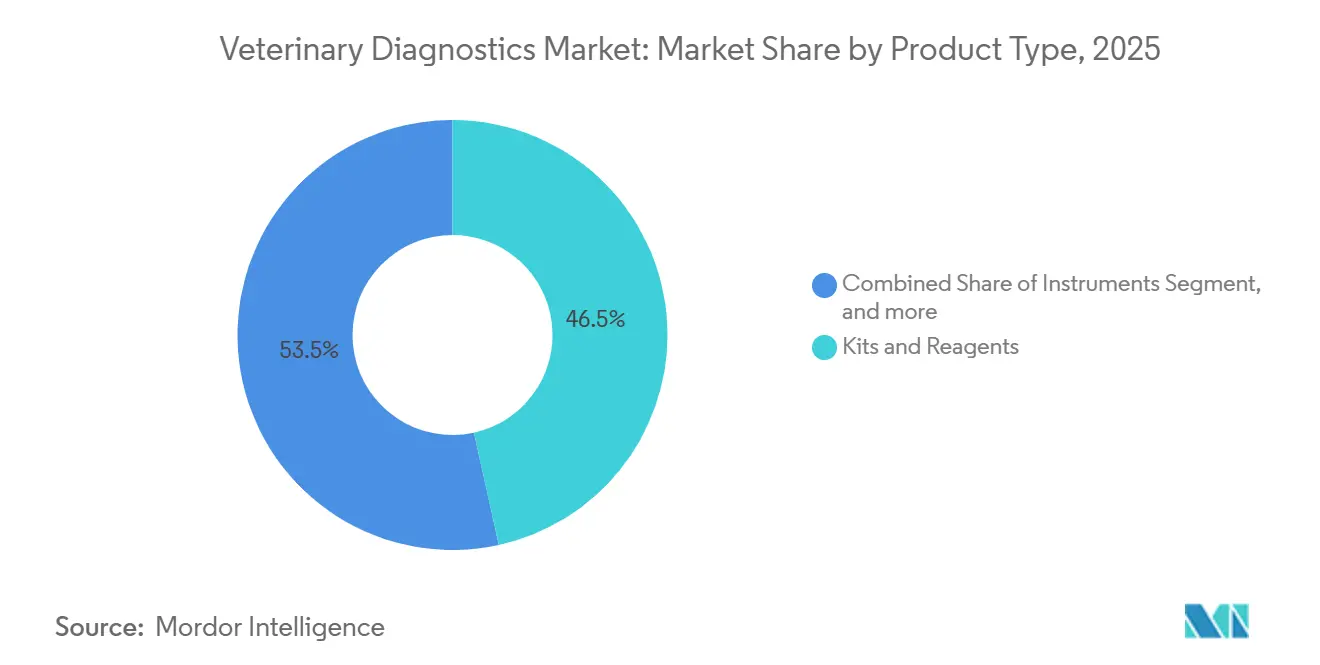
- By product type, kits and reagents held 46.54% of the veterinary diagnostics market share in 2025, whereas software and services are projected to grow at an 11.45% CAGR through 2031.
- By technology, immunodiagnostics led with a 38.64% share in 2025, but molecular diagnostics are forecast to expand at an 11.32% CAGR through 2031.
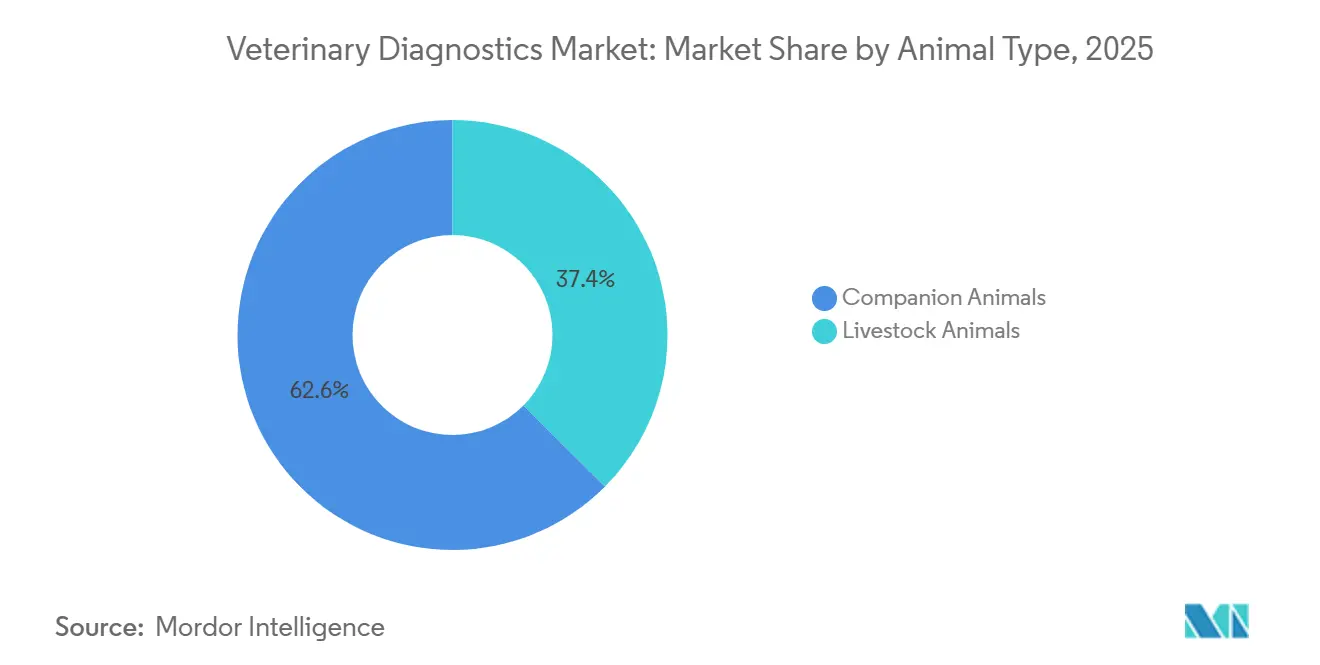
- By animal type, companion animals accounted for 62.56% of the 2025 revenue, while livestock testing is expected to rise at an 11.78% CAGR, driven by mandated herd-health surveillance.
- By end user, veterinary hospitals and clinics captured 55.43% of 2025 revenue, while ambulatory and mobile services are expected to climb at a 12.43% CAGR through 2031.
- By geography, North America commanded 41.45% of the global revenue in 2025, but the Asia-Pacific region is poised for a 10.54% CAGR from 2026 to 2031.
Note: Market size and forecast figures in this report are generated using Mordor Intelligence’s proprietary estimation framework, updated with the latest available data and insights as of January 2026.
Market Trends and Insights
Drivers Impact Analysis of Veterinary Diagnostics Market*
| Driver | (~) % Impact on CAGR Forecast | Geographic Relevance | Impact Timeline |
|---|---|---|---|
| Rising Companion Animal Ownership and Healthcare Spending | +2.1% | Global, with peak intensity in North America, Western Europe, and urban Asia-Pacific | Medium term (2-4 years) |
| Growing Prevalence of Zoonotic and Foodborne Diseases | +1.8% | Global, with acute pressure in Sub-Saharan Africa, Southeast Asia, and Latin America | Short term (≤ 2 years) |
| Technological Advancements in Point-of-Care and Molecular Diagnostics | +2.3% | North America and Europe early adoption, Asia-Pacific rapid scale-up | Long term (≥ 4 years) |
| Expansion of Pet Insurance Coverage and Veterinary Expenditure | +1.5% | North America, United Kingdom, Scandinavia, emerging in Australia and Japan | Medium term (2-4 years) |
| Integration of Artificial Intelligence for Automated Image and Data Analysis | +1.2% | North America and Europe pilot deployments, Asia-Pacific commercial rollout | Long term (≥ 4 years) |
| Government Surveillance Programs Mandating Livestock Disease Screening | +1.4% | Asia-Pacific, Sub-Saharan Africa, Latin America, with spillover to Middle East | Short term (≤ 2 years) |
| Source: Mordor Intelligence | |||
Rising Companion Animal Ownership and Healthcare Spending
Urban Chinese pet owners doubled their annual veterinary spending to CNY 8,200 (USD 1,150) between 2020 and 2025, as the number of single-person households increased. Millennials and Generation Z owners now demand laboratory blood work, thyroid panels, and urinalyses during routine wellness exams, keeping in-clinic chemistry analyzers running near capacity. Enhanced pet-insurance penetration, particularly in North America and Scandinavia, removes cost barriers for advanced imaging and molecular testing. Together, these factors secure a growing baseline for the veterinary diagnostics market.
Growing Prevalence of Zoonotic and Foodborne Diseases
African swine fever outbreaks in Southeast Asia and Eastern Europe triggered compulsory PCR screening for live-pig transport, beginning in 2024, which drove the adoption of rugged, portable analyzers on farms. India’s National Animal Disease Control Programme now covers 600 million bovines, requiring quarterly serological assays for brucellosis and FMD. In 2025, H5N1 detections across 16 U.S. states prompted emergency authorizations for 15-minute antigen tests that help isolate infected herds before viral shedding contaminates food supplies[1]U.S. Department of Agriculture, “Emergency Use Authorization for H5N1 Rapid Tests 2025,” usda.gov. Heightened surveillance budgets are shielding the veterinary diagnostics market from macroeconomic slowdowns.
Technological Advancements in Point-of-Care and Molecular Diagnostics
IDEXX’s SediVue Dx automates urine-sediment microscopy with 96% concordance, while complementary veterinary diagnostic imaging technologies help expand comprehensive testing capabilities in clinics. Zoetis’ Vetscan Imagyst utilizes smartphone cameras and cloud-based AI to detect fecal parasites in under-resourced clinics. Heska’s Element POC blood-gas unit uploads real-time lactate and ionized-calcium values to electronic records, supporting rapid anesthesia adjustments. These innovations decentralize diagnostics, enabling sustained growth in the veterinary diagnostics market.
Government Surveillance Programs Mandating Livestock Screening
Brazil now requires herds of 50 head or more to undergo quarterly brucellosis and tuberculosis tests, driving demand for lateral-flow and interferon-gamma assays. India invested INR 12 billion (approximately USD 145 million) in 2025 to equip 500 mobile diagnostic vans with PCR units and rapid testing kits. The European Animal Health Law links farm-level diagnostics to central databases, accelerating orders for cloud-ready analyzers across the bloc. Compliance-driven spending anchors the veterinary diagnostics market against commodity price swings.
Restraints Impact Analysis of Veterinary Diagnostics Market*
| Restraint | (~) % Impact on CAGR Forecast | Geographic Relevance | Impact Timeline |
|---|---|---|---|
| High Cost of Advanced Diagnostic Instruments and Tests | -1.6% | Global, with acute affordability barriers in Sub-Saharan Africa, South Asia, and rural Latin America | Medium term (2-4 years) |
| Shortage of Skilled Veterinary Diagnostic Professionals | -1.3% | North America, Europe, Australia, with emerging pressure in urban Asia-Pacific | Long term (≥ 4 years) |
| Limited Data Interoperability Slowing Adoption of Connected Diagnostic Platforms | -0.8% | Global, with fragmentation most severe in independent veterinary clinics and small reference laboratories | Medium term (2-4 years) |
| Import Tariffs and Supply Chain Disruptions Affecting Consumable Availability | -0.9% | Latin America, Sub-Saharan Africa, Southeast Asia, with episodic impact in Middle East | Short term (≤ 2 years) |
| Source: Mordor Intelligence | |||
High Cost of Advanced Diagnostic Instruments and Tests
Five-part-differential hematology analyzers list between USD 25,000 and USD 45,000, while reagents add USD 8,000–12,000 annually - out of reach for clinics where a visit averages USD 30. Only 18% of Kenyan practices owned automated chemistry systems in 2025, resulting in a reliance on manual assays and 3- to 5-day result times. Molecular panels for vector-borne diseases run USD 80–120 per test in the United States, and uninsured clients frequently opt for empirical therapy instead, undermining stewardship goals. Subscription bundles and reagent-rental schemes are emerging but remain concentrated in high-volume clinics able to amortize equipment costs.
Shortage of Skilled Veterinary Diagnostic Professionals
Seventy-eight percent of U.S. veterinary practices reported staffing deficits in 2025, especially in pathology and clinical-lab roles. UK pathology residency applications fell 22% from 2020 to 2025 as graduates pivoted to higher-paying emergency care[2]Royal College of Veterinary Surgeons, “Residency Applications Report 2025,” rcvs.org.uk. Australia’s mobile clinics struggle to recruit sonographers for remote regions, thereby limiting their geographic reach despite having strong equipment availability. The veterinary diagnostics market is therefore investing heavily in automation and AI, but regulatory validation demands slow relief to the talent gap.
*Our forecasts treat driver/restraint impacts as directional, not additive. The impact forecasts reflect baseline growth, mix effects, and variable interactions.
Veterinary Diagnostics Market Segment Analysis
By Product Type:
Recurring Reagent Revenue Anchors GrowthKits and reagents generated 46.54% of 2025 revenue, reinforcing a consumable-driven model that secures continuous cash flow for vendors; in contrast, software and services are on track to grow at 11.45% annually, signaling a strategic pivot toward analytics subscriptions within the veterinary diagnostics market. Instruments, although a smaller slice, now feature modular add-on panels such as coagulation or electrolyte modules - that extend their useful life without requiring full replacement.
Cloud-native laboratory information platforms aggregate multi-clinic data, standardize quality control, and enable benchmarking across corporate hospital chains. Zoetis’ Vetscan Cloud and Heska’s bundled reagent-maintenance-AI packages convert capital expenditure into operating expenses, a draw for consolidators seeking predictable margins. This services-led evolution positions vendors to capture a higher share of the veterinary diagnostics market over the forecast window.



By Technology:
Molecular Assays Gain Economic ViabilityImmunodiagnostics accounted for 38.64% of the revenue in 2025, while molecular diagnostics are expected to post an 11.32% CAGR, leveraging declining reagent prices and sample-to-answer automation that eliminates the need for specialized technicians. Classic biochemistry and hematology platforms remain entrenched, although micro-sample capabilities now reduce the required volumes from 1 mL to mere microliters, easing constraints in feline and exotic-pet testing.
IDEXX’s RealPCR has earned USDA approval for non-invasive screening of porcine reproductive and respiratory syndrome (PRRS) via oral fluids, illustrating how molecular workflows are moving from reference labs into barns and exam rooms. Thermo Fisher’s 12-month-stable lyophilized PCR reagents further democratize access in regions with unreliable cold chains. These advances underpin sustained momentum for the veterinary diagnostics market.
By Animal Type:
Livestock Surveillance Mandates Accelerate TestingCompanion animals delivered 62.56% of 2025 demand, yet livestock diagnostics will expand 11.78% per year thanks to mandatory disease-movement testing and food-safety assurances. Dogs and cats still dominate wellness panels and specialty oncology work-ups, but exotic pets are also benefiting from portable blood-gas and ultrasound devices tailored to small volumes.
China now requires PCR certification for all inter-provincial pig shipments, resulting in approximately 150 million tests annually. India’s 500 mobile PCR vans and Brazil’s on-farm avian influenza labs collectively reinforce biosecurity, providing the veterinary diagnostics market with a stable livestock revenue stream independent of commodity cycles.
By End User:
Ambulatory Services Leverage Portable TechnologyVeterinary hospitals and clinics captured 55.43% of 2025 spend, but ambulatory and mobile services are primed for a 12.43% CAGR as practitioners bring diagnostics to farms and living rooms. Reference laboratories continue to consolidate—IDEXX operates 80 facilities worldwide—yet independents still flourish with personalized test menus for exotics and research models.
Mobile practices in the United States increased by 34% from 2020 to 2025, a trend also observed in Australia’s vast livestock regions, where distances to brick-and-mortar facilities exceed 100 km. Ruggedized, battery-powered analyzers and wireless ultrasound units underpin this decentralization, broadening the reach of the veterinary diagnostics market.
Geography Analysis
North America Veterinary Diagnostics Market
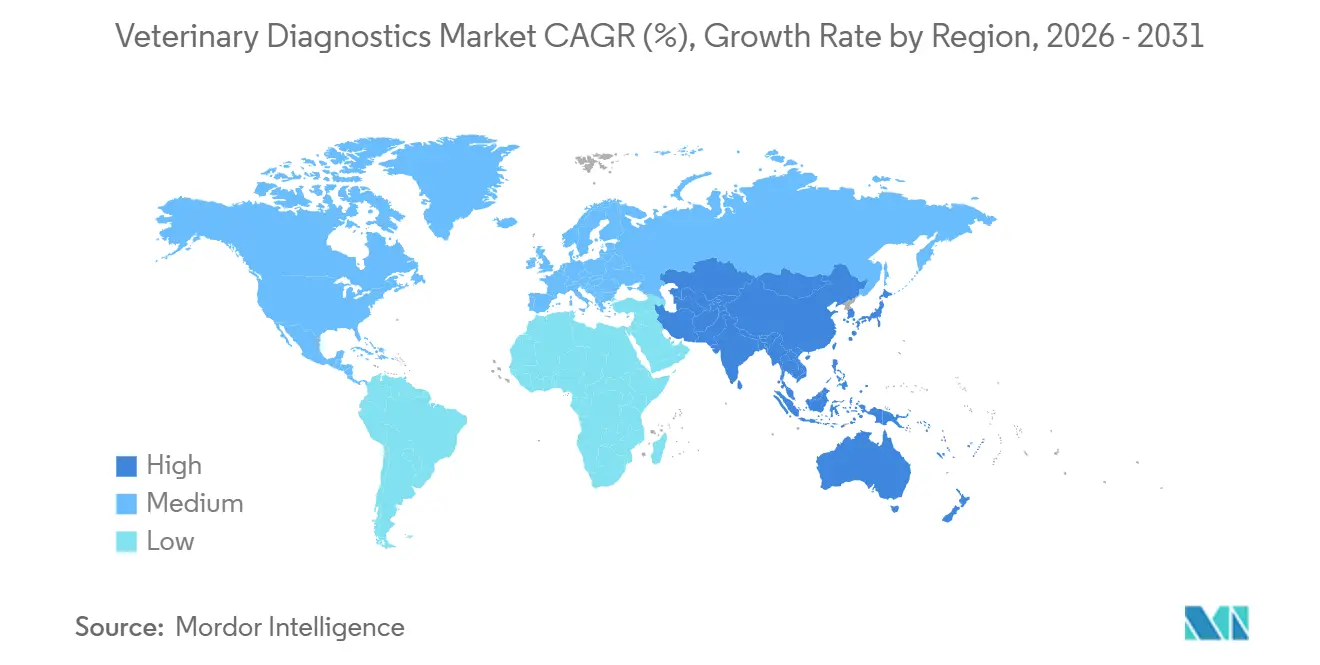
North America accounted for 41.45% of the veterinary diagnostics market revenue in 2025, with the U.S. spending USD 4.2 billion, driven by corporate chains standardizing protocols and leveraging bulk-buy reagent contracts. Canada’s federal subsidies for bovine tuberculosis and chronic wasting disease surveillance further buoy laboratory demand[3]Canadian Food Inspection Agency, “Bovine TB Surveillance Subsidies 2025,” inspection.gc.ca. Strict FDA and Health Canada validation pathways do elongate the time-to-market, but they justify premium pricing once approvals are obtained.
APAC Veterinary Diagnostics Market
The Asia-Pacific region is projected to be the fastest-growing region, with a 10.54% CAGR through 2031. China’s 120 million-strong pet population already mirrors Western per-pet spending in Tier-1 cities, while India’s mobile labs and new district diagnostic centers are closing testing gaps in pastoral belts. Japan’s aging pets create demand for chronic-disease panels, and South Korea’s 12% pet-insurance penetration eases the adoption of high-ticket imaging.
EMEA and South America Veterinary Diagnostics Market
Europe enjoys stable growth, underpinned by high pet insurance take-up and EU-mandated livestock tracking. Germany subsidizes PCR testing for African swine fever in wild boar carcasses, while Spain and France ramp up avian-influenza monitoring ahead of export seasons. The Middle East and Africa register smaller revenues today. Still, they are expected to accelerate as Gulf states invest in food security and African nations receive WOAH-FAO aid for outbreak control. South America, led by Brazil’s poultry and swine integrators, installs on-site PCR labs to meet export-buyer pathogen-free certifications.

Regulatory Landscape
Regulation of veterinary diagnostics spans both product oversight (test kits, IVD systems, and certain diagnostic biologics) and official laboratory approval for reportable animal diseases, creating multi-path compliance for global vendors. In the United States, USDA APHIS oversight through the National Veterinary Services Laboratories (NVSL) governs laboratory approval for official animal disease testing (including requirements under 9 CFR 71.22), while the veterinary biologics framework under the Virus-Serum-Toxin Act (VSTA) requires diagnostic biologics used for diagnosis to meet expectations for purity, safety, potency, and effectiveness.
Internationally, WOAH continues to shape validation and standardization through its Terrestrial Manual and reference reagents program. In January 2026, WOAHs ad hoc group on diagnostic kits met to advance a non-regulatory framework aligned to WOAH standards (explicitly avoiding an international registration construct), and in May 2026 WOAH adopted amendments to the Terrestrial Manual, including updates such as new assay guidance (for example, chemiluminescent western blot chapters). National device-style pathways also influence market entry, including South Africas SAHPRA requirements for Class C and D veterinary medical devices (including IVDs) that rely on evidence of pre-market approval from recognized jurisdictions (Australia, Brazil, Canada, Europe, Japan, USA) or WHO pre-qualification, which increases the importance of globally portable technical files and validation packages.
Value Chain Analysis
The veterinary diagnostics value chain typically runs from target selection and assay or instrument R&D through analytical validation, scale-up manufacturing under controlled quality systems, and regulatory submissions, then moves into distribution of instruments and recurring consumables for clinics, ambulatory providers, and reference laboratories. Large integrated participants (including IDEXX, Zoetis, and Mars/Antech) support menu development alongside commercial channels, while distributors and practice-management supply platforms (such as MWI and Covetrus) extend last-mile reach and support bundled procurement models that package reagents, service, and maintenance on a per-test cost basis.
Operationally, cold-chain and handling requirements are a recurring constraint for rapid-test cassettes and temperature-sensitive reagents. Transport conditions (commonly within a controlled range such as 4-30 degrees Celsius) and freeze protection are important for membrane and conjugate stability. Regulatory access and documentation readiness can also affect lead times and sourcing decisions; in the United States, USDA APHIS Center for Veterinary Biologics can issue Research and Evaluation permits for imported diagnostic test kits when no domestic equivalent exists and risk criteria are met. On the demand side, corporate consolidation among veterinary practices increases buyer concentration, raising the importance of connectivity, quality control, and standardized data management so diagnostic outputs can feed clinic records and public-sector surveillance workflows.
Competitive Landscape
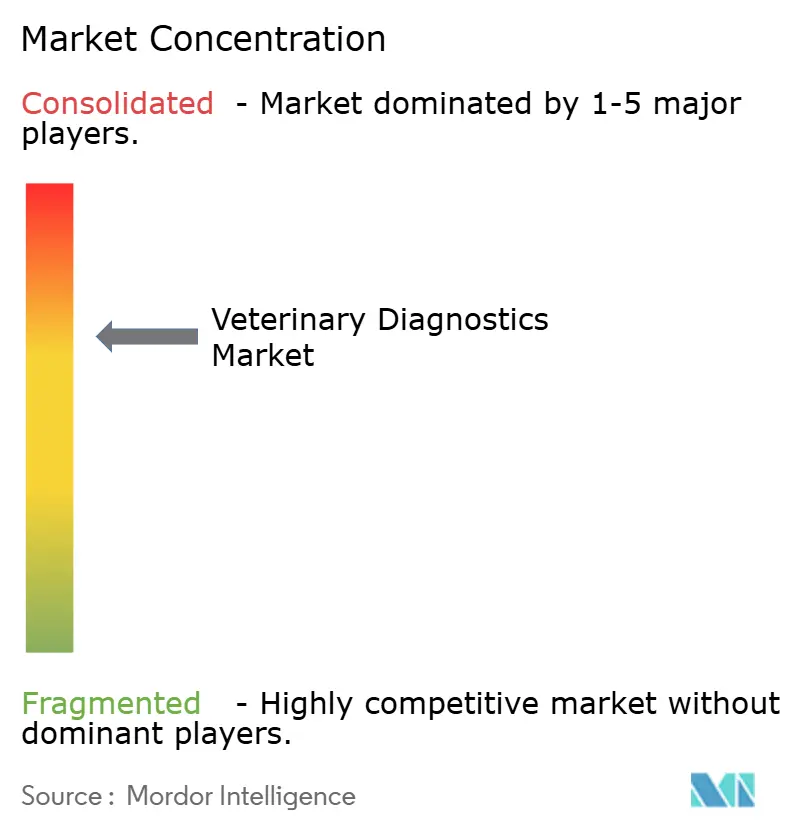
The veterinary diagnostics market is moderately concentrated, with the top five firms - IDEXX, Zoetis, Heska, Boehringer Ingelheim, and Thermo Fisher - holding roughly 60% of 2025 revenue. IDEXX dominates companion-animal point-of-care through closed-cartridge analyzers that lock in consumable sales, while Zoetis bundles diagnostics with pharmaceuticals via its extensive distribution network. Smaller entrants, such as BioNote and Mindray, capture a share in Asia and Latin America by shipping open-architecture systems that accept third-party reagents.
Livestock diagnostics present a white space where vendors with affordable field PCR can outflank incumbents. Heska’s solar-powered lyophilized-reagent prototype targets off-grid pastoral markets. AI-driven image interpretation forms another battleground, with IDEXX, Boehringer Ingelheim, and Antech training convolutional models that flag radiographic or cytologic anomalies, trimming turnaround and offsetting pathologist shortages.
Reference labs continue consolidating for scale, yet nimble independents retain niche authority with flexible panels for exotic species and research contracts.
Veterinary Diagnostics Industry Leaders
Idexx Laboratories
Zoetis, Inc
Thermo Fisher Scientific Inc
Biomérieux SA
Virbac Corporation
- *Disclaimer: Major Players sorted in no particular order
Veterinary Diagnostics Market Companies Covered in this Report
- Abaxis
- Biochek
- bioMérieux
- BioNote Inc.
- Bio-Rad Laboratories
- Boehringer Ingelheim
- Covetrus
- Danaher
- Esaote
- Heska
- IDEXX
- IDVet
- Indical Bioscience
- Mindray
- Neogen
- QIAGEN
- Randox Laboratories
- Thermo Fisher Scientific
- Virbac
- Zoetis

Market Opportunities and Future Outlook
White space in veterinary diagnostics is increasingly linked to faster turnaround, higher clinical confidence, and tighter linkage of results into surveillance and in-clinic workflow systems. Capacity and logistics integration at reference laboratories is showing up as an investment theme: in May 2025, Zoetis opened a 32,000-square-foot reference laboratory at the UPS Healthcare Labport in Louisville, Kentucky, which underscores how co-location with logistics hubs supports higher-throughput sample handling and faster reporting, particularly for panels that remain more economical in centralized labs.
Point-of-care manufacturing scale and specialized menu expansion also offer room for vendors, supported by consolidation and capability building. In December 2025, KVP International acquired SafePath-IVD (Carlsbad, California) to expand point-of-care diagnostics manufacturing and research capabilities, reflecting demand for reliable consumables supply and expanded assay menus. R&D alignment initiatives further inform whitespace in infectious disease diagnostics, where roadmaps and gap analysis approaches (including linking disease priority tools and surveillance datasets such as WAHIS with diagnostics availability frameworks) help developers target assays that match current surveillance needs, including pen-side molecular methods (such as LAMP) and interoperable data platforms intended to reduce fragmentation across independent clinics and smaller laboratories.
Recent Industry Developments in Veterinary Diagnostics Market
- May 2026: IDEXX expanded its Fecal Dx antigen testing platform to add taeniid tapeworm detection, with availability for customers in the United States and Canada starting in late June 2026. The expansion broadens the infectious disease and parasitology menu on an established platform, supporting higher consumable pull-through without requiring new instrument placements.
- April 2026: Zoetis expanded Vetscan OptiCell hematology analyzer capabilities by adding cellular hemoglobin concentration mean (CHCM) and plateletcrit (PCT) parameters. Adding clinically relevant parameters through platform updates strengthens point-of-care value versus send-out testing and increases switching costs for clinics standardized on OptiCell workflows.
- January 2026: IDEXX launched the ImageVue DR50 Plus Digital Imaging System in the United States and Canada. The product refresh reinforces in-clinic imaging adoption with a new hardware offering, supporting attached software and service revenue while tightening integration with clinic diagnostic workflows.


Veterinary Diagnostics Market Report Scope and Research Methodology
Market Definition and Coverage
For this report, the veterinary diagnostics market includes tools and services used to detect, monitor, or confirm animal health conditions through lab and point-of-care testing. This covers instruments, kits and reagents, and related software and services across common diagnostic technologies.
Scope exclusions: veterinary medicines and vaccines, routine treatment procedures, and general clinic supplies are excluded, unless they are sold as part of a diagnostic test workflow.
Segments Covered in This Report
- By Product Type
- Instruments
- Kits And Reagents
- Software And Services
- By Technology
- Immunodiagnostics
- Clinical Biochemistry
- Molecular Diagnostics
- Hematology
- Other Technologies
- By Animal Type
- Companion Animals
- Dogs
- Cats
- Other Companion Animals
- Livestock Animals
- Cattle
- Swine
- Poultry
- Other Livestock Animals
- Companion Animals
- By End-User
- Veterinary Hospitals & Clinics
- Reference Laboratories
- Ambulatory & Mobile Vet Services
- Research Institutes & Universities
- Geography
- North America
- United States
- Canada
- Mexico
- Europe
- Germany
- United Kingdom
- France
- Italy
- Spain
- Rest Of Europe
- Asia-Pacific
- China
- Japan
- India
- Australia
- South Korea
- Rest Of Asia-Pacific
- Middle East And Africa
- GCC
- South Africa
- Rest Of Middle East And Africa
- South America
- Brazil
- Argentina
- Rest Of South America
- North America
Data Sources, Market Sizing, and Validation
Desk Research
Desk research was used to set the demand context and to anchor the model with public, repeatable data series. We leaned on sources such as the USDA and Eurostat for livestock and production indicators, the OIE-WAHIS system for notifiable animal disease signals, and WHO and CDC publications for zoonotic surveillance context. Peer reviewed veterinary journals were also reviewed to understand test adoption patterns by condition and animal type.
On the supply and pricing side, we reviewed company annual reports, investor presentations, product catalogs, and reputable press coverage to map product families and typical usage settings. Where available, paid subscriptions for company financials and intelligence, patent databases, and shipment-level import or export checks were used selectively to validate directional trends and confirm that growth assumptions matched observed activity. These references are illustrative, and many other public sources were also used for data collection, validation, and clarification.
Primary Interviews and Surveys
Primary work focused on interviews and surveys with diagnostics value chain participants, including test developers, distributors, reference labs, and veterinary clinic stakeholders, to confirm what is actually purchased and used across major regions. We used these discussions to check adoption drivers, typical test menus, pricing shifts, and channel differences between companion and livestock settings, and then to close gaps where public data was thin.
Distribution of primary research fieldwork respondents
| Company type | Respondent position | Region |
|---|---|---|
| Top tier: 33% | CXOs: 12% | APAC: 48% |
| Mid tier: 45% | Functional/Unit leaders: 30% | EMEA: 32% |
| Smaller Players: 22% | Managers: 58% | Americas: 20% |
Market-Sizing & Forecasting
Sizing starts with a top-down build where animal population and care-delivery indicators are converted into a diagnosable demand pool by region, then split by common test technology and end-user setting. To keep the totals realistic, we corroborate the outputs with selective bottom-up approximations, such as sampled test volumes multiplied by typical average selling prices, channel checks with labs and clinics, and instrument install base logic where it fits.
Key model inputs include companion animal and livestock populations, clinic and hospital visit intensity, reference lab utilization, test mix changes (for example, molecular versus immunoassay), and price movement for consumables and panels. Since growth drivers are not uniform across regions, scenario analysis is used for the forecast, and the variables are adjusted using expert consensus on preventive testing uptake, disease surveillance intensity, and point-of-care penetration. When bottom-up data is missing for smaller countries, proxy ratios are applied from comparable markets, then normalized back to regional totals during the final roll-up.
Data Validation & Update Cycle
Validation is done through triangulation across independent signals, followed by a second pass that checks for outliers before sign-off. We compare model outputs against external markers such as animal population shifts, reference lab activity signals, and visible pricing ranges for core consumables, and then investigate variances that look inconsistent with the qualitative story.
Reports are refreshed annually, and interim updates are triggered when material events occur, such as major regulatory changes, meaningful technology launches, or sharp shifts in disease surveillance focus. Before delivery, an analyst completes a fresh review so the final numbers reflect the latest available information and the most recent expert inputs.
Mordor Intelligence's Veterinary Diagnostics Market Sizing Compared With Other Published Estimates
Published market values for veterinary diagnostics can look far apart even when they describe the same general theme, because the included revenue streams and timing assumptions are not consistent. Differences also show up when firms mix services and software into product revenue, or when they anchor the demand pool to different animal settings.
Imaging diagnostics revenues are often bundled into broader veterinary diagnostics totals, but imaging sits outside Mordor Intelligence's scope here. That keeps the model tied to in vitro testing instruments, kits and reagents, and related software and services. Beyond scope, gaps also come from how fast test prices are assumed to rise, whether mobile and ambulatory services are counted as a distinct end-user channel, and how quickly point-of-care usage is expected to spread versus reference lab testing.
Benchmark comparison
| Source | Market Size | Gaps in Research Methodology |
|---|---|---|
| Mordor Intelligence | USD 9.53 B (2026) | |
| Global Consultancy A | USD 9.72 B (2026) | Uses a slightly broader revenue capture that can blend adjacent diagnostic categories and applies a higher near-term price progression for test panels in the base year. |
| Industry Publisher B | USD 8.40 B (2025) | Anchors the estimate to a different base year and mixes historical and forecast framing, which can understate the step-up seen as test volumes and consumable pricing expand into 2026. |
The spread across the three figures is explained mostly by what is counted, when it is counted, and how pricing and test mix are carried forward year to year. By keeping inputs traceable to animal volumes, utilization, and realistic pricing checks, the estimate stays repeatable and easier to reconcile during planning discussions.


Key Questions Answered in the Report
What is the current value and projected growth of the veterinary diagnostics market?
The veterinary diagnostics market size is USD 9.53 billion in 2026 and is forecast to reach USD 15.05 billion by 2031, reflecting a 9.57% CAGR.
Which product segment drives the bulk of recurring revenue?
Kits and reagents generated 46.54% of 2025 revenue, anchoring predictable consumable income for manufacturers.
Why are molecular diagnostics gaining traction in veterinary settings?
Reagent cost declines and automated sample-to-answer systems are pushing molecular assays toward an 11.32% CAGR through 2031, enabling rapid on-site pathogen detection.
What factors underpin the rapid expansion of mobile veterinary diagnostics?
Portable analyzers, telemedicine platforms, and client preference for at-home care support a 12.43% CAGR for ambulatory services to 2031.
Which region is expected to grow fastest through 2031?
Asia-Pacific leads with a projected 10.54% CAGR, fueled by rising pet ownership and government-mandated livestock screening programs.
Page last updated on:


 Your data is secure and never sold or shared.


