Market Overview
| Study Period | 2017 - 2030 |
|---|---|
| Forecast Data Period | 2025 - 2030 |
| Historical Data Period | 2017 - 2023 |
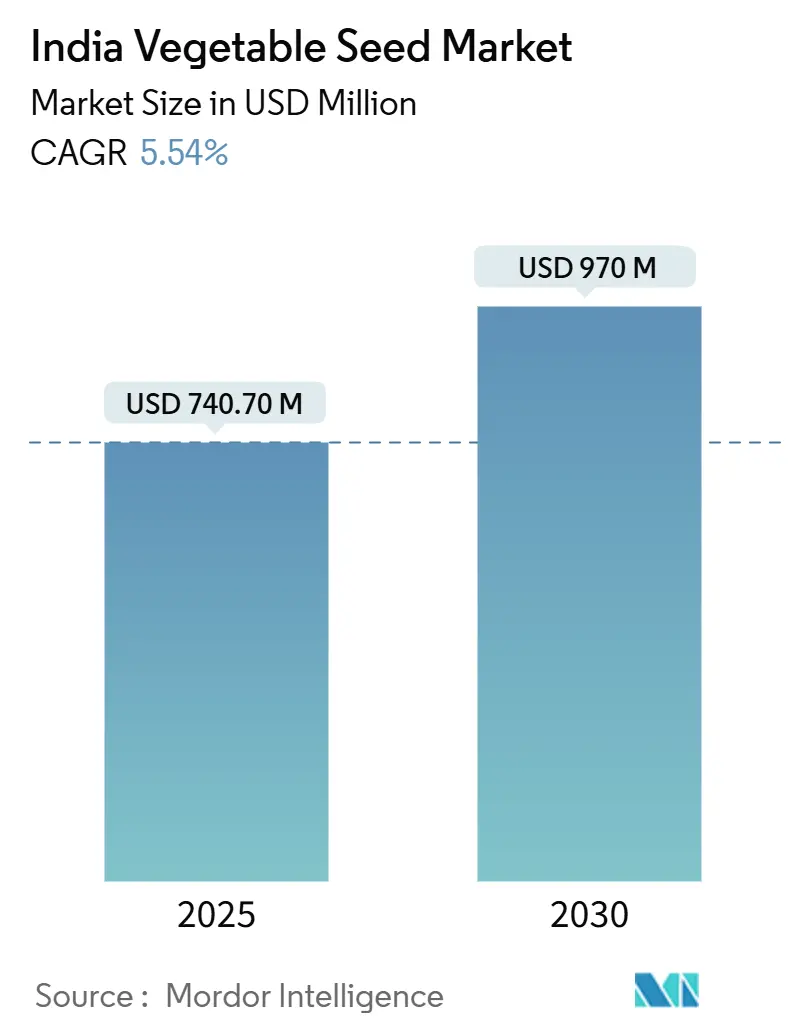
| Market Size (2025) | USD 740.70 Million |
| Market Size (2030) | USD 970 Million |
| Growth Rate (2025 - 2030) | 5.54% CAGR |
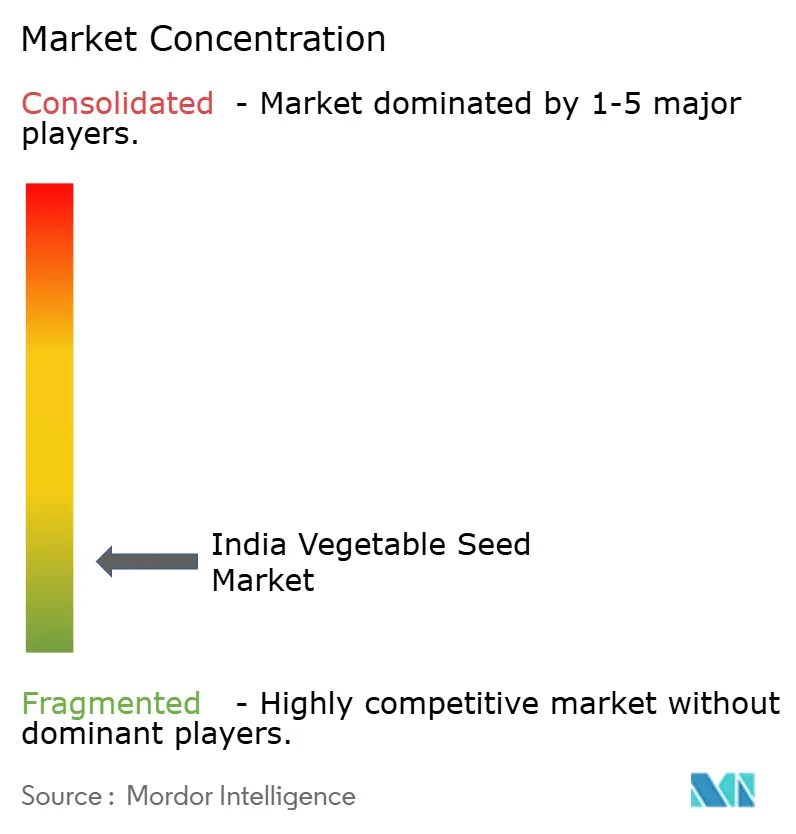
| Market Concentration | Low |
Major Players
*Disclaimer: Major Players sorted in no particular order Image © Mordor Intelligence. Reuse requires attribution under CC BY 4.0. |
|
India Vegetable Seed Market Analysis by Mordor Intelligence
The India vegetable seed market size stands at USD 740.7 million in 2025 and is projected to reach USD 970.0 million by 2030, advancing at a 5.54% CAGR over the forecast period. The current market size reflects farmers’ sustained shift toward superior genetics, while the robust CAGR underscores the sector’s capacity to absorb technology investments even as cost pressures mount. Rapid hybrid-seed penetration, brisk expansion of protected cultivation, widening e-commerce access to tier-2 and tier-3 towns, and government programs that underwrite quality seed purchases collectively underpin the growth outlook. Competitive rivalry remains low because the top five players constitute a minor percentage of overall revenue, leaving ample space for regional specialists and biotechnology start-ups to scale. The market continues to battle counterfeit seed circulation, yet investments in digital traceability and stricter enforcement mechanisms are gradually restoring farmer confidence and stabilizing long-term demand.
Key Report Takeaways
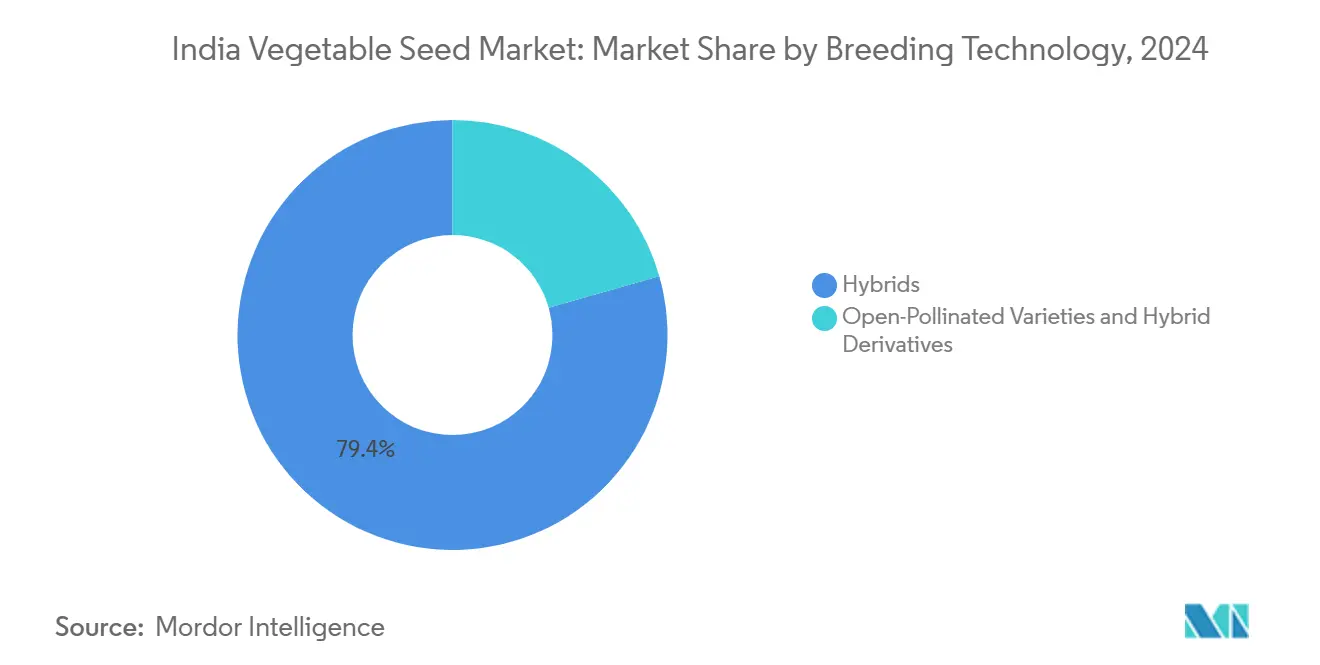
- By breeding technology, hybrids held 79.4% of the India vegetable seed market share in 2024, while open-pollinated varieties and hybrid derivatives are forecast to expand at a 5.7% CAGR to 2030.
- By cultivation mechanism, open-field systems accounted for 99.5% of the India vegetable seed market size in 2024, whereas protected cultivation is projected to grow at an 11.1% CAGR through 2030.
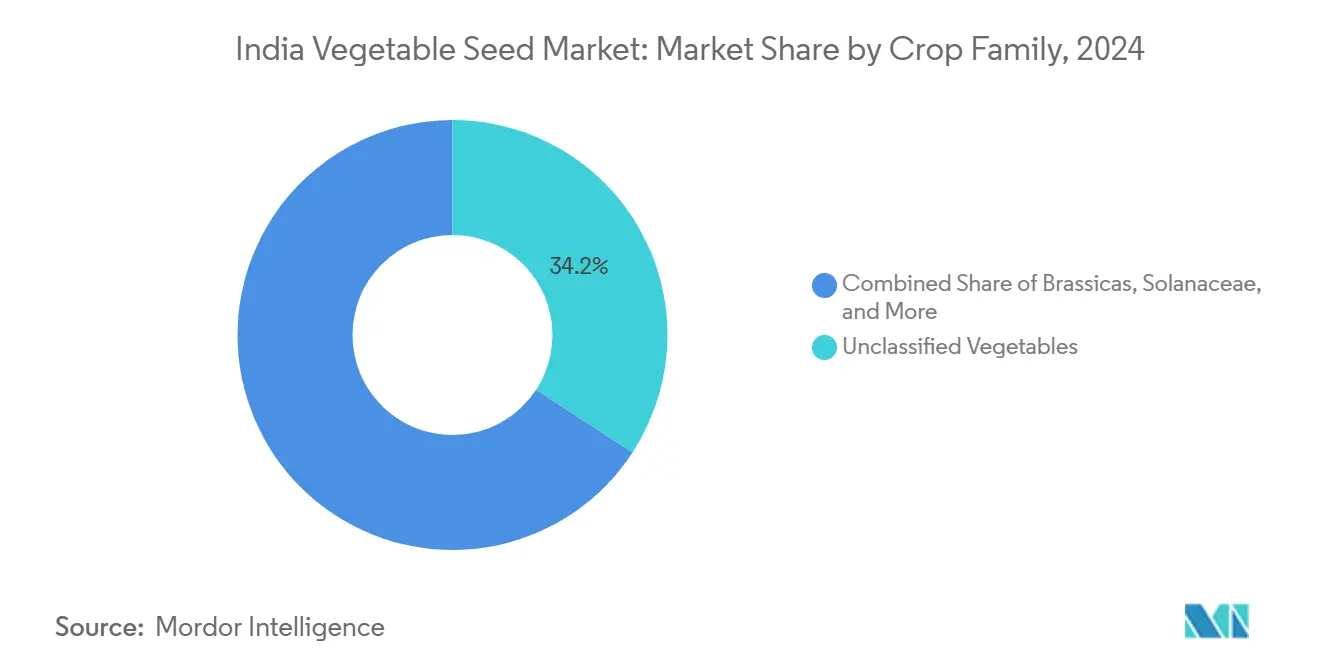
- By crop family, unclassified vegetables commanded 34.2% of the market size in 2024; Solanaceae is set to post the fastest 6.7% CAGR between 2025 and 2030.
- By state, Bihar led with 13.5% revenue share in 2024; Tamil Nadu is on track for the quickest 7.3% CAGR over 2025-2030.
India Vegetable Seed Market Trends and Insights
Drivers Impact Analysis*
| Driver | (~) % Impact on CAGR Forecast | Geographic Relevance | Impact Timeline |
|---|---|---|---|
| Rapid hybrid-seed adoption for yield gains | +1.4% | National; early gains in Punjab, Haryana, and Gujarat | Medium term (2-4 years) |
| Expansion of protected cultivation structures | +1.1% | Maharashtra, Karnataka, and Tamil Nadu | Long term (≥ 4 years) |
| Growth of e-commerce seed portals in tier-2 and tier-3 towns | +0.8% | Uttar Pradesh, Bihar, and Madhya Pradesh | Short term (≤ 2 years) |
| Fortified-trait hybrids for school meal programs | +0.5% | Nutritionally deficient regions nationwide | Medium term (2-4 years) |
| Rising private-sector investment | +0.7% | Research and development hubs in Hyderabad, Bangalore, and Pune | Long term (≥ 4 years) |
| Government-led initiatives boosting seed adoption | +0.6% | Focus on eastern states | Medium term (2-4 years) |
| Source: Mordor Intelligence | |||


Rapid Hybrid-Seed Adoption for Yield Gains
Hybrid seeds deliver yield increases of 25-40% compared to traditional varieties, leading farmers to increase their use of genetically improved cultivars. The Clean Plant Programme, approved in August 2024 with funding of INR 1,765.67 crore (USD 211.2 million), focuses on hybrid seed multiplication, quality assurance, and molecular breeding support[1]Source: Ministry of Agriculture and Farmers Welfare, “Clean Plant Programme Guidelines 2024-25,” AGRICOOP.NIC.IN. Seed companies use marker-assisted selection to develop disease-resistant and climate-resilient varieties in shorter timeframes. States that adopted early, including Punjab, Haryana, and Gujarat, show higher productivity per hectare, influencing adoption across eastern India. Regular updates to the seed certification system strengthen product quality standards and increase farmer trust.
Expansion of Protected Cultivation Structures
The Mission for Integrated Development of Horticulture aims to develop 251,000 hectares of greenhouse and polyhouse area by providing 50-85% capital subsidies to reduce initial investment costs[2]Source: Department of Agriculture and Cooperation, “Mission for Integrated Development of Horticulture,” MIDH.GOV.IN. Maharashtra currently operates more than 15,000 hectares under protected cultivation systems, supported by dedicated credit facilities from the Agriculture Infrastructure Fund. The use of fertigation systems, climate monitoring sensors, and precision seeding equipment improves water and nutrient efficiency while enabling consistent year-round production that yields higher market prices. Seed companies are developing cultivars specifically designed for low-light conditions and compact growth patterns. The India vegetable seed market is anticipated to grow as protected cultivation farms increase their demand for hybrid seeds developed for controlled environment agriculture.
Fortified-Trait Hybrids for School Meal Programs
The Pradhan Mantri Poshan Shakti Nirman scheme, approved on April 1, 2022, for the period 2021-22 to 2025-26, provides daily meals to 118 million children, creating institutional demand for nutrient-dense produce. In 2020, the biofortified carrot variety Madhuban Gajar, developed by a farmer-scientist from Gujarat's Junagadh district, demonstrated high β-carotene and iron content. This variety benefits over 150 local farmers who cultivate it across 200 hectares in Junagadh, with average yields of 40-50 metric tons per hectare, serving as their primary income source[3]Source: Ministry of Science & Technology, "Biofortified Carrot Variety Developed by Farmer Scientist Benefits Local Farmers," PIB.GOB.IN. Seed companies obtain licenses for the germplasm, develop hybrid versions, and secure guaranteed procurement through state education boards. The Food Safety and Standards Authority of India's labeling guidelines help establish consumer confidence. The program's nationwide implementation establishes fortified hybrids as a significant growth segment in India's vegetable seed market for the medium term.
Government-Led Initiatives Boosting Seed Adoption
The National Mission on High-Yielding Seeds, launched in the Union Budget 2025-26, allocates INR 100 crore (USD 12 million) toward nucleus seed production, breeder seeds, and last-mile distribution. State initiatives, including Telangana's Rythu Bandhu and Odisha's KALIA, implement direct cash transfers to subsidize seed purchases and reduce affordability gaps. Mini-kits enable smallholder farmers to access new seed varieties while minimizing adoption risks. The Sub-Mission on Seed and Planting Material strengthens processing units and cold storage facilities to enhance supply chain efficiency. The implementation of single-window clearances streamlines product approval timelines, facilitating private sector investment in hybrid seed development.
Restraints Impact Analysis*
| Restraint | (~) % Impact on CAGR Forecast | Geographic Relevance | Impact Timeline |
|---|---|---|---|
| High hybrid-seed cost for smallholders | -1.1% | Nationwide; acute in eastern and northeastern states | Short term (≤ 2 years) |
| Counterfeit and low-quality seed prevalence | -0.8% | Unorganized retail channels nationwide | Medium term (2-4 years) |
| Pollinator decline in seed-production hubs | -0.5% | Karnataka, Andhra Pradesh, and Tamil Nadu | Long term (≥ 4 years) |
| State transport curbs during pest outbreaks | -0.3% | Select inter-state corridors | Short term (≤ 2 years) |
| Source: Mordor Intelligence | |||
High Hybrid-Seed Cost for Smallholders
Hybrid seeds command prices three to five times higher than traditional varieties, creating financial constraints for Indian farmers who operate on less than two hectares. For example, hybrid tomato seeds cost INR 8,000-12,000 (USD 96-144) per kilogram, compared to INR 2,000-3,000 (USD 24-36) for open-pollinated varieties. Despite mandatory agricultural lending requirements of 18% under priority sector guidelines, financial institutions frequently avoid seed financing due to risk assessment factors and small transaction volumes[4]Source: Reserve Bank of India, “Priority Sector Lending Guidelines for Agriculture,” RBI.ORG.IN. While government subsidies partially offset costs, their implementation remains limited in remote areas with insufficient distribution networks. The market's growth trajectory may face limitations if seed prices continue to remain inaccessible in price-sensitive regions.
State Transport Curbs During Pest Outbreaks
The implementation of quarantine checkpoints by state authorities during pest or disease outbreaks impedes seed deliveries during critical planting periods. The quarantine compliance protocols necessitate supplementary documentation, regulatory inspections, and alternative routing, resulting in increased transportation expenses. The disparate enforcement of the Plant Quarantine Order of 2003 across states presents operational complexities for suppliers conducting business in multiple jurisdictions. Despite central government advisory mechanisms, information deficiencies during rapid disease proliferation frequently result in immediate restrictive measures. These operational constraints affect timely seed distribution, potentially resulting in excess inventory accumulation for suppliers and agricultural delays for farmers.
*Our forecasts treat driver/restraint impacts as directional, not additive. The impact forecasts reflect baseline growth, mix effects, and variable interactions.
Segment Analysis
By Breeding Technology: Hybrids Anchor Volume while Open-Pollinated Varieties and Hybrid Derivatives Accelerate
Hybrids accounted for 79.4% of the India vegetable seed market share in 2024, generating the majority of revenue due to their consistent yields and disease resistance. This market dominance stems from extensive corporate investments in marker-assisted breeding, which has produced region-specific cultivars with precise maturity windows and enhanced nutritional content. Large and medium-scale growers prefer hybrids to optimize per-acre returns, particularly in protected cultivation where controlled conditions maximize genetic potential.
Open-pollinated varieties and hybrid derivatives are projected to grow at a 5.7% CAGR during 2025-2030, exceeding overall market growth. These varieties appeal to cost-conscious farmers in rain-fed regions who benefit from seed saving practices, while organic farmers select them to comply with certification requirements. Seed companies have enhanced open-pollinated lines with improved disease tolerance and uniformity. The Seeds Act facilitates variety registration processes, while public breeding institutions provide free access to germplasm, reducing development costs. These factors drive increased demand in sustainability-focused market segments.


By Cultivation Mechanism: Open-Fields Predominate yet ProtectedCultivation Show Steep Upswing
Open-field farms constituted 99.5% of the India vegetable seed market size in 2024, primarily due to smallholder farmers' reliance on low-capital production methods. Seed volumes remain dependent on monsoon patterns and rural liquidity cycles. Companies develop product portfolios to address diverse soil conditions, offering drought-tolerant cucurbits for arid regions and bacterial wilt-resistant tomato varieties for humid eastern plains. The segment maintains its position as the primary consumption base despite moderate year-on-year growth.
Protected cultivation is anticipated to grow at a CAGR of 11.1%, driven by capital subsidies and reduced infrastructure costs. Farmers using polyhouses prefer hybrids developed for compact growth, high temperature tolerance, and extended fruit set. The combination of sensor-based fertigation and integrated pest management enhances genetic potential, leading to consistent demand for proprietary seeds. The segment's market share is projected to increase as more states allocate horticulture grants for controlled environment agriculture.
By Crop Family: Unclassified Vegetables Provide Bulk while Solanaceae Delivers Pace
Unclassified vegetables, including okra, spinach, carrots, lettuce, and peas, held 34.2% of India's vegetable seed market share in 2024. This dominance reflects the country's diverse culinary requirements and regional preferences, with demand driven by household gardens, peri-urban farms, and institutional kitchens. Institutional buyers typically select versatile seed varieties suitable for different soil conditions, which has led seed breeders to prioritize adaptability and storage characteristics. The segment's size requires seed companies to continuously update their product range to address specific regional preferences and agricultural conditions.
The Solanaceae family, primarily tomato and chili, is projected to grow at a 6.7% CAGR, driven by demand from processing units, quick-service restaurants, and export markets. Seed companies are developing hybrids with enhanced viral resistance and stronger pericarps suitable for mechanical harvesting. In Andhra Pradesh and Karnataka, contract farming arrangements secure seed purchases before the planting season. The increasing consumption of processed sauces and ready-to-eat meals, supported by higher disposable incomes, continues to drive Solanaceae seed market growth.
Geography Analysis
Bihar accounts for 13.5% of the India vegetable seed market size in 2024. The state's market leadership stems from extensive planting areas, hybrid-friendly subsidy programs, and vegetable diversification initiatives under its Agricultural Road Map. The state allocates funds annually for demonstration plots, mini-kit distribution, and farmer training to accelerate technology adoption. Government-operated cold storage facilities and pack-houses reduce post-harvest losses, enabling farmers to secure better prices and invest in quality seeds. Bihar maintains a consistent demand for tomato, brinjal, and leafy green seeds, providing stable revenue for suppliers.
Tamil Nadu projects the highest growth rate at 7.3% CAGR from 2025 to 2030. The state's Uzhavan mobile app advances precision farming by delivering real-time agronomic guidance to over two million registered users[5]Source: Government of Tamil Nadu, “Uzhavan App Impact Assessment,” TAMILNADU.GOV.IN. The strong export focus on gherkin and baby corn drives farmers to adopt premium hybrids that meet strict residue and size requirements. Protected cultivation subsidies and accessible cold-chain infrastructure support high-value seed adoption. These combined factors establish Tamil Nadu as a significant growth driver in the India vegetable seed market.
Maharashtra and Gujarat contribute significant volumes through varied cropping schedules and established private-sector seed production. Maharashtra's extensive greenhouse coverage generates substantial demand for heat-tolerant tomato and long shelf-life cucumber hybrids. Gujarat's Saurashtra region prefers drought-resistant okra and onion varieties adapted to irregular rainfall patterns. Uttar Pradesh and West Bengal utilize their vast alluvial plains for year-round production serving northeastern markets, though small farm sizes maintain high price sensitivity. Odisha, Madhya Pradesh, and Chhattisgarh show growth potential through national crop diversification programs that subsidize hybrid seeds, creating expansion opportunities for seed companies.
Competitive Landscape
The India vegetable seed market maintains a fragmented structure, with the top five players - Syngenta Group, Maharashtra Hybrid Seeds Company Private Limited, UPL Limited (Advanta Seeds Limited), VNR Seeds Private Limited, and BASF SE - holding minority market share in 2024. Syngenta Group maintained a modest market share through its expanded Hyderabad breeding facility and data-driven trait mapping for climate-resilient varieties. Mahyco Private Limited secured a position in the market through its extensive germplasm collection and upgraded Gujarat processing facility. UPL Limited (Advanta Seeds Limited), following its Green Gold Seeds acquisition, is strengthening its tomato and okra portfolio.
Companies are adopting comprehensive agricultural solutions that combine seeds with crop nutrition, biological products, and digital advisory services. Bayer has incorporated seed recommendations into its digital farming platform, currently serving 50,000 farmers across five states. Regional companies like VNR Seeds and East-West Seed concentrate on developing location-specific traits and accessible packaging options to serve lower-income areas. Patent applications increased by 35% in 2024, focusing on drought tolerance, virus resistance, and nutrient enhancement, indicating increased emphasis on product differentiation.
Market concentration varies by crop segment, with tomato and chili markets showing higher consolidation due to complex breeding requirements for disease resistance, while leafy vegetable segments remain more dispersed. Blockchain-based digital traceability systems are becoming significant barriers against counterfeit seeds, benefiting technologically advanced companies. Pending Seeds Act amendments suggest stricter quality standards that may increase capital requirements, potentially favoring companies with strong compliance infrastructure. Competition is projected to increase as companies target emerging opportunities in protected cultivation and nutrient-enriched varieties.
India Vegetable Seed Industry Leaders
-
Syngenta Group
-
Maharashtra Hybrid Seeds Company Private Limited (Mahyco Private Limited)
-
UPL Limited (Advanta Seeds Limited)
-
VNR Seeds Private Limited
-
BASF SE
- *Disclaimer: Major Players sorted in no particular order

Recent Industry Developments
- February 2025: Namdhari Seeds, a vegetable seed breeding company, acquired a 100% stake in Axia's open-field vegetable seed business in the United States. The acquisition includes seed varieties for tomatoes, hot and sweet peppers, melons, watermelons, cucumbers, squash, and eggplant. Through this transaction, Namdhari Seeds incorporated Catalyst Seeds, New World Seeds, and California Hybrids into its operations.
- June 2024: Bayer and Solynta partnered to introduce true potato seeds in India, providing smallholder farmers with disease-free, high-quality planting material as an alternative to seed tubers. This development enhances agricultural sustainability through improved productivity, lower transportation costs, and increased food security in India's significant potato market.


India Vegetable Seed Market Report Scope
Hybrids, Open Pollinated Varieties & Hybrid Derivatives are covered as segments by Breeding Technology. Open Field, Protected Cultivation are covered as segments by Cultivation Mechanism. Brassicas, Cucurbits, Roots & Bulbs, Solanaceae, Unclassified Vegetables are covered as segments by Crop Family. Bihar, Chhattisgarh, Gujarat, Haryana, Madhya Pradesh, Maharashtra, Odisha, Tamil Nadu, Uttar Pradesh, West Bengal are covered as segments by State.
By Breeding Technology
| Hybrids |
| Open-Pollinated Varieties and Hybrid Derivatives |
By Cultivation Mechanism
| Open-Field |
| Protected Cultivation |
By Crop Family
| Brassicas | Cabbage |
| Cauliflower and Broccoli | |
| Other Brassicas | |
| Cucurbits | Cucumber and Gherkin |
| Pumpkin and Squash | |
| Other Cucurbits | |
| Roots and Bulbs | Garlic |
| Onion | |
| Potato | |
| Other Roots and Bulbs | |
| Solanaceae | Chili |
| Eggplant | |
| Tomato | |
| Other Solanaceae | |
| Unclassified Vegetables | Asparagus |
| Lettuce | |
| Okra | |
| Peas | |
| Spinach | |
| Other Unclassified Vegetables |
By State
| Bihar |
| Chhattisgarh |
| Gujarat |
| Haryana |
| Madhya Pradesh |
| Maharashtra |
| Odisha |
| Tamil Nadu |
| Uttar Pradesh |
| West Bengal |
| Other States |
| By Breeding Technology | Hybrids | |
| Open-Pollinated Varieties and Hybrid Derivatives | ||
| By Cultivation Mechanism | Open-Field | |
| Protected Cultivation | ||
| By Crop Family | Brassicas | Cabbage |
| Cauliflower and Broccoli | ||
| Other Brassicas | ||
| Cucurbits | Cucumber and Gherkin | |
| Pumpkin and Squash | ||
| Other Cucurbits | ||
| Roots and Bulbs | Garlic | |
| Onion | ||
| Potato | ||
| Other Roots and Bulbs | ||
| Solanaceae | Chili | |
| Eggplant | ||
| Tomato | ||
| Other Solanaceae | ||
| Unclassified Vegetables | Asparagus | |
| Lettuce | ||
| Okra | ||
| Peas | ||
| Spinach | ||
| Other Unclassified Vegetables | ||
| By State | Bihar | |
| Chhattisgarh | ||
| Gujarat | ||
| Haryana | ||
| Madhya Pradesh | ||
| Maharashtra | ||
| Odisha | ||
| Tamil Nadu | ||
| Uttar Pradesh | ||
| West Bengal | ||
| Other States | ||


Market Definition
- Commercial Seed - For the purpose of this study, only commercial seeds have been included as part of the scope. Farm-saved Seeds, which are not commercially labeled are excluded from scope, even though a minor percentage of farm-saved seeds are exchanged commercially among farmers. The scope also excludes vegetatively reproduced crops and plant parts, which may be commercially sold in the market.
- Crop Acreage - While calculating the acreage under different crops, the Gross Cropped Area has been considered. Also known as Area Harvested, according to the Food & Agricultural Organization (FAO), this includes the total area cultivated under a particular crop across seasons.
- Seed Replacement Rate - Seed Replacement Rate is the percentage of area sown out of the total area of crop planted in the season by using certified/quality seeds other than the farm-saved seed.
- Protected Cultivation - The report defines protected cultivation as the process of growing crops in a controlled environment. This includes greenhouses, glasshouses, hydroponics, aeroponics, or any other cultivation system that protects the crop against any abiotic stress. However, cultivation in an open field using plastic mulch is excluded from this definition and is included under open field.
| Keyword | Definition |
|---|---|
| Row Crops | These are usually the field crops which include the different crop categories like grains & cereals, oilseeds, fiber crops like cotton, pulses, and forage crops. |
| Solanaceae | These are the family of flowering plants which includes tomato, chili, eggplants, and other crops. |
| Cucurbits | It represents a gourd family consisting of about 965 species in around 95 genera. The major crops considered for this study include Cucumber & Gherkin, Pumpkin and squash, and other crops. |
| Brassicas | It is a genus of plants in the cabbage and mustard family. It includes crops such as carrots, cabbage, cauliflower & broccoli. |
| Roots & Bulbs | The roots and bulbs segment includes onion, garlic, potato, and other crops. |
| Unclassified Vegetables | This segment in the report includes the crops which don’t belong to any of the above-mentioned categories. These include crops such as okra, asparagus, lettuce, peas, spinach, and others. |
| Hybrid Seed | It is the first generation of the seed produced by controlling cross-pollination and by combining two or more varieties, or species. |
| Transgenic Seed | It is a seed that is genetically modified to contain certain desirable input and/or output traits. |
| Non-Transgenic Seed | The seed produced through cross-pollination without any genetic modification. |
| Open-Pollinated Varieties & Hybrid Derivatives | Open-pollinated varieties produce seeds true to type as they cross-pollinate only with other plants of the same variety. |
| Other Solanaceae | The crops considered under other Solanaceae include bell peppers and other different peppers based on the locality of the respective countries. |
| Other Brassicaceae | The crops considered under other brassicas include radishes, turnips, Brussels sprouts, and kale. |
| Other Roots & Bulbs | The crops considered under other roots & bulbs include Sweet Potatoes and cassava. |
| Other Cucurbits | The crops considered under other cucurbits include gourds (bottle gourd, bitter gourd, ridge gourd, Snake gourd, and others). |
| Other Grains & Cereals | The crops considered under other grains & cereals include Barley, Buck Wheat, Canary Seed, Triticale, Oats, Millets, and Rye. |
| Other Fibre Crops | The crops considered under other fibers include Hemp, Jute, Agave fibers, Flax, Kenaf, Ramie, Abaca, Sisal, and Kapok. |
| Other Oilseeds | The crops considered under other oilseeds include Ground nut, Hempseed, Mustard seed, Castor seeds, safflower seeds, Sesame seeds, and Linseeds. |
| Other Forage Crops | The crops considered under other forages include Napier grass, Oat grass, White clover, Ryegrass, and Timothy. Other forage crops were considered based on the locality of the respective countries. |
| Pulses | Pigeon peas, Lentils, Broad and horse beans, Vetches, Chickpeas, Cowpeas, Lupins, and Bambara beans are the crops considered under pulses. |
| Other Unclassified Vegetables | The crops considered under other unclassified vegetables include Artichokes, Cassava Leaves, Leeks, Chicory, and String beans. |


Research Methodology
Mordor Intelligence follows a four-step methodology in all our reports.
- Step-1: IDENTIFY KEY VARIABLES: In order to build a robust forecasting methodology, the variables and factors identified in Step-1 are tested against available historical market numbers. Through an iterative process, the variables required for market forecast are set and the model is built on the basis of these variables.
- Step-2: Build a Market Model: Market-size estimations for the forecast years are in nominal terms. Inflation is not a part of the pricing, and the average selling price (ASP) is kept constant throughout the forecast period.
- Step-3: Validate and Finalize: In this important step, all market numbers, variables and analyst calls are validated through an extensive network of primary research experts from the market studied. The respondents are selected across levels and functions to generate a holistic picture of the market studied.
- Step-4: Research Outputs: Syndicated Reports, Custom Consulting Assignments, Databases, and Subscription Platforms


