Market Overview
| Study Period | 2021 - 2031 |
|---|---|
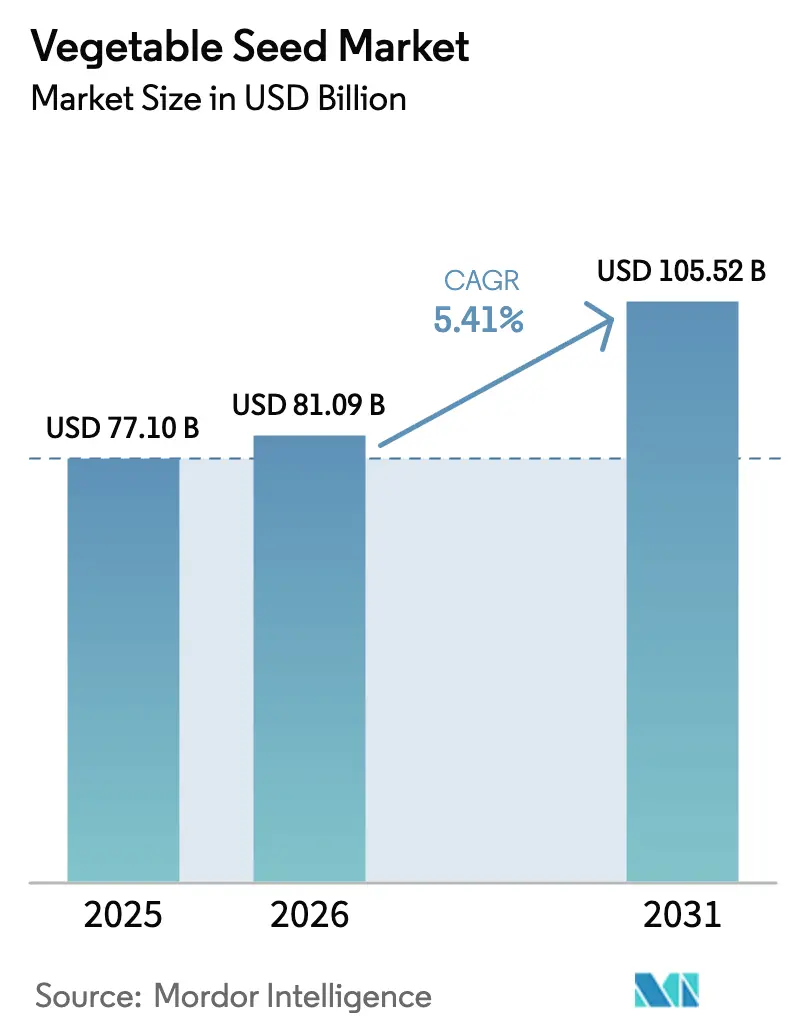
| Market Size (2026) | USD 81.09 Billion |
| Market Size (2031) | USD 105.52 Billion |
| Growth Rate (2026 - 2031) | 5.41% CAGR |
| Fastest Growing Market | North America |
| Largest Market | North America |
| Market Concentration | Medium |
Major Players *Disclaimer: Major Players sorted in no particular order Image © Mordor Intelligence. Reuse requires attribution under CC BY 4.0. | |
Vegetable Seed Market Analysis by Mordor Intelligence
The vegetable seed market size was valued at USD 77.10 billion in 2025 and estimated to grow from USD 81.09 billion in 2026 to reach USD 105.52 billion by 2031, at a CAGR of 5.41% during the forecast period (2026-2031). Hybrid penetration in Asia-Pacific, expanding protected-cultivation acreage in arid regions, and rapid gene-editing breakthroughs are shortening breeding cycles and lifting average seed prices. Retail demand for premium produce with uniform appearance and extended shelf life is steering investment toward trait-stacked hybrids, while climate-resilience requirements are channeling R&D into heat, drought, and salinity tolerance. Vertical farms in North America and Europe are specifying dwarf lettuce and spinach cultivars with predictable 28-day harvest cycles, creating a high-margin niche within the vegetable seed market.
Key Report Takeaways
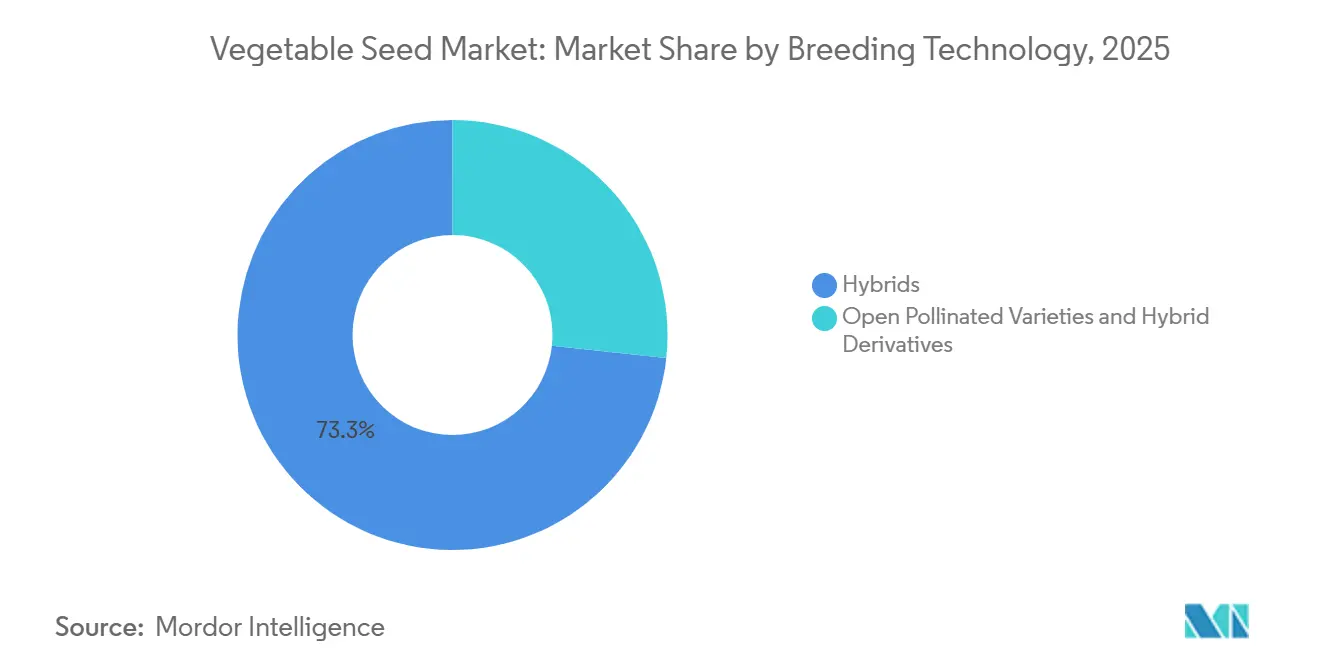
- By breeding technology, hybrids held 73.3% of the vegetable seed market share in 2025, and hybrids are projected to expand at a 5.6% CAGR through 2031.
- By cultivation mechanism, open-field systems accounted for 99.6% of the vegetable seed market share in 2025, while protected cultivation is forecast to grow at a 7.4% CAGR through 2031.
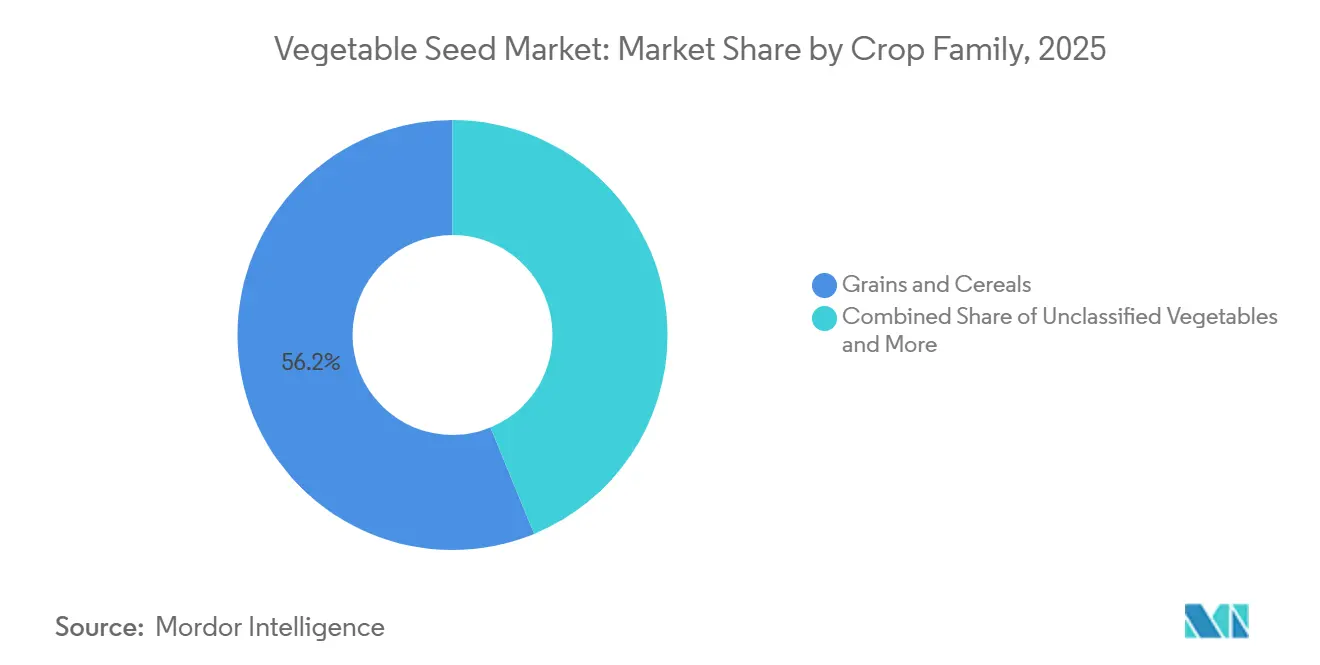
- By crop family, Grains & Cereals led with 56.2% of the vegetable seed market share in 2025, and Unclassified Vegetables are advancing at a 6.8% CAGR through 2031.
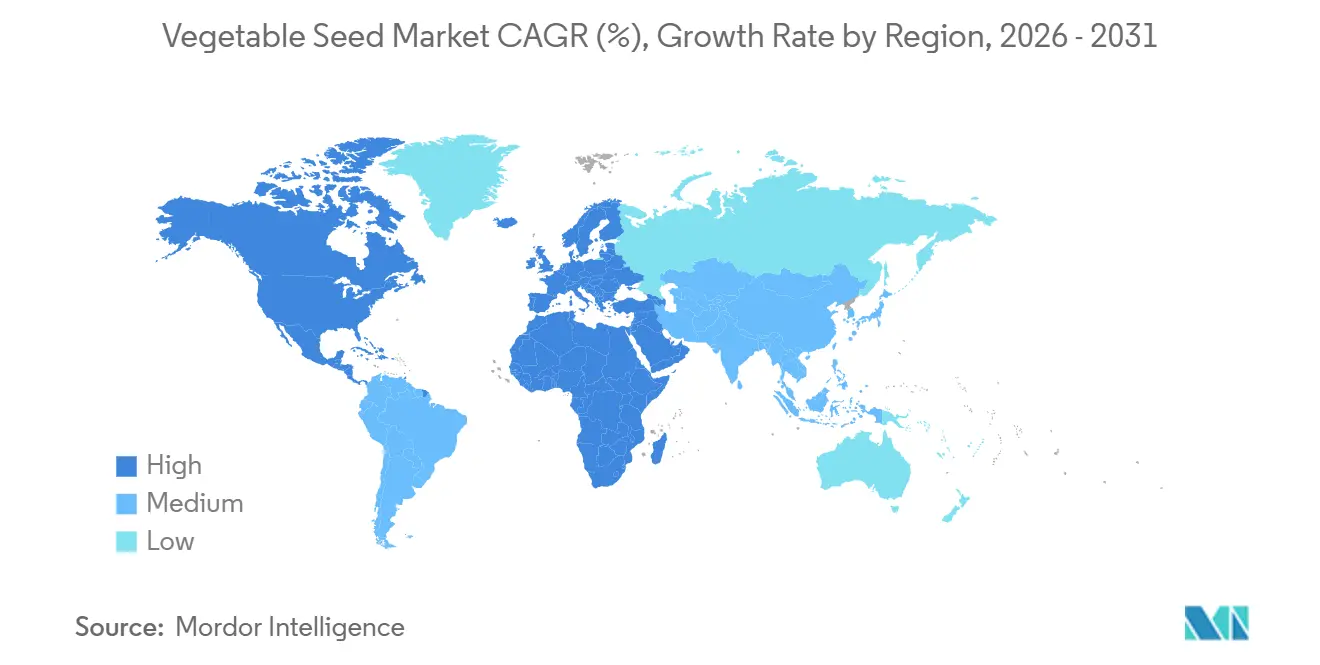
- By geography, North America captured a 33.7% share of the vegetable seed market in 2025, and is set to post the fastest regional growth at a 6.4% CAGR through 2031.
Note: Market size and forecast figures in this report are generated using Mordor Intelligence’s proprietary estimation framework, updated with the latest available data and insights as of 2026.
Global Vegetable Seed Market Trends and Insights
Drivers Impact Analysis*
| Driver | (~) % Impact on CAGR Forecast | Geographic Relevance | Impact Timeline |
|---|---|---|---|
| Hybrid-adoption in emerging economies | +1.8% | Asia-Pacific core, spill-over to Africa and South America | Medium term (2-4 years) |
| Shifting consumer demand for year-round premium produce | +1.2% | Global, with intensity in North America and Europe | Short term (≤ 2 years) |
| Rise of protected cultivation in arid regions | +1.5% | Middle East and North Africa, secondary in Australia | Medium term (2-4 years) |
| Gene-edited “speed breeding” breakthroughs | +1.0% | North America, Brazil, Australia, and Japan | Long term (≥ 4 years) |
| Vertical-farm seed-specification boom | +0.6% | North America and Europe, pilot projects in Asia-Pacific | Long term (≥ 4 years) |
| Climate-resilient varieties for abiotic-stress tolerance | +1.4% | Global, with peaks in Sub-Saharan Africa, South Asia, and Middle East | Medium term (2-4 years) |
| Source: Mordor Intelligence | |||
Hybrid Adoption Accelerates In Emerging Economies
Smallholder farmers in India, China, and Southeast Asia are increasingly replacing open-pollinated varieties with F1 hybrids. This shift is driven by government subsidy programs and effective extension services that promote hybrid adoption in countries such as India, Brazil, and Vietnam. India's Sub-Mission on Seed and Planting Material disbursed INR 12 billion (USD 144 million) in 2025 to support hybrid vegetable seed purchases, prioritizing tomato, chili, and onion [1]Source: Indian Council of Agricultural Research, “Vegetable Seed Production Technology,” icar.org.in. Local seed production hubs are being established to streamline supply chains and develop varieties tailored to regional climates, further encouraging hybrid adoption. Additionally, multinational companies are setting up breeding stations to leverage these opportunities. These advancements contribute to productivity improvements, helping to reduce yield gaps and strengthen domestic food security in densely populated regions.
Shifting Consumer Demand For Year-Round Premium Produce
Retail chains in North America and Europe are increasing their requirements for vegetable appearance, shelf life, and flavor consistency. This trend is driving growers to adopt premium hybrid seed with traits designed to support long-distance logistics. For instance, Walmart and Tesco now mandate that tomato suppliers use varieties with extended vine life and uniform red color. These traits, which incur seed royalties ranging from USD 80 to USD 120 per kilogram, help reduce post-harvest losses by 15% to 20%. This shift is steering seed research and development (R&D) toward consumer-focused attributes such as sweetness in bell peppers, crunchiness in cucumbers, and reduced bitterness in eggplant qualities that were previously secondary to agronomic yield. Additionally, the growing popularity of meal-kit services and pre-cut salad packaging is driving demand for lettuce and spinach cultivars that bolt slowly and oxidize minimally after cutting. Vertical-farm operators are now incorporating these specifications into their seed-purchase contracts.
Vertical-Farm Seed-Specification Boom
Indoor farming operators are increasingly seeking vegetable cultivars with compact architecture, rapid maturity, and predictable nutrient uptake requirements that traditional field-bred varieties cannot fulfill. Companies like AeroFarms and Plenty Unlimited are collaborating with seed producers to develop proprietary lettuce and spinach varieties with 28-day harvest cycles, 40% shorter than those of conventional greenhouse varieties. These cultivars also feature root systems optimized for aeroponic and hydroponic nutrient delivery. The development of these ultra-short-cycle cultivars relies on traits such as dwarf gene stacks and photoperiod insensitivity. Seed breeders are sourcing these traits from wild relatives and incorporating them through marker-assisted selection. As the global vertical farming market expands, the demand for specialized seed is projected to grow annually, creating a high-margin niche for breeders who collaborate with farm operators to co-develop tailored varieties.
Climate-Resilient Varieties for Abiotic-Stress Tolerance
Heat waves, droughts, and soil salinization are driving growers to adopt vegetable varieties with improved tolerance to abiotic stresses. This shift is influencing breeding priorities, moving the focus from yield maximization to stress resilience. The International Center for Agricultural Research in the Dry Areas introduced heat-tolerant tomato germplasm in 2025, capable of maintaining fruit set at temperatures up to 38 degrees Celsius 4 degrees higher than conventional hybrids. This trait was derived from wild Solanum species native to Peru. Similarly, India's Indian Council of Agricultural Research validated salinity-tolerant onion varieties in 2024, which can produce marketable bulbs in soils with electrical conductivity up to 8 dS/m. This advancement has enabled onion cultivation in coastal regions previously unsuitable for production. Breeding for abiotic stress tolerance typically requires 6 to 8 years of multi-location trials to confirm performance under varying stress conditions. Gene-editing tools are beginning to reduce this timeline by allowing direct manipulation of stress-response pathways.
Restraints Impact Analysis*
| Restraint | (~) % Impact on CAGR Forecast | Geographic Relevance | Impact Timeline |
|---|---|---|---|
| High royalty costs for patented traits | -0.9% | Global, with acute impact in South Asia and Sub-Saharan Africa | Short term (≤ 2 years) |
| Regulatory delays for gene-edited cultivars | -0.7% | European Union, with secondary effects in South America | Long term (≥ 4 years) |
| Germplasm piracy and informal seed trade | -0.6% | South Asia, Sub-Saharan Africa, and parts of Southeast Asia | Medium term (2-4 years) |
| Rising incidence of seed-borne pathogens | -0.5% | Global, with hotspots in tropical and subtropical zones | Short term (≤ 2 years) |
| Source: Mordor Intelligence | |||
Germplasm Piracy and Informal Seed Trade
In South Asia and Sub-Saharan Africa, weak enforcement of plant variety protection laws has enabled the unauthorized reproduction of proprietary hybrid seed. This practice negatively impacts revenue and discourages investment in breeding programs for these regions. Counterfeit seed often include off-type varieties or lower-generation hybrids with reduced performance. To address this issue, seed companies are using molecular markers and DNA fingerprinting to verify seed authenticity and pursue legal action against counterfeiters. However, enforcement remains inconsistent due to under-resourced agricultural inspectorates in these areas. Blockchain-based seed traceability systems have emerged as a potential solution, though their adoption is currently limited to premium market segments where buyers are willing to pay extra for provenance assurances.
Rising Incidence of Seed-Borne Pathogens
Outbreaks of seed-borne pathogens, such as bacterial canker in tomatoes and angular leaf spot in cucumbers, are leading to product recalls and diminishing farmer confidence in the quality of hybrid seed. In 2025, the United States Department of Agriculture Animal and Plant Health Inspection Service quarantined 18 seed lots due to contamination with Clavibacter michiganensis, a bacterium that causes bacterial canker and can reduce tomato yields by 50% to 80% [2]Source: USDA Animal and Plant Health Inspection Service, “Seed-Borne Pathogen Quarantines 2025,” aphis.usda.gov . To address these challenges, seed companies are adopting measures such as hot-water treatments, chlorine dioxide fumigation, and biological seed coatings to eliminate pathogens. These interventions increase production costs by USD 10 to USD 30 per kilogram and may reduce germination rates by 2% to 5%. Additionally, climate change is exacerbating the issue by expanding the geographic range of seed-borne fungi and bacteria into previously temperate regions. This trend is compelling breeders to focus on developing disease-resistant cultivars suited for warming climates.
*Our forecasts treat driver/restraint impacts as directional, not additive. The impact forecasts reflect baseline growth, mix effects, and variable interactions.
Segment Analysis
By Breeding Technology: Hybrids Dominate, Gene Editing Accelerates
Hybrids held 73.3% of the vegetable seed market share in 2025 and are projected to expand at a 5.6% CAGR through 2031, a dominance rooted in their yield advantage and uniformity, traits that processors and retailers demand for supply-chain efficiency. The shift toward hybrids is most pronounced in Asia-Pacific, where government subsidy programs in India and China reduced hybrid seed costs by 30% to 50% in 2025, accelerating the replacement of Open-Pollinated Varieties (OPVs) in tomato, cucumber, and onion.
Gene-edited hybrids are attracting R&D investment because they enable trait stacking in 5 years rather than the 8 to 10 years required for conventional backcrossing, a speed advantage that is critical for responding to emerging pest pressures and climate stresses. Hybrid derivatives, which are second- or third-generation seed saved from F1 hybrids, occupy a gray zone in developing markets where enforcement of plant variety protection is weak. Hybrid penetration will intensify where tractors and optical sorters require even plant spacing and synchronized ripening. Gene-edited parental lines entering trial plots in California and Shandong are forecast to add another layer of disease resistance and firmness, reinforcing the hybrids’ performance edge. Royalty fatigue among smaller growers keeps a viable niche for public-sector open-pollinated lines.


By Cultivation Mechanism: Protected Systems Gain Share
Open-field systems accounted for 99.6% of the vegetable seed market share in 2025, serving the bulk commodity vegetable market. These systems prioritize cost efficiency and large-scale production to address global food security needs. Traditional farming systems remain prevalent in regions such as Asia, Africa, and South America. Open-field cultivation continues to dominate the production of staple vegetables like onions, potatoes, and cabbage, where mechanized harvesting and large plot sizes support the use of lower-cost seed and extensive agronomic practices.
Protected cultivation is projected to grow at a compound annual growth rate (CAGR) of 7.4% through 2031, driven by increased investments in climate-controlled infrastructure in regions such as the Middle East, North Africa, and parts of Europe. For instance, Saudi Arabia's National Agriculture Development Company allocated USD 1.06 billion in 2025 to expand greenhouse capacity for crops such as tomatoes, cucumbers, and bell peppers. These efforts focus on seed varieties with salinity tolerance and heat resilience, traits that open-field cultivars typically lack. The shift to protected cultivation is particularly advanced in water-scarce regions, where technologies such as drip irrigation and controlled environments reduce water use by 60% to 80%. This sustainability advantage is attracting both government incentives and private sector investments.
By Crop Family: Grains & Cereals Leads, Unclassified Vegetables Surge
Grains and cereals are projected to lead the vegetable seed market with a 56.2% market share in 2025. These crops, including wheat, rice, maize, and barley, are staple foods with consistently high demand for food security and commercial farming. Farmers prioritize their cultivation because of its essential role in daily diets and large-scale agricultural production. Consequently, seed companies invest heavily in enhancing yields, disease resistance, and climate adaptability for these crops, reinforcing their dominant position in the overall seed market.
Unclassified vegetables are projected to grow at a 6.8% CAGR through 2031. This category encompasses a diverse range of minor, regional, and specialty vegetables not classified under major crop types. The increasing popularity of these crops is driven by shifting consumer preferences, rising demand for varied diets, and the growth of kitchen gardening and niche farming. Their combined market volume, diversity, and expanding cultivation contribute to their significant and growing role in the vegetable seed market.
Geography Analysis
North America accounted for a 33.7% share of the vegetable seed market in 2025 and is projected to achieve the fastest regional growth, with a 6.4% CAGR through 2031. This growth reflects a moderate pace due to market maturity and the dominance of large-scale commercial growers who have already adopted hybrid technology. The United States remains the largest market in the region, with California's Central Valley and Florida's vegetable belt driving demand for drought-tolerant cucumber and heat-tolerant tomato hybrids. Additionally, Mexico's vegetable export sector, which supplies 60% of the United States' winter tomato and pepper imports, is transitioning to protected cultivation systems. These systems require specialized greenhouse cultivars with disease resistance and extended shelf life.
Europe exhibits the slowest regional growth, constrained by regulatory delays for gene-edited cultivars and limited opportunities for acreage expansion. The European Union's ongoing debate over gene-editing regulations is stalling commercial pipelines, with no approvals projected before 2028. France and Germany, the region's largest markets, are focusing on organic and heirloom vegetable varieties to meet consumer demand for sustainable, traceable food. This trend supports the growth of open-pollinated varieties and niche seed companies.
The South American market is expanding, led by the growing vegetable export sectors of Brazil and Argentina. In 2025, Brazil's Ministry of Agriculture approved three gene-edited vegetable varieties, including a high-lycopene tomato and a drought-tolerant bell pepper, positioning the country as a leader in the commercialization of gene editing [3]Source: Brazil Ministry of Agriculture, “Gene-Editing Approvals for Horticulture 2025,” gov.br . The region's growth is moderated by economic instability in Argentina and regulatory uncertainty in smaller markets such as Colombia and Peru. These factors are delaying infrastructure investments and the adoption of hybrid seed. The Middle East market is experiencing growth driven by government investments in protected cultivation infrastructure to reduce food import dependency. These initiatives are projected to support the adoption of advanced vegetable seed varieties tailored to the region's climatic conditions.

Competitive Landscape
The vegetable seed market is fragmented, with key players including BASF SE, Bayer AG, Groupe Limagrain, Rijk Zwaan Zaadteelt en Zaadhandel BV, and Sakata Seed Corporation. Bayer AG leverages its Crop Science R&D network to introduce CRISPR-assisted tomato and pepper hybrids, reducing breeding time by one-third. Groupe Limagrain emphasizes region-specific breeding programs for Solanaceae and leafy greens through subsidiaries in Turkey and India. Sakata Seed Corporation invests in stress-tolerant cucurbits to address yield losses caused by droughts in Southeast Asia. Rijk Zwaan Zaadteelt en Zaadhandel BV maintains its premium lettuce franchise by combining extended shelf life with compatibility for automation in vertical farming systems. BASF SE integrates its biological crop protection portfolio with disease-resistant seed offerings to deliver comprehensive farm-gate solutions.
Mid-tier companies like East-West Seed and Takii and Company Limited excel in localized breeding tailored to tropical smallholder farmers. Emerging players, such as 80 Acres Farms, collaborate with genetic laboratories to co-develop seed lines exclusively for indoor farming. Global leaders protect their germplasm through tiered licensing and stewardship programs, although piracy remains a challenge, prompting the adoption of molecular tags for seed lot authentication.
Collaborations between seed companies and agritech startups are increasing. Recent agreements connect gene-editing firms with conventional breeders to accelerate the commercialization of high-value traits, particularly those related to nutrient enhancement and abiotic stress tolerance. Venture funding is shifting toward platforms that integrate genomic data with predictive modeling, aiming to reduce variety testing costs by 50%.
Vegetable Seed Industry Leaders
BASF SE
Bayer AG
Groupe Limagrain
Rijk Zwaan Zaadteelt en Zaadhandel BV
Sakata Seeds Corporation
- *Disclaimer: Major Players sorted in no particular order


Recent Industry Developments
- July 2025: DENSO acquired Netherlands-based Axia Vegetable Seeds to enhance its agricultural technology capabilities and advance sustainable agriculture through tomato seed development. The acquisition focuses on combining artificial intelligence and automation to develop climate-resilient, high-yield seed solutions for greenhouse farming.
- February 2025: Advanta Seeds and KPAGRO established a sweet corn seed drying facility in Lopburi, Thailand, to improve seed quality and processing efficiency. This facility reinforces Thailand's position as a global center for tropical sweet corn seed production.
- March 2024: Syngenta Vegetable Seeds has opened a Seed Health Lab in India to improve seed quality and phytosanitary compliance globally. The facility will support diagnostic testing and strengthen India's position in the international seed trade.


Global Vegetable Seed Market Report Scope
Vegetable seeds are mature, fertilized ovules of vegetable plants that contain an embryonic plant, a food reserve, and a protective coat. They function as the primary reproductive units used for sowing to cultivate new edible plants. These seeds are critical agricultural inputs for growing crops such as tomatoes, lettuce, and carrots. The Vegetable Seed Market Report is Segmented by Breeding Technology (Hybrids and Open Pollinated Varieties and Hybrid Derivatives), Cultivation Mechanism (Open Field and Protected Cultivation), Crop Family (Brassicas, Cucurbits, Roots and Bulbs, and More), and Geography (North America, South America, Europe, Africa, and More). The Market Forecasts are Provided in Terms of Value (USD) and Volume (Metric Tons).
Breeding Technology
| Hybrids |
| Open Pollinated Varieties and Hybrid Derivatives |
Cultivation Mechanism
| Open Field |
| Protected Cultivation |
Crop Family
| Brassicas | Cabbage |
| Cauliflower and Broccoli | |
| Other Brassicas | |
| Cucurbits | Cucumber and Gherkin |
| Pumpkin and Squash | |
| Other Cucurbits | |
| Roots and Bulbs | Garlic |
| Onion | |
| Potato | |
| Other Roots and Bulbs | |
| Solanaceae | Chilli |
| Eggplant | |
| Tomato | |
| Other Solanaceae | |
| Unclassified Vegetables | Asparagus |
| Lettuce | |
| Okra | |
| Peas | |
| Spinach | |
| Other Unclassified Vegetables |
Geography
| Africa | By Breeding Technology | |
| By Cultivation Mechanism | ||
| By Crop | ||
| By Country | Egypt | |
| Ethiopia | ||
| Ghana | ||
| Kenya | ||
| Nigeria | ||
| South Africa | ||
| Tanzania | ||
| Rest of Africa | ||
| Asia-Pacific | By Breeding Technology | |
| By Cultivation Mechanism | ||
| By Crop | ||
| Australia | ||
| Bangladesh | ||
| China | ||
| India | ||
| Indonesia | ||
| Japan | ||
| Myanmar | ||
| Pakistan | ||
| Philippines | ||
| Thailand | ||
| Vietnam | ||
| Rest of Asia-Pacific | ||
| Europe | By Breeding Technology | |
| By Cultivation Mechanism | ||
| By Crop | ||
| France | ||
| Germany | ||
| Italy | ||
| Netherlands | ||
| Poland | ||
| Romania | ||
| Russia | ||
| Spain | ||
| Ukraine | ||
| United Kingdom | ||
| Rest of Europe | ||
| Middle East | By Breeding Technology | |
| By Cultivation Mechanism | ||
| By Crop | ||
| Iran | ||
| Saudi Arabia | ||
| Rest of Middle East | ||
| North America | By Breeding Technology | |
| By Cultivation Mechanism | ||
| By Crop | ||
| Canada | ||
| Mexico | ||
| United States | ||
| Rest of North America | ||
| South America | By Breeding Technology | |
| By Cultivation Mechanism | ||
| By Crop | ||
| Argentina | ||
| Brazil | ||
| Rest of South America | ||
| Breeding Technology | Hybrids | ||
| Open Pollinated Varieties and Hybrid Derivatives | |||
| Cultivation Mechanism | Open Field | ||
| Protected Cultivation | |||
| Crop Family | Brassicas | Cabbage | |
| Cauliflower and Broccoli | |||
| Other Brassicas | |||
| Cucurbits | Cucumber and Gherkin | ||
| Pumpkin and Squash | |||
| Other Cucurbits | |||
| Roots and Bulbs | Garlic | ||
| Onion | |||
| Potato | |||
| Other Roots and Bulbs | |||
| Solanaceae | Chilli | ||
| Eggplant | |||
| Tomato | |||
| Other Solanaceae | |||
| Unclassified Vegetables | Asparagus | ||
| Lettuce | |||
| Okra | |||
| Peas | |||
| Spinach | |||
| Other Unclassified Vegetables | |||
| Geography | Africa | By Breeding Technology | |
| By Cultivation Mechanism | |||
| By Crop | |||
| By Country | Egypt | ||
| Ethiopia | |||
| Ghana | |||
| Kenya | |||
| Nigeria | |||
| South Africa | |||
| Tanzania | |||
| Rest of Africa | |||
| Asia-Pacific | By Breeding Technology | ||
| By Cultivation Mechanism | |||
| By Crop | |||
| Australia | |||
| Bangladesh | |||
| China | |||
| India | |||
| Indonesia | |||
| Japan | |||
| Myanmar | |||
| Pakistan | |||
| Philippines | |||
| Thailand | |||
| Vietnam | |||
| Rest of Asia-Pacific | |||
| Europe | By Breeding Technology | ||
| By Cultivation Mechanism | |||
| By Crop | |||
| France | |||
| Germany | |||
| Italy | |||
| Netherlands | |||
| Poland | |||
| Romania | |||
| Russia | |||
| Spain | |||
| Ukraine | |||
| United Kingdom | |||
| Rest of Europe | |||
| Middle East | By Breeding Technology | ||
| By Cultivation Mechanism | |||
| By Crop | |||
| Iran | |||
| Saudi Arabia | |||
| Rest of Middle East | |||
| North America | By Breeding Technology | ||
| By Cultivation Mechanism | |||
| By Crop | |||
| Canada | |||
| Mexico | |||
| United States | |||
| Rest of North America | |||
| South America | By Breeding Technology | ||
| By Cultivation Mechanism | |||
| By Crop | |||
| Argentina | |||
| Brazil | |||
| Rest of South America | |||


Market Definition
- Commercial Seed - For the purpose of this study, only commercial seeds have been included as part of the scope. Farm-saved Seeds, which are not commercially labeled are excluded from scope, even though a minor percentage of farm-saved seeds are exchanged commercially among farmers. The scope also excludes vegetatively reproduced crops and plant parts, which may be commercially sold in the market.
- Crop Acreage - While calculating the acreage under different crops, the Gross Cropped Area has been considered. Also known as Area Harvested, according to the Food & Agricultural Organization (FAO), this includes the total area cultivated under a particular crop across seasons.
- Seed Replacement Rate - Seed Replacement Rate is the percentage of area sown out of the total area of crop planted in the season by using certified/quality seeds other than the farm-saved seed.
- Protected Cultivation - The report defines protected cultivation as the process of growing crops in a controlled environment. This includes greenhouses, glasshouses, hydroponics, aeroponics, or any other cultivation system that protects the crop against any abiotic stress. However, cultivation in an open field using plastic mulch is excluded from this definition and is included under open field.
| Keyword | Definition |
|---|---|
| Row Crops | These are usually the field crops which include the different crop categories like grains & cereals, oilseeds, fiber crops like cotton, pulses, and forage crops. |
| Solanaceae | These are the family of flowering plants which includes tomato, chili, eggplants, and other crops. |
| Cucurbits | It represents a gourd family consisting of about 965 species in around 95 genera. The major crops considered for this study include Cucumber & Gherkin, Pumpkin and squash, and other crops. |
| Brassicas | It is a genus of plants in the cabbage and mustard family. It includes crops such as carrots, cabbage, cauliflower & broccoli. |
| Roots & Bulbs | The roots and bulbs segment includes onion, garlic, potato, and other crops. |
| Unclassified Vegetables | This segment in the report includes the crops which don’t belong to any of the above-mentioned categories. These include crops such as okra, asparagus, lettuce, peas, spinach, and others. |
| Hybrid Seed | It is the first generation of the seed produced by controlling cross-pollination and by combining two or more varieties, or species. |
| Transgenic Seed | It is a seed that is genetically modified to contain certain desirable input and/or output traits. |
| Non-Transgenic Seed | The seed produced through cross-pollination without any genetic modification. |
| Open-Pollinated Varieties & Hybrid Derivatives | Open-pollinated varieties produce seeds true to type as they cross-pollinate only with other plants of the same variety. |
| Other Solanaceae | The crops considered under other Solanaceae include bell peppers and other different peppers based on the locality of the respective countries. |
| Other Brassicaceae | The crops considered under other brassicas include radishes, turnips, Brussels sprouts, and kale. |
| Other Roots & Bulbs | The crops considered under other roots & bulbs include Sweet Potatoes and cassava. |
| Other Cucurbits | The crops considered under other cucurbits include gourds (bottle gourd, bitter gourd, ridge gourd, Snake gourd, and others). |
| Other Grains & Cereals | The crops considered under other grains & cereals include Barley, Buck Wheat, Canary Seed, Triticale, Oats, Millets, and Rye. |
| Other Fibre Crops | The crops considered under other fibers include Hemp, Jute, Agave fibers, Flax, Kenaf, Ramie, Abaca, Sisal, and Kapok. |
| Other Oilseeds | The crops considered under other oilseeds include Ground nut, Hempseed, Mustard seed, Castor seeds, safflower seeds, Sesame seeds, and Linseeds. |
| Other Forage Crops | The crops considered under other forages include Napier grass, Oat grass, White clover, Ryegrass, and Timothy. Other forage crops were considered based on the locality of the respective countries. |
| Pulses | Pigeon peas, Lentils, Broad and horse beans, Vetches, Chickpeas, Cowpeas, Lupins, and Bambara beans are the crops considered under pulses. |
| Other Unclassified Vegetables | The crops considered under other unclassified vegetables include Artichokes, Cassava Leaves, Leeks, Chicory, and String beans. |


Research Methodology
Mordor Intelligence follows a four-step methodology in all our reports.
- Step-1: IDENTIFY KEY VARIABLES: In order to build a robust forecasting methodology, the variables and factors identified in Step-1 are tested against available historical market numbers. Through an iterative process, the variables required for market forecast are set and the model is built on the basis of these variables.
- Step-2: Build a Market Model: Market-size estimations for the forecast years are in nominal terms. Inflation is not a part of the pricing, and the average selling price (ASP) is kept constant throughout the forecast period.
- Step-3: Validate and Finalize: In this important step, all market numbers, variables and analyst calls are validated through an extensive network of primary research experts from the market studied. The respondents are selected across levels and functions to generate a holistic picture of the market studied.
- Step-4: Research Outputs: Syndicated Reports, Custom Consulting Assignments, Databases, and Subscription Platforms


