Market Overview
| Study Period | 2018 - 2031 |
|---|---|
| Forecast Data Period | 2026 - 2031 |
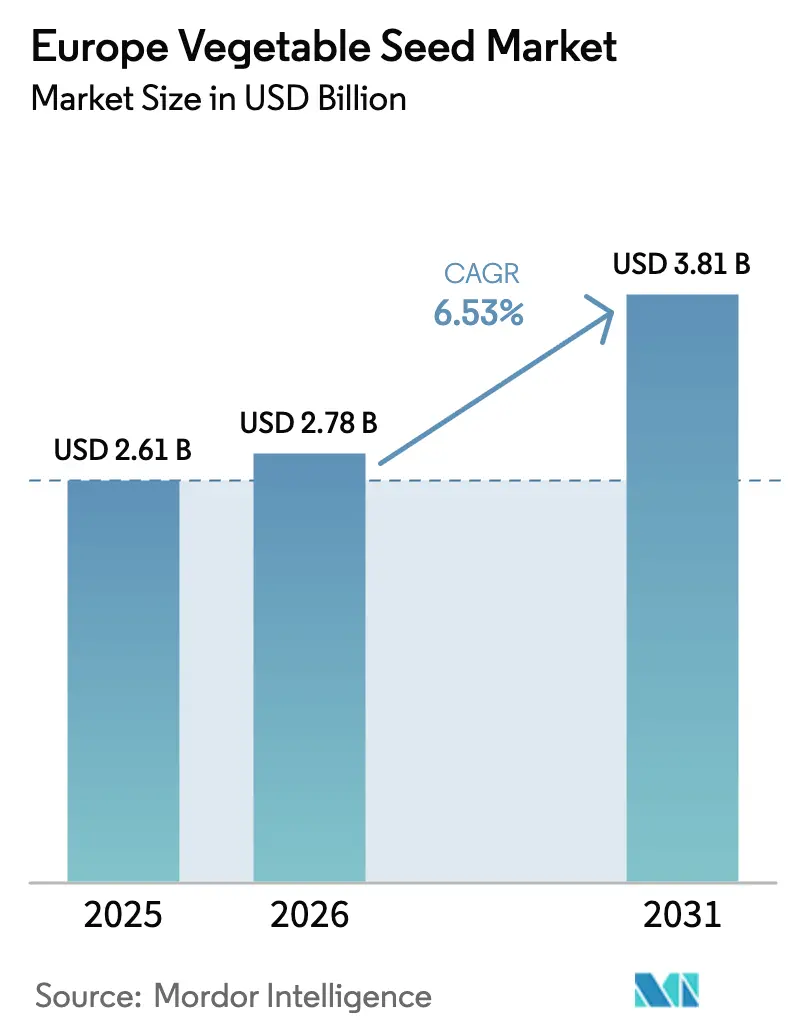
| Base Year Market Size (2025) | USD 2.61 Billion |
| Market Size (2026) | USD 2.78 Billion |
| Market Size (2031) | USD 3.81 Billion |
| Growth Rate (2026 - 2031) | 6.53% CAGR |
| Market Concentration | Medium |
Major Players *Disclaimer: Major Players sorted in no particular order Image © Mordor Intelligence. Reuse requires attribution under CC BY 4.0. | |
Europe Vegetable Seed Market Analysis by Mordor Intelligence
The Europe vegetable seed market size was valued at USD 2.61 billion in 2025 and estimated to grow from USD 2.78 billion in 2026 to reach USD 3.81 billion by 2031, at a CAGR of 6.53% during the forecast period (2026-2031). The European Union's Common Agricultural Policy 2023-2027 drives market growth by allocating 25% of direct payments to eco-schemes and encouraging farmers to adopt certified, climate-adapted varieties[1]Source: European Commission, “CAP 2023-27,” europa.eu. Advancements in doubled-haploid breeding, genomics platforms, and speed breeding reduce variety development time and enhance crop resilience against extreme weather conditions. The expansion of protected-cultivation areas in the Netherlands, Spain, and Italy increases the demand for seeds suitable for controlled environments. Russia's focus on import substitution and financial incentives for domestic breeders drives seed adoption despite trade restrictions. In Denmark and the Netherlands, blockchain implementation demonstrates the potential to reduce counterfeit seed distribution and enhance intellectual property protection.
Key Report Takeaways
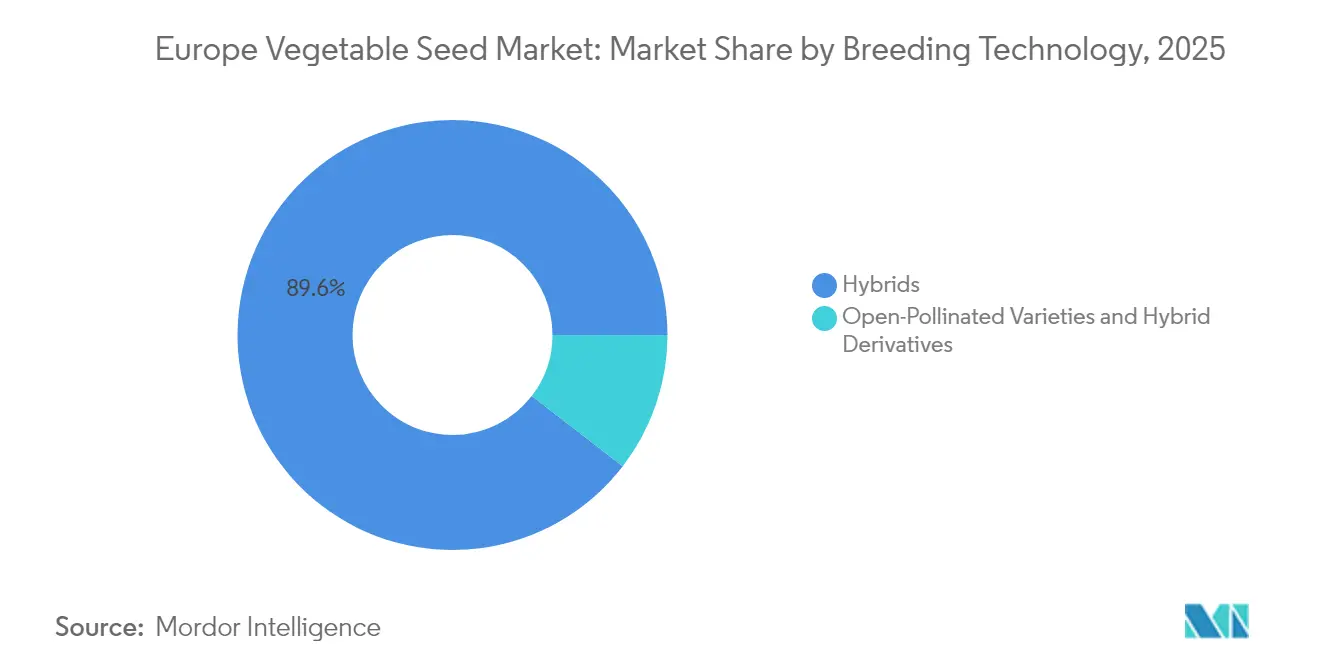
- By breeding technology, hybrids held 89.55% of the Europe vegetable seed market share in 2025 and are projected to register a 6.72% CAGR through 2031, confirming their position as the dominant technology.
- By cultivation mechanism, open-field production accounted for 98.92% of the market in 2025, while protected cultivation is forecast to grow the fastest at 8.19% CAGR to 2031.
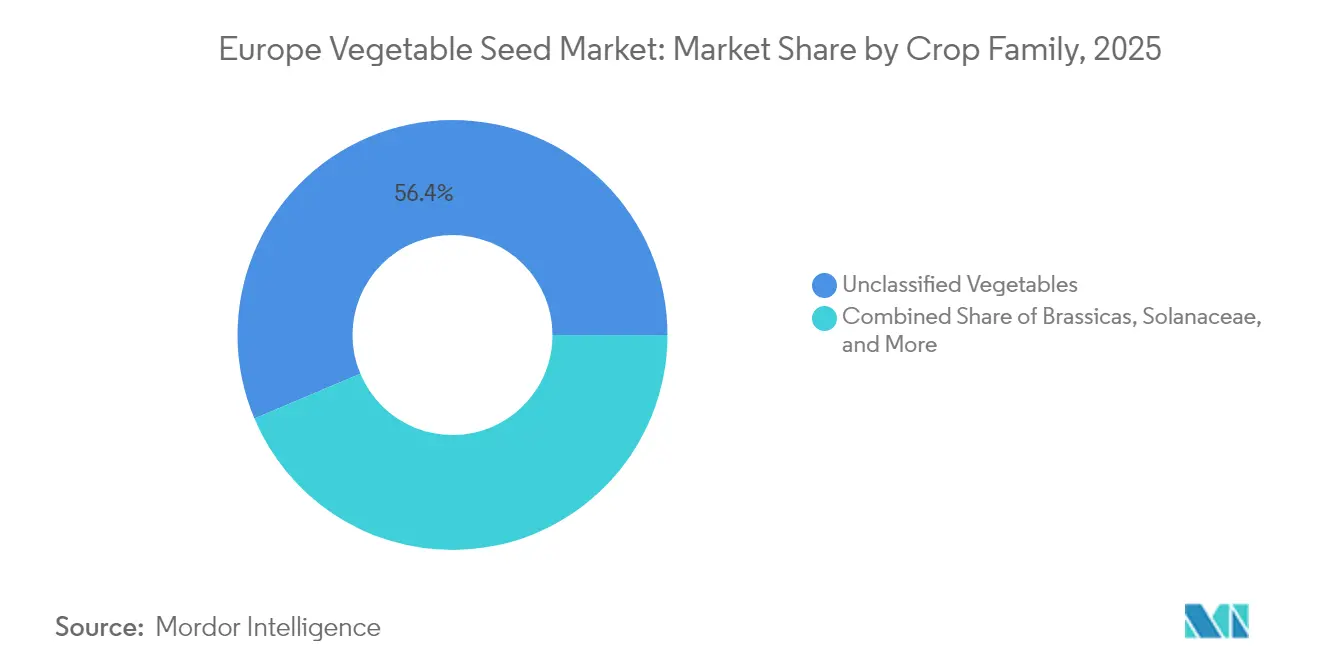
- By crop family, unclassified vegetables captured 56.35% of the 2025 market and are set to expand at an 8.07% CAGR, outpacing all other groups.
- By geography, Russia led with a 20.42% share in 2025 and is projected to log the highest growth rate at 10.74% CAGR through 2031, driven by import-substitution policies and domestic research and development investments.
Note: Market size and forecast figures in this report are generated using Mordor Intelligence’s proprietary estimation framework, updated with the latest available data and insights as of 2026.
Europe Vegetable Seed Market Trends and Insights
Drivers Impact Analysis*
| Driver | (~) % Impact on CAGR Forecast | Geographic Relevance | Impact Timeline |
|---|---|---|---|
| Rapid hybrid-seed adoption for yield gains | +1.5% | Global, strongest in Netherlands, Germany, and France | Medium term (2-4 years) |
| Expansion of protected cultivation structures | +1.3% | Netherlands, Spain, Italy, and Belgium | Long term (≥ 4 years) |
| Blockchain-enabled seed traceability | +0.9% | European Union-wide, early adoption in Netherlands, and Denmark | Long term (≥ 4 years) |
| Consumer preference for nutrient rich crop | +1.2% | Western Europe urban centers | Medium term (2-4 years) |
| Rising private sector investment | +1.0% | Netherlands, France, Germany, and United Kingdom | Short term (≤ 2 years) |
| Government-led initiatives boosting seed adoption | +0.6% | European Union as a whole | Medium term (2-4 years) |
| Source: Mordor Intelligence | |||


Rapid Hybrid-Seed Adoption for Yield Gains
Hybrid seed penetration increased across European vegetable acreage as growers aimed to achieve stable yields amid unpredictable weather conditions. BASF's Nunhem research station utilizes MiMe technology to reduce the traditional development cycle by 50%, enabling faster market entry of climate-resilient hybrid vegetables in Europe. In 2024, Seed Valley companies invested EUR 627 million (USD 678 million) in research and development, focusing on disease resistance and shelf-life trait development. The dominance of hybrid seeds reflects enhanced intellectual property protection under EU Plant Variety Rights, which has attracted venture capital investments in genomics research. The increased adoption of hybrid seeds generates consistent royalty income, allowing breeding companies to invest in advanced molecular breeding tools.
Expansion of Protected Cultivation Structures
The expansion of greenhouse and vertical farming operations has driven demand for seeds optimized for high-density cultivation and LED lighting conditions. While the Netherlands maintains its position in protected agriculture, Romania and Belgium are increasing investments in controlled environments to ensure consistent year-round production. Growers prioritize uniform growth patterns and reliable photoperiod responses in seed selection, prompting breeding companies to evaluate potential varieties in sensor-equipped testing facilities. The emphasis on long-term energy efficiency has generated interest in varieties that demonstrate optimal performance in lower root-zone temperatures and reduced lighting intensity.
Consumer Preference for Nutrient Rich Crop
Western European consumers demonstrate a willingness to pay higher prices for produce with increased levels of carotenoids, glucosinolates, and antioxidants. Snacking tomatoes command premium prices compared to standard slicing tomatoes and represent the highest-selling product in several retailers' convenience segments. The BRESOV breeding lines, developed through Horizon funding in 2020, provide enhanced drought resistance and antioxidant levels, enabling organic producers to meet the growing demand for health-focused products. The increasing focus on biofortification has prompted plant breeders to incorporate metabolomics screening into their selection processes, expanding beyond traditional staple crop programs.
Government-Led Initiatives Boosting Seed Adoption
The Common Agricultural Policy (CAP) allocates EUR 387 billion (USD 426 billion) for the 2023-2027 period, with 35% dedicated to climate and biodiversity measures that mandate certified seed usage. Under this framework, France allocates EUR 2.61 billion to eco-schemes that incentivize the adoption of organic and conservation varieties, significantly expanding the certified seed market. Spain's Royal Decree 1028/2024 mandates subsidized agricultural operations to procure seeds exclusively from the EU Common Catalog or approved conservation lists, driving regulatory compliance and market demand[2]Source: Spanish Ministry of Agriculture, “Royal Decree 1028/2024,” mapa.gob.es. These comprehensive policy measures ensure stable long-term volume commitments for seed breeders while promoting sustainable agricultural practices across the European Union.
Restraints Impact Analysis*
| Restraint | (~) % Impact on CAGR Forecast | Geographic Relevance | Impact Timeline |
|---|---|---|---|
| High hybrid-seed cost for smallholders | -1.4% | Eastern Europe, Southern Italy, and rural Spain | Short term (≤ 2 years) |
| Counterfeit and low-quality seed prevalence | -1.1% | Eastern Europe, Russia, and Turkey | Medium term (2-4 years) |
| Pollinator decline in seed-production hubs | 0.8% | Netherlands, France, and Germany | Long term (≥ 4 years) |
| Intellectual property and patent issues | -0.6% | European Union-wide, concentrated in Netherlands, and Germany | Medium term (2-4 years) |
| Source: Mordor Intelligence | |||
High Hybrid-Seed Cost for Smallholders
The high prices of hybrid seed packets compared to open-pollinated varieties limit their adoption among small farms in Romania and Bulgaria, where holdings average less than 3 hectares. According to Eurostat, Romanian vegetable plots average 0.7 hectares, which restricts farmers' ability to invest in repeated seed purchases[3]Source: Eurostat, “Fruit and Vegetable Statistics,” ec.europa.eu. Certification costs create additional financial pressure, while unclear legal frameworks have resulted in low utilization of group certification schemes. Poland's national list includes only 16 conservation varieties, indicating limited access to affordable landrace seeds. The European vegetable seed market's growth among smallholders depends on the Common Agricultural Policy (CAP) national plans providing complete seed cost reimbursement.
Pollinator Decline in Seed-Production Hubs
Wild pollinator populations are experiencing significant declines as intensive horticultural practices continue to fragment natural habitats. The Netherlands, a prominent global export seed producer, reports substantial decreases in pollinating insect populations across agricultural regions. This decline compels seed breeding companies to implement alternative strategies, including renting commercial bee colonies or transferring parent-line production operations to controlled greenhouse environments. These adaptations result in increased production costs and create complexities in isolation block scheduling. Climate-related alterations in flowering periods significantly disrupt established breeding timelines, necessitating comprehensive modifications to crossing schedules. While the industry's long-term sustainability depends on implementing effective habitat restoration measures, the present environmental uncertainties continue to pose challenges for production planning and operational efficiency.
*Our forecasts treat driver/restraint impacts as directional, not additive. The impact forecasts reflect baseline growth, mix effects, and variable interactions.
Segment Analysis
By Breeding Technology: Hybrids Drive Innovation Leadership
Hybrid varieties commanded 89.55% of the Europe vegetable seed market share in 2025, demonstrating a CAGR of 6.72% during 2026-2031. Commercial growers consistently prioritize essential agricultural characteristics, including crop uniformity, comprehensive disease resistance packages, and predictable yield performance across diverse growing conditions. Advanced breeding technologies, particularly doubled-haploid induction methods and genomic selection platforms, enable major agricultural companies such as BASF, Syngenta, and Bayer to significantly accelerate their breeding cycles, facilitating the development of multiple seed generations annually. The robust Plant Variety Rights protection framework ensures substantial returns on research investments, encouraging seed companies to develop comprehensive trait packages that incorporate enhanced abiotic stress tolerance mechanisms, superior nutrient profiles, and improved shelf-life characteristics.
Open-pollinated varieties and hybrid derivatives represent the remaining market share, maintaining their significance in low-input agricultural systems where seed preservation represents a fundamental component of operational economics. The agricultural industry's intensifying focus on climate-resilient traits, combined with increasing demand for resource-efficient cultivation methods, is anticipated to drive increased adoption of hybrid seed technologies. This trend further consolidates their predominant position in the Europe vegetable seed market landscape, particularly in high-value crops such as tomatoes, peppers, and cucumbers.


By Cultivation Mechanism: Protected Cultivation Transform Production
Open-field farming constituted 98.92% of the Europe vegetable seed market size in 2025. This dominance stems from smallholder farmers' reliance on low-capital production methods. Seed volumes depend on monsoon patterns and rural liquidity cycles. Companies develop products for various soil conditions, including drought-tolerant cucurbits for arid regions and bacterial wilt-resistant tomato varieties for humid eastern plains. The segment remains the primary consumption base despite moderate year-on-year growth.
Protected cultivation is anticipated to grow at a CAGR of 8.19%, supported by capital subsidies and lower infrastructure costs. Greenhouse operators require specific traits, such as compact stature and short internodes, suitable for vertical layers. The use of sensors to monitor transpiration and nutrient uptake generates performance data that breeders analyze for quantitative trait loci. The increasing investment in vertical farms has led seed developers to focus on protected cultivation for high-margin specialty lines. Romania's vertical farming projects and Belgium's automated greenhouse expansions show the spread of protected cultivation beyond traditional horticultural regions. During the forecast period, protected systems will gain market share from open fields, requiring breeders to adapt phenotype targets for data-driven micro-climates.
By Crop Family: Unclassified Vegetables Lead Diversification
Unclassified vegetables held a 56.35% market share in the European vegetable seed market in 2025, primarily comprising leafy greens, carrots, and asparagus. Germany's significant carrot production volumes increased the demand for high-color hybrid varieties suitable for mechanical harvesting. The market growth is supported by consumer demand for convenient salad products, driving the development of lettuce and spinach varieties with improved shelf-life and nutrient retention capabilities.
The unclassified vegetables segment is projected to grow at an 8.07% CAGR through 2031. Urban farming operations prioritize quick-growing leafy greens adapted to vertical farming systems. Research focuses on developing carrots with increased lycopene content and spinach with higher anthocyanin levels. Small-scale breeding companies target specialty crop segments, producing customized seed batches for the European vegetable seed market. Brassica vegetables, including cabbage, cauliflower, and broccoli, experience increased demand due to their nutritional properties and the development of biofortified varieties with higher glucosinolate levels. In the cucurbit segment, which includes cucumbers, melons, and squashes, breeding programs focus on developing varieties with improved disease resistance and climate adaptation characteristics.
Geography Analysis
Russia holds 20.42% of the Europe vegetable seed market share in 2025 and is anticipated to grow at 10.74% CAGR through 2031, supported by government subsidies focused on domestic genetics development. International sanctions have accelerated import substitution, compelling local companies to increase research and development activities despite limited access to global germplasm. The expansion of greenhouse facilities south of Volgograd drives consistent demand for hybrid tomato and cucumber seeds, despite regulatory challenges.
Western European countries, particularly Germany, France, and the Netherlands, form a significant market segment. Germany's research funding programs and France's extensive seed crop area strengthen regional production. The Netherlands serves as the innovation center through its Seed Valley cluster, which houses breeding companies, research facilities, and distribution centers serving over 100 countries. The region maintains its market position through robust intellectual property protection, developed port facilities, and technical expertise, despite elevated operational costs.
Spain's significant European Union vegetable production influences demand for heat-resistant pepper and zucchini varieties. Italy utilizes Common Agricultural Policy funding to support organic conversion and field automation. Poland and Romania's agricultural modernization, funded by European accession programs, encourages farmers to adopt certified hybrid seeds over farm-saved varieties. Turkey's geographic position between Europe and Asia, combined with its diverse ecological zones and year-round nursery operations, establishes it as a key location for germplasm testing in the European vegetable seed market.
Competitive Landscape
The Europe vegetable seed market maintains moderate concentration, with Syngenta Group, Groupe Limagrain Holding S.A., Bayer AG, Rijk Zwaan Zaadteelt en Zaadhandel B.V., and BASF SE holding minority market shares in 2024. Syngenta maintains its position through global distribution networks and a strong tomato seed portfolio. Groupe Limagrain and Bayer strengthen their presence through cross-licensing agreements and integrated crop protection services. Rijk Zwaan and BASF complete the top tier with their specialized greenhouse varieties and proprietary speed breeding technologies.
Research and development capabilities determine competitive advantage in the market. KWS invests EUR 300 million (USD 324 million) annually in molecular laboratories and has established a 10,000 square-meter center in Andijk, equipped with 360 solar panels. BASF's Nunhem facility has implemented MiMe chromosome engineering, reducing breeding cycle time from eight to four years. Patent applications at the Dutch Plant Variety Office increased by 15% in 2024, indicating intensified competition for proprietary traits.
Smaller companies establish market presence by focusing on organic-certified, conservation, and landrace varieties, areas where larger companies have limited involvement. The forthcoming Regulation on Plant Reproductive Material may create uniform registration procedures, potentially reducing entry barriers for medium-sized companies. Strategic partnerships continue to expand, with Bioceres collaborating with Syngenta and Corteva to share drought tolerance genetic information. Additionally, vertical farming operations form exclusive agreements with specialized breeders for compact spinach varieties, further segmenting the Europe vegetable seed market.
Europe Vegetable Seed Industry Leaders
Syngenta Group
Groupe Limagrain Holding S.A.
Bayer AG
Rijk Zwaan Zaadteelt en Zaadhandel B.V.
BASF SE
- *Disclaimer: Major Players sorted in no particular order


Recent Industry Developments
- October 2025: Bayer AG opened new technologically advanced greenhouses at its Research Center in Borgo Sabotino, Latina province, Italy. The facility aims to enhance vegetable seed variety development through modern technologies and sustainable practices.
- February 2025: DENSO Corporation has acquired Axia Vegetable Seeds, a Netherlands-based vegetable seed breeding company that specializes in developing tomato seeds for greenhouse cultivation. DENSO aims to combine its automotive industrial technologies with Axia's cultivation expertise to advance data-driven cultivation methods.
- February 2024: Syngenta Vegetable Seeds opened a modernized research and development facility in El Ejido, Almería, Spain, a region known as the "Orchard of Europe." This global breeding innovation center supports Syngenta's development of vegetable seeds for growers in Spain and international markets. The facility's expansion demonstrates Spain's significance in global agriculture and reinforces Syngenta's focus on developing solutions for growers facing climate challenges and environmental pressures in food production.


Europe Vegetable Seed Market Report Scope
Hybrids, Open Pollinated Varieties & Hybrid Derivatives are covered as segments by Breeding Technology. Open Field, Protected Cultivation are covered as segments by Cultivation Mechanism. Brassicas, Cucurbits, Roots & Bulbs, Solanaceae, Unclassified Vegetables are covered as segments by Crop Family. France, Germany, Italy, Netherlands, Poland, Romania, Russia, Spain, Turkey, Ukraine, United Kingdom are covered as segments by Country.By Breeding Technology
| Hybrids |
| Open-Pollinated Varieties and Hybrid Derivatives |
By Cultivation Mechanism
| Open-Field |
| Protected Cultivation |
By Crop Family
| Brassicas | Cabbage |
| Cauliflower and Broccoli | |
| Other Brassicas | |
| Cucurbits | Cucumber and Gherkin |
| Pumpkin and Squash | |
| Other Cucurbits | |
| Roots and Bulbs | Garlic |
| Onion | |
| Potato | |
| Other Roots and Bulbs | |
| Solanaceae | Chili |
| Eggplant | |
| Tomato | |
| Other Solanaceae | |
| Unclassified Vegetables | Asparagus |
| Carrot | |
| Lettuce | |
| Okra | |
| Peas | |
| Spinach | |
| Other Unclassified Vegetables |
By Geography
| France |
| Germany |
| Italy |
| Netherlands |
| Poland |
| Romania |
| Russia |
| Spain |
| Turkey |
| Ukraine |
| United Kingdom |
| Rest of Europe |
| By Breeding Technology | Hybrids | |
| Open-Pollinated Varieties and Hybrid Derivatives | ||
| By Cultivation Mechanism | Open-Field | |
| Protected Cultivation | ||
| By Crop Family | Brassicas | Cabbage |
| Cauliflower and Broccoli | ||
| Other Brassicas | ||
| Cucurbits | Cucumber and Gherkin | |
| Pumpkin and Squash | ||
| Other Cucurbits | ||
| Roots and Bulbs | Garlic | |
| Onion | ||
| Potato | ||
| Other Roots and Bulbs | ||
| Solanaceae | Chili | |
| Eggplant | ||
| Tomato | ||
| Other Solanaceae | ||
| Unclassified Vegetables | Asparagus | |
| Carrot | ||
| Lettuce | ||
| Okra | ||
| Peas | ||
| Spinach | ||
| Other Unclassified Vegetables | ||
| By Geography | France | |
| Germany | ||
| Italy | ||
| Netherlands | ||
| Poland | ||
| Romania | ||
| Russia | ||
| Spain | ||
| Turkey | ||
| Ukraine | ||
| United Kingdom | ||
| Rest of Europe | ||


Market Definition
- Commercial Seed - For the purpose of this study, only commercial seeds have been included as part of the scope. Farm-saved Seeds, which are not commercially labeled are excluded from scope, even though a minor percentage of farm-saved seeds are exchanged commercially among farmers. The scope also excludes vegetatively reproduced crops and plant parts, which may be commercially sold in the market.
- Crop Acreage - While calculating the acreage under different crops, the Gross Cropped Area has been considered. Also known as Area Harvested, according to the Food & Agricultural Organization (FAO), this includes the total area cultivated under a particular crop across seasons.
- Seed Replacement Rate - Seed Replacement Rate is the percentage of area sown out of the total area of crop planted in the season by using certified/quality seeds other than the farm-saved seed.
- Protected Cultivation - The report defines protected cultivation as the process of growing crops in a controlled environment. This includes greenhouses, glasshouses, hydroponics, aeroponics, or any other cultivation system that protects the crop against any abiotic stress. However, cultivation in an open field using plastic mulch is excluded from this definition and is included under open field.
| Keyword | Definition |
|---|---|
| Row Crops | These are usually the field crops which include the different crop categories like grains & cereals, oilseeds, fiber crops like cotton, pulses, and forage crops. |
| Solanaceae | These are the family of flowering plants which includes tomato, chili, eggplants, and other crops. |
| Cucurbits | It represents a gourd family consisting of about 965 species in around 95 genera. The major crops considered for this study include Cucumber & Gherkin, Pumpkin and squash, and other crops. |
| Brassicas | It is a genus of plants in the cabbage and mustard family. It includes crops such as carrots, cabbage, cauliflower & broccoli. |
| Roots & Bulbs | The roots and bulbs segment includes onion, garlic, potato, and other crops. |
| Unclassified Vegetables | This segment in the report includes the crops which don’t belong to any of the above-mentioned categories. These include crops such as okra, asparagus, lettuce, peas, spinach, and others. |
| Hybrid Seed | It is the first generation of the seed produced by controlling cross-pollination and by combining two or more varieties, or species. |
| Transgenic Seed | It is a seed that is genetically modified to contain certain desirable input and/or output traits. |
| Non-Transgenic Seed | The seed produced through cross-pollination without any genetic modification. |
| Open-Pollinated Varieties & Hybrid Derivatives | Open-pollinated varieties produce seeds true to type as they cross-pollinate only with other plants of the same variety. |
| Other Solanaceae | The crops considered under other Solanaceae include bell peppers and other different peppers based on the locality of the respective countries. |
| Other Brassicaceae | The crops considered under other brassicas include radishes, turnips, Brussels sprouts, and kale. |
| Other Roots & Bulbs | The crops considered under other roots & bulbs include Sweet Potatoes and cassava. |
| Other Cucurbits | The crops considered under other cucurbits include gourds (bottle gourd, bitter gourd, ridge gourd, Snake gourd, and others). |
| Other Grains & Cereals | The crops considered under other grains & cereals include Barley, Buck Wheat, Canary Seed, Triticale, Oats, Millets, and Rye. |
| Other Fibre Crops | The crops considered under other fibers include Hemp, Jute, Agave fibers, Flax, Kenaf, Ramie, Abaca, Sisal, and Kapok. |
| Other Oilseeds | The crops considered under other oilseeds include Ground nut, Hempseed, Mustard seed, Castor seeds, safflower seeds, Sesame seeds, and Linseeds. |
| Other Forage Crops | The crops considered under other forages include Napier grass, Oat grass, White clover, Ryegrass, and Timothy. Other forage crops were considered based on the locality of the respective countries. |
| Pulses | Pigeon peas, Lentils, Broad and horse beans, Vetches, Chickpeas, Cowpeas, Lupins, and Bambara beans are the crops considered under pulses. |
| Other Unclassified Vegetables | The crops considered under other unclassified vegetables include Artichokes, Cassava Leaves, Leeks, Chicory, and String beans. |


Research Methodology
Mordor Intelligence follows a four-step methodology in all our reports.
- Step-1: IDENTIFY KEY VARIABLES: In order to build a robust forecasting methodology, the variables and factors identified in Step-1 are tested against available historical market numbers. Through an iterative process, the variables required for market forecast are set and the model is built on the basis of these variables.
- Step-2: Build a Market Model: Market-size estimations for the forecast years are in nominal terms. Inflation is not a part of the pricing, and the average selling price (ASP) is kept constant throughout the forecast period.
- Step-3: Validate and Finalize: In this important step, all market numbers, variables and analyst calls are validated through an extensive network of primary research experts from the market studied. The respondents are selected across levels and functions to generate a holistic picture of the market studied.
- Step-4: Research Outputs: Syndicated Reports, Custom Consulting Assignments, Databases, and Subscription Platforms


