Synthetic Graphite Market Size and Share
Market Overview
| Study Period | 2021 - 2031 |
|---|---|
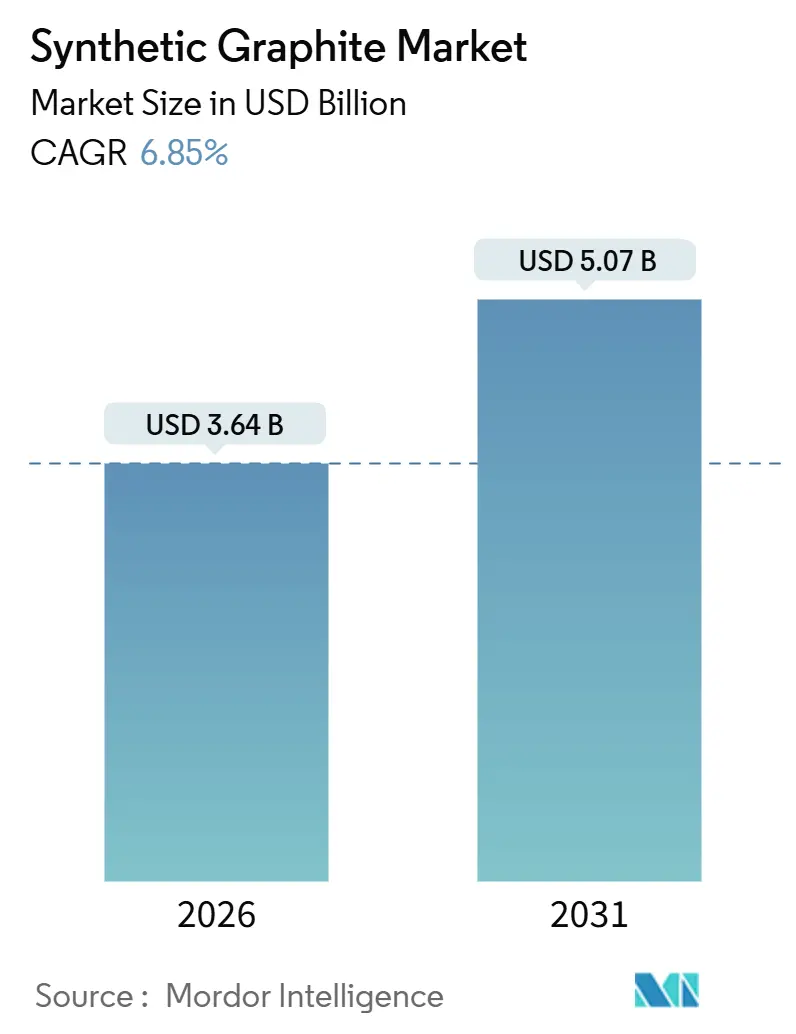
| Market Size (2026) | USD 3.64 Billion |
| Market Size (2031) | USD 5.07 Billion |
| Growth Rate (2026 - 2031) | 6.85% CAGR |
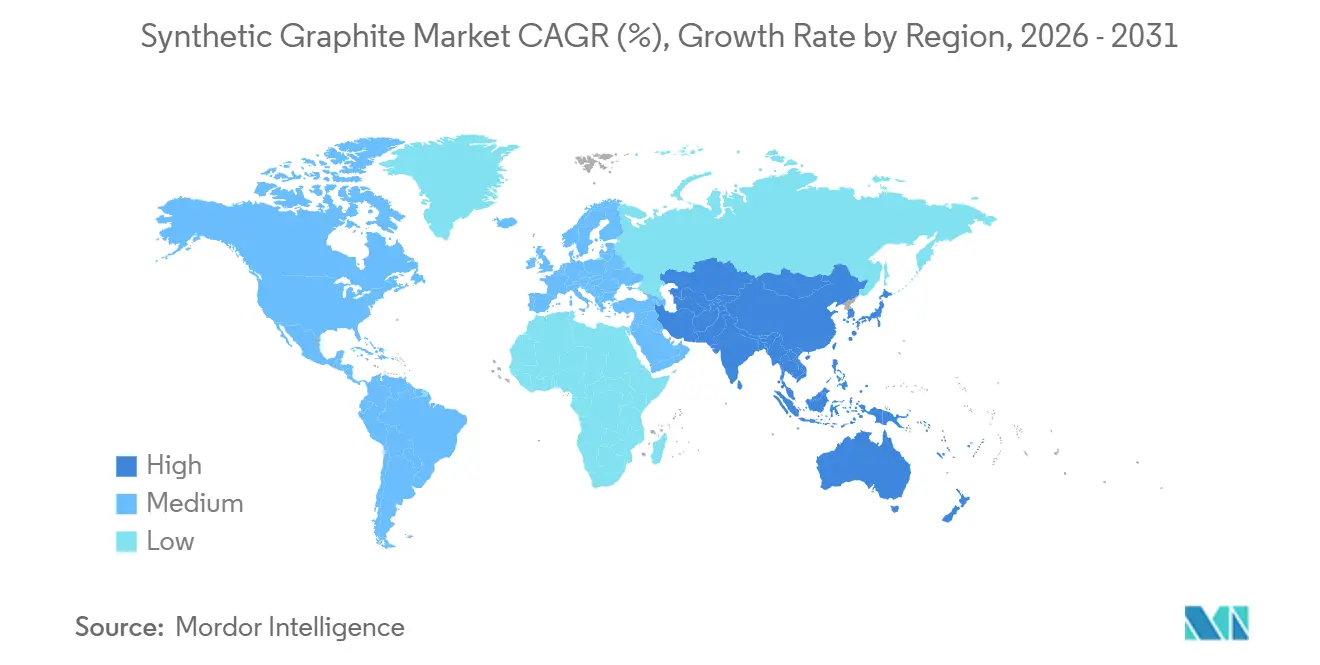
| Fastest Growing Market | Asia-Pacific |
| Largest Market | Asia Pacific |
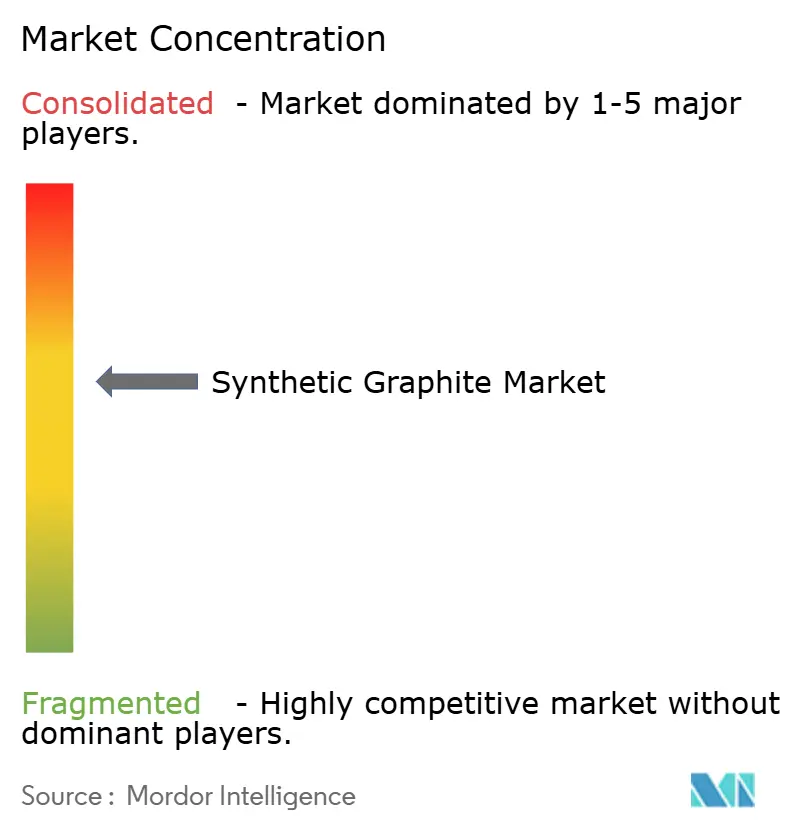
| Market Concentration | Medium |
Major Players *Disclaimer: Major Players sorted in no particular order Image © Mordor Intelligence. Reuse requires attribution under CC BY 4.0. | |
Synthetic Graphite Market Analysis by Mordor Intelligence
The Synthetic Graphite Market size is estimated at USD 3.64 billion in 2026, and is expected to reach USD 5.07 billion by 2031, at a CAGR of 6.85% during the forecast period (2026-2031). Accelerated electric-vehicle production, regional supply-chain localization incentives, and a gradual shift toward ultra-high-power (UHP) electric-arc-furnace steelmaking are the primary growth catalysts. Battery-grade anode demand is growing faster than traditional electrode consumption, even though electrodes still account for higher installed capacity. Margin pressure, however, persists in electrode grades because Chinese overcapacity keeps average selling prices in check. On the demand side, Western gigafactory announcements are pulling new capacity toward North America and Europe far faster than historical cycles. In parallel, technology transitions—most notably silicon-graphite composites and early sodium-ion batteries—are beginning to reshape the competitive landscape.
Key Report Takeaways
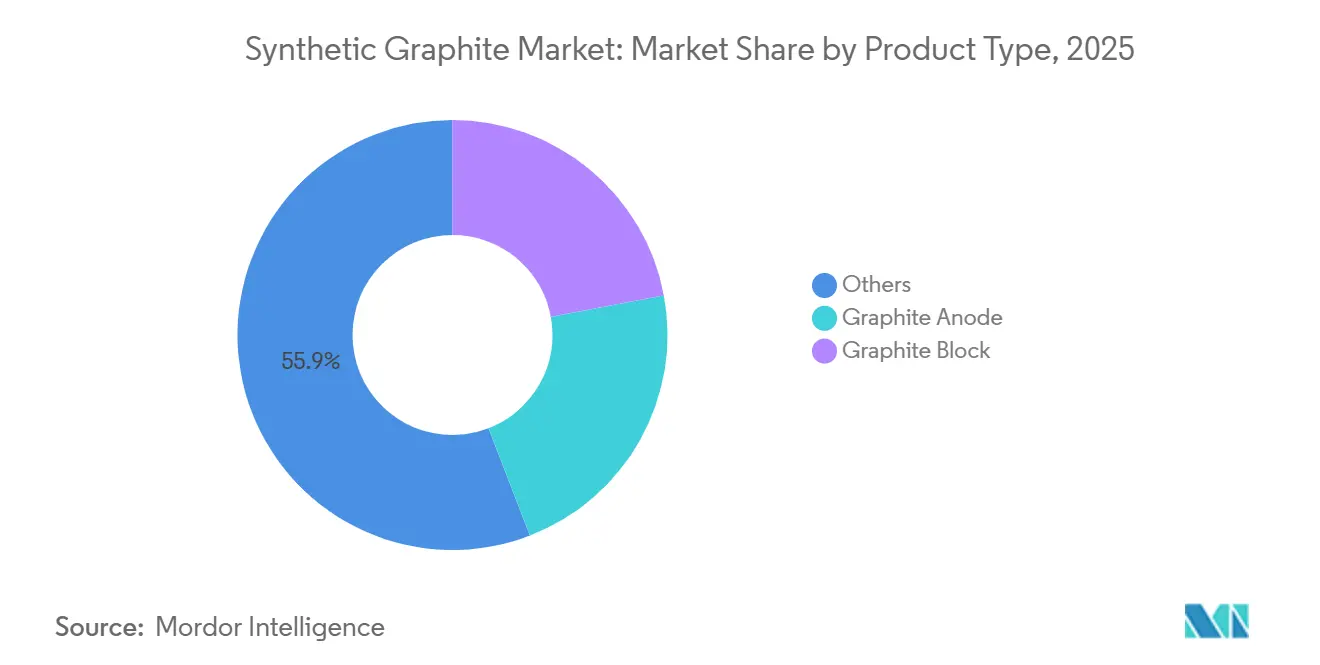
- By product type, Others captured 55.87% of the synthetic graphite market share in 2025. Graphite anode is forecast to register the fastest 8.27% CAGR through 2031.
- By application, metallurgy held 49.64% revenue share in 2025, while batteries are projected to post an 8.44% CAGR to 2031.
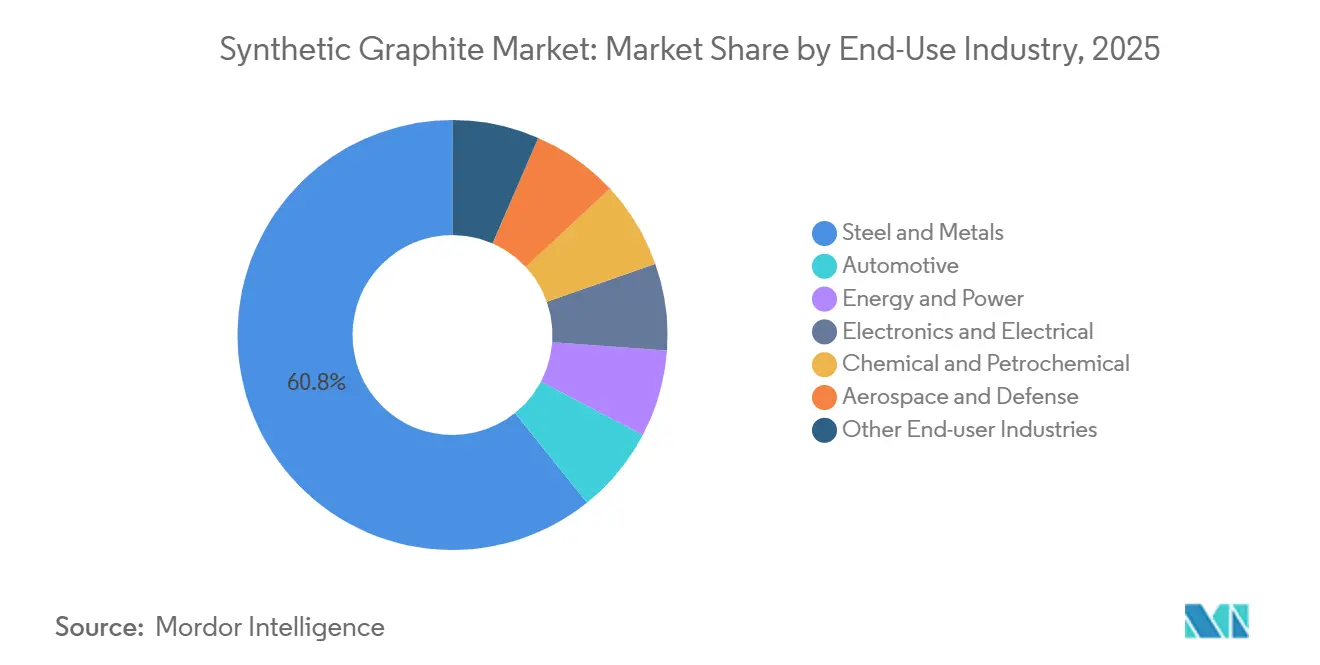
- By end-use industry, steel and metals accounted for 60.77% of the synthetic graphite market size in 2025; automotive is expected to expand at an 8.56% CAGR to 2031.
- By geography, Asia-Pacific retained a 55.58% share in 2025 and is anticipated to grow at a 7.73% CAGR through 2031.
Note: Market size and forecast figures in this report are generated using Mordor Intelligence’s proprietary estimation framework, updated with the latest available data and insights as of January 2026.
Global Synthetic Graphite Market Trends and Insights
Drivers Impact Analysis*
| Drivers | (~) % Impact on CAGR Forecast | Geographic Relevance | Impact Timeline |
|---|---|---|---|
| Increasing demand for electric-vehicle Li-ion batteries | +3.2% | Global, led by China, the US, and EU | Medium term (2-4 years) |
| Growing utilization of ultra-high-power EAFs in steelmaking | +1.8% | Asia-Pacific, Europe, North America | Long term (≥4 years) |
| Faster-charging premium EV models requiring ultra-high-purity anodes | +1.1% | North America, EU, Japan, and South Korea | Short term (≤2 years) |
| Government incentives for local anode material gigafactories | +0.9% | US (IRA), EU (CRMA), Canada, India | Medium term (2-4 years) |
| Silicon-graphite composite anodes scaling in next-gen batteries | +2% | North America, Europe, Asia-Pacific | Long term (≥4 years) |
| Source: Mordor Intelligence | |||


Increasing Demand for Electric-Vehicle Li-ion Batteries
Battery-grade synthetic graphite must meet purity below 50 ppm metallic impurities and particle-size distributions of 10–20 μm, standards that are drawing sizeable investment into coating and purification lines. General Motors’ 2024 offtake agreement with Vianode locks in 150,000 t p.a. of anode material from the Ontario gigafactory, demonstrating OEM willingness to underwrite greenfield capacity for foreign-entity-of-concern (FEOC) compliance[1]“GM Signs Long-Term Deal With Vianode,” wsj.com. Announced North American projects total roughly 200,000 t p.a. for 2024-2026, dwarfing the region’s negligible pre-2023 capacity. Silicon-graphite composites such as NanoGraf’s Onyx deliver 30% higher gravimetric energy density while keeping cycle life above 1,000 full equivalents, raising performance benchmarks that pure graphite must match. Pricing remains bifurcated: coated, high-purity grades used in fast-charging packs command USD 12,000-15,000 per tonne, versus USD 8,000-9,000 per tonne for commodity material. U.S. Inflation Reduction Act content thresholds-60% in 2025, rising to 80% in 2027-further amplify the regional pull for compliant synthetic graphite[2]U.S. Department of Energy, “IRA Guidance on Foreign Entity of Concern,” energy.gov .
Growing Utilization of Ultra-High-Power EAFs in Steelmaking
UHP electrodes allow tap-to-tap times below 40 minutes, so even with lower graphite consumption intensity per heat, total annual electrode demand still climbs as throughput accelerates. POSCO’s plan to localize 20,000 t p.a. of 300 mm UHP electrodes by 2026 illustrates how steelmakers are hedging against Chinese export uncertainties and freight volatility. Qualified suppliers of sub-1.0 × 10⁻⁶ °C⁻¹ CTE needle coke remain fewer than ten globally, a constraint that preserves some pricing power in this segment. India’s twin producers, Graphite India and HEG, together supply about 300,000 t p.a., yet Chinese imports priced 15-20% lower continue to squeeze margins. Compliance remains stringent; ISO 9001 and ASTM C1028 are universally demanded by tier-one steel producers.
Faster-Charging Premium EV Models Requiring Ultra-High-Purity Anodes
Extreme-fast-charging specifications, targeting 10-80% state-of-charge in under 15 minutes, compel automakers to specify anodes with sub-10 nm carbon coatings and particle sphericity exceeding 0.95. NOVONIX’s Chattanooga line is scaling toward 16,000 t p.a. by late 2026 and has already validated coating processes that keep lithium-inventory loss below 5% over 1,500 cycles at 4C rates. Because premium-grade contracts often tie 60-70% of revenue to two or three customers, supplier risk concentration is high. Solid-state and lithium-metal prototypes from QuantumScape and Solid Power could further reshape demand beyond 2028. California’s Advanced Clean Cars II program accelerates public fast-charger build-outs, indirectly pulling forward anode upgrades.
Government Incentives for Local Anode Material Gigafactories
The U.S. Advanced Manufacturing Production Credit (USD 10 per kWh) effectively covers 15-20% of the coated-anode cost structure, compressing project-payback periods to less than a decade. Canada’s Strategic Innovation Fund injected CAD 300 million into Vianode’s Ontario plant, while the EU Critical Raw Materials Act can cut permitting cycles from 8–10 years to under 4 years. India’s ACC PLI scheme earmarks INR 18,100 crore (USD 2.4 billion) across 50 GWh but has signed only three consortia due to delayed disbursement. Subsidies favor vertically integrated cell makers that can stack both cell and materials credits, leaving pure-play anode producers at a 10-15% cost-of-capital disadvantage. Traceability obligations under the EU Battery Passport will apply to synthetic graphite starting in 2026.
Restraints Impact Analysis*
| Restraints | (~) % Impact on CAGR Forecast | Geographic Relevance | Impact Timeline |
|---|---|---|---|
| High manufacturing cost and energy intensity | -1.4% | Global, acute in Europe, North America | Short term (≤2 years) |
| Price gap with natural graphite prompting blended anodes | -0.8% | China, emerging Asia-Pacific markets | Medium term (2-4 years) |
| Early commercialization of sodium-ion batteries reducing graphite demand | -1% | North America and Europe | Medium term (2-4 years) |
| Source: Mordor Intelligence | |||
High Manufacturing Cost and Energy Intensity
Synthetic graphite production consumes 10-15 MWh of electricity per tonne owing to graphitization at 2,800-3,000 °C. European industrial power averaged EUR 150-180 per MWh in 2024, so energy now absorbs 40-45% of cash costs versus 25-30% in China. SGL Carbon reported a 12% margin decline in 2024, citing energy inflation and fixed price contracts. Equipment makers Imerys and Mersen are piloting induction furnaces that cut energy by 15-20%, but the capital costs of EUR 50-60 million per 10,000 t module slow adoption. Feedstock tightness also persists; fewer than ten refineries produce qualifying needle coke, and expansions lag market demand by about two years. EU carbon prices near EUR 80-90 per t CO₂ add another USD 1,200-1,500 per tonne if producers lack capture solutions.
Price Gap with Natural Graphite Prompting Blended Anodes
Natural flake fell to CNY 3,200-3,400 per tonne in September 2024, a 40% slide that narrowed the synthetic premium. Tier-two Chinese cell makers responded by trialing 70:30 natural-synthetic blends, saving roughly 20% on anode cost while retaining around 800 cycles in mid-range EV packs. BTR and Shanshan confirmed blended-anode shipments during 2024 earnings calls, primarily targeting sub-USD 25,000 cars. Performance variability remains a hurdle because natural graphite often contains >200 ppm iron and vanadium, forcing extra purification that erodes the upfront cost gap. Tesla and General Motors have excluded blends from supplier qualification, limiting broad adoption in premium segments.
*Our forecasts treat driver/restraint impacts as directional, not additive. The impact forecasts reflect baseline growth, mix effects, and variable interactions.
Segment Analysis
By Product Type: Anode Momentum Reshapes Portfolio Mix
The Others segment, covering nuclear-grade, semiconductor, and flexible grades, held a 55.87% share, anchored by lengthy qualification cycles. Graphite anode represented roughly 25% of 2025 revenue, is expanding at an 8.27% CAGR, the fastest among product categories. Anode suppliers are capturing 18-22% EBITDA margins on coated grades, whereas electrode makers posted only 8-12% amid Chinese import pressure. Silicon-graphite composites shipped from Group14’s Moses Lake plant displaced 4,000 t of conventional anode during 2025, illustrating how premium EV models erode pure-graphite volumes.
Nuclear-grade graphite stays niche (<5,000 t p.a.) but commands higher revenue as the UK and Canada advance small-modular-reactor programs. ASTM D7219 and EU REACH rules on polycyclic aromatic hydrocarbons pose compliance hurdles, yet most major producers already meet these thresholds.


By Application: Batteries Gain Share as Metallurgy Plateaus
By application, Batteries are tracking an 8.44% CAGR as global cell output heads toward 2,000 GWh by 2030. Metallurgy still led with a 49.64% share in 2025. Parts and components such as seals, bearings, and heat exchangers maintain mid-single-digit growth, buoyed by semiconductor investment.
Application margins diverge sharply: coated battery anodes deliver 18-22% EBITDA, while electrode grades sit closer to 10%. Vianode’s single-application focus on battery anodes highlights a strategic bet that IRA subsidies and OEM contracts can offset diversification benefits. IEC 62133 and ASTM C1028 standards govern safety and dimensional tolerances across end markets, impacting both qualification lead-times and cost.
By End-Use Industry: Automotive Ascends as Steel Consolidates
Steel and metals retained a 60.77% share in 2025. Automotive is advancing at an 8.56% CAGR as EV production scales from 14 million units in 2024 to about 30 million by 2030. Energy and power applications, including grid batteries and fuel cells, are next in line, with significantly rising graphite demand.
Concentration risk is rising because CATL, LG Energy Solution, Samsung SDI, and Panasonic collectively purchase around three-quarters of global battery-anode volume. Graphite India and HEG have started pilot qualification for anode precursors, but most automotive programs have 18-24-month lead times, pushing material revenue to 2026-2027 windows. The EU Battery Regulation’s 2026 carbon-footprint disclosure mandate will likely favor hydropower-based Norwegian and Canadian plants.
Geography Analysis
Asia-Pacific commanded 55.58% revenue in 2025 and is predicted to grow at a 7.73% CAGR through 2031. Chinese export-licensing on graphite tightened global supply, yet utilization still ran only 50-60% in 2024, revealing domestic overcapacity. Japan and South Korea are adding anode capacity, but both remain net importers of needle coke, a chokepoint that maintains China’s upstream leverage. India’s electrode makers filed anti-dumping petitions in 2024 after Chinese imports undercut domestic prices by 15-20%, pushing both firms toward higher-margin specialty grades. Local anode plants do not yet match Southeast Asia’s cell-assembly boom, so most synthetic graphite is still imported.
North America accounts for significant consumption and is witnessing higher demand supported by the Inflation Reduction Act. Superior Graphite’s 24,000 t Arkansas plant, NOVONIX’s Chattanooga expansion, and Syrah’s Vidalia line will add about 50,000 t p.a. by 2026. Canada’s CAD 3.2 billion Vianode investment aims for 150,000 t p.a. by 2028, backed by a long-term General Motors agreement. U.S. FEOC rules beginning in 2025 exclude Chinese-origin graphite from the USD 7,500 consumer tax credit, accelerating domestic sourcing.
Europe is witnessing a continuously growing demand despite energy-cost headwinds. Germany’s SGL Carbon and Graphit Kropfmühl focus on specialty grades, while Imerys and Mersen cover nuclear and chemical uses. Norway’s hydropower advantage gives Vianode’s smaller 20,000 t line a carbon footprint below 5 kg CO₂/kg, compared with 15-20 kg for coal-based Chinese output. Russian needle-coke exports fell 30-40% post-2022 sanctions, tightening European feedstock supply. South America, the Middle East, and Africa are expected to witness considerable growth rates supported by rising industrialization in the regions, mainly the expansion of the steel and automotive industry.

Value Chain Analysis
The synthetic graphite value chain starts with petroleum-derived feedstocks (needle coke/calcined petroleum coke) and coal-tar pitch, followed by milling and shaping steps such as spheroidization and granulation, then high-temperature graphitization (often in Acheson-type furnaces around 3,000 C) and downstream finishing such as purification, carbon coating, sizing, and quality control tailored to electrode, anode, and specialty grades. Energy intensity is a central structural input, with graphitization power consumption and furnace availability influencing operating cost and capacity ramp timing, while qualifying feedstocks for low-CTE and high-purity requirements narrows the supplier base.
Finished products typically move through direct OEM/cell-maker supply agreements for battery anodes and through steel-producer qualification and distributor channels for electrodes and industrial components. Bottlenecks concentrate in high-temperature furnace capacity and in downstream processing such as spheroidization and secondary particle granulation, which lengthen lead times for new capacity additions and elevate the value of integrated processing lines and long-term offtake structures. Policy-driven localization in North America and Europe is reshaping siting and logistics choices, evidenced by project activity such as Graphite One advancing engineering for an Active Anode Materials facility in Ohio (June 2026) and by investment-backed scale-up plans tied to compliant regional supply chains.
Competitive Landscape
The synthetic graphite market is moderately consolidated, with leading players controlling significant market share. Technology is now the main differentiator. Group14 (silicon-carbon), NanoGraf (high-energy Onyx), and Sila Nanotechnologies (silicon-dominant) are gaining OEM endorsements that could displace pure synthetic graphite in premium EV packs. Incumbents are responding by licensing or acquiring these next-gen technologies. Bio-graphite sourced from lignin could cut carbon footprints by up to 70%, but commercial volumes are unlikely before 2028.
Synthetic Graphite Industry Leaders
BTR New Material Group Co., Ltd.
GrafTech International
SGL Carbon
Shanghai Shanshan Technology Co., Ltd.
- *Disclaimer: Major Players sorted in no particular order

Market Opportunities and Future Outlook
White-space is opening where OEMs and cell manufacturers need compliant, traceable, battery-grade synthetic graphite outside the historically concentrated Asian supply chain, particularly for coated, high-purity anodes used in fast-charging packs. Named projects underscore active capacity repositioning: Ontario backed a large Vianode investment for St. Thomas with an ultimate 150,000 t per year target (announced June 2026), while Graphite One moved its Ohio active anode materials project forward via an engineering contract targeting 25,000 t per year by Q4 2028 (June 2026). These initiatives create opportunities for local tolling, coating, purification, and precursor processing that can shorten qualification cycles for North American and European customers.
Decarbonization and alternative feedstocks represent another opportunity track alongside conventional petroleum-based routes, as energy intensity and carbon-footprint reporting push buyers to differentiate suppliers by process and power source. CATL taking a strategic stake in CarbonScape (July 2026) highlights commercialization pull for bio-based graphite derived from forestry byproducts, while corporate roadmaps such as ExxonMobil’s advanced synthetic graphite program (pilot planned for 2026) signal new entrants pursuing domestic manufacturing know-how. For suppliers, product differentiation is shifting toward ultra-fast-charging anode performance, tighter impurity and particle specifications, and scalable coating and finishing capacity located near gigafactory clusters.
Recent Industry Developments
- July 2026: CATL took a 20% stake in CarbonScape and entered a strategic partnership to scale bio-based graphite production using forestry byproducts. The move broadens CATL's anode supply options beyond petroleum-derived feedstocks and strengthens decarbonization positioning for battery material sourcing.
- March 2026: BTR New Material Group launched T-Max and related synthetic graphite anode products positioned for 6C ultra-fast charging. This launch raises performance benchmarks for graphite anodes and supports higher-value qualification pathways with EV battery makers focused on faster charging.
- August 2024: BTR New Material Group commenced mass production at its Indonesian anode facility with an initial capacity of 80,000 tons per year. Bringing new capacity online in Southeast Asia improves proximity to regional battery manufacturing and diversifies production away from single-country concentration.


Research Methodology Framework and Report Scope
Market Definition and Coverage
The market is defined as revenue from newly produced synthetic graphite sold to end users, covering common commercial forms used in industrial and energy applications. We count sales at the first point of commercialization, and values are expressed in USD for the stated year.
Scope exclusions: Recycled graphite recovered from electrode machining scraps and blended natural-synthetic hybrid powders are excluded from this sizing.
Segmentation Overview
- By Product Type
- Graphite Anode
- Graphite Block
- Other Types
- By Application
- Batteries
- Metallurgy
- Parts and Components
- Nuclear
- Other Applications
- By End-Use Industry
- Automotive
- Steel and Metals
- Energy and Power
- Electronics and Electrical
- Chemical and Petrochemical
- Aerospace and Defense
- Other End-user Industries
- By Geography
- Asia-Pacific
- China
- India
- Japan
- South Korea
- Indonesia
- Malaysia
- Thailand
- Vietnam
- Rest of Asia-Pacific
- North America
- United States
- Canada
- Mexico
- Europe
- Germany
- United Kingdom
- France
- Italy
- Spain
- Nordics
- Russia
- Rest of Europe
- South America
- Brazil
- Argentina
- Colombia
- Middle-East and Africa
- Saudi Arabia
- United Arab Emirates
- South Africa
- Nigeria
- Egypt
- Rest of Middle-East and Africa
- Asia-Pacific
Data Sources, Market Sizing, and Validation
Desk Research
Desk research was used to build a clean fact base around supply, demand drivers, and price direction before modeling was finalized. We leaned on public sources such as USGS mineral and materials statistics, UN Comtrade trade flows for graphite related categories, International Energy Agency batteries and EV indicators, World Steel Association crude steel and EAF signals, and peer-reviewed papers on graphite anode performance and production routes.
On top of this, we reviewed producer announcements, technical brochures, investor presentations, annual reports, and reputable press to track capacity additions, plant utilization talk, and qualification timelines. Where a private company did not publish detailed financials, paid subscriptions for company financials and intelligence, patent databases, and import and export shipment level records were used selectively to cross-check scale and route to market assumptions. The sources mentioned above are illustrative only, and other public documents were also referenced for data collection, validation, and clarification.
Primary Interviews and Surveys
Primary discussions were used to pressure test the desk view on what drives volumes, which applications are expanding fastest, and how pricing is being negotiated under changing energy and needle coke conditions. We spoke with stakeholders across producers, distributors, and large consuming industries, and the inputs were balanced across major producing and consuming regions so gaps in public data could be closed before final sign off.
Distribution of primary research fieldwork respondents
| Company type | Respondent position | Region |
|---|---|---|
| Top tier: 25% | CXOs: 15% | APAC: 49% |
| Mid tier: 60% | Functional/Unit leaders: 41% | EMEA: 30% |
| Smaller Players: 15% | Managers: 44% | Americas: 21% |
Market-Sizing & Forecasting
The core model starts from a top-down demand reconstruction, where steelmaking and battery related activity are translated into synthetic graphite consumption using typical intensity factors, then converted into value using application-relevant price bands. Once the demand pool is built, selective bottom-up checks are applied, such as rolling up a sample of producer capacities and utilization, and validating implied shipments through channel feedback, before totals are adjusted.
Key inputs that shaped the market math included electric arc furnace steel output, lithium-ion battery anode production trends, needle coke availability and pricing direction, average selling price movement by major product form (for example electrodes versus anode material), announced capacity additions with ramp up timing, and regional import and export shifts that signal supply rebalancing. When data was missing for smaller suppliers, volumes were inferred using observable capacity, export presence, and product mix statements, then constrained to realistic utilization ranges.
For forecasting, scenario analysis was used to reflect different adoption paths for EVs and steel output, and the final trajectory was anchored by expert consensus on utilization normalization and price progression. The goal was a model that can be repeated with the same inputs as new public indicators appear, alongside interview feedback.
Data Validation & Update Cycle
Validation was done through multiple checkpoints, not a single final review. Outputs were compared with independent signals such as regional capacity announcements, trade patterns, and the implied demand per unit of steel and battery activity, and then large variances were investigated and reconciled.
Before publishing, the model goes through analyst peer review where assumptions, unit conversions, and currency timing are rechecked, and interview notes are revisited if any number appears off trend. The report is refreshed annually, and interim updates are made when a material event occurs, such as a major capacity start-up, a sustained price swing in key feedstocks, or a policy change that shifts battery supply chains. Right before delivery, a fresh pass is completed so clients receive the latest updated view.
Mordor Intelligence's Synthetic Graphite Market Sizing Compared With Other Published Estimates
Published market sizes for synthetic graphite can look far apart even when they appear to describe the same topic, because the counted products, sales points, and the year used for the headline number are not always aligned. We see the biggest differences when studies mix natural and synthetic material, apply different price ladders, or assume faster capacity ramp ups than what buyers confirm.
In this study, the headline number is tied to virgin synthetic graphite only and it uses a 2026 base year, which can make it look smaller than sources that include blended powders, broader advanced carbon categories, or earlier years priced at higher average levels. This scope and timing choice, used in the Mordor Intelligence approach, drives part of the gap versus other publications.
Benchmark comparison
| Source | Market Size | Gaps in Research Methodology |
|---|---|---|
| Mordor Intelligence | USD 3.64 B (2026) | |
| Industry Research Publisher A | USD 8.20 B (2024) | Uses an earlier base year and a broader product framing that can fold in more product forms and applications, and the higher headline value can reflect different average price assumptions versus a 2026 reset. |
| Industry Research Publisher B | USD 8.25 B (2024) | Publishes a 2024 base value and appears to use wider segmentation that may include adjacent categories and different process and purity scopes, which can lift totals when compared on a like for like definition. |
The table shows that most of the spread comes from year selection and what is counted as synthetic graphite in the first place. By keeping the scope focused on virgin synthetic graphite sold to first-use buyers and by anchoring pricing to application-relevant bands, we end up with a number that is easier to audit and update when feedstock costs, utilization, or demand indicators shift.


Key Questions Answered in the Report
What is the projected value of the synthetic graphite market by 2031?
The market is expected to reach USD 5.07 billion by 2031, reflecting a 6.85% CAGR during 2026-2031.
Which application segment is growing the fastest?
Batteries are advancing at an 8.44% CAGR as global lithium-ion cell output scales.
Why are Western automakers investing in local synthetic graphite supply?
Inflation Reduction Act and EU Critical Raw Materials Act incentives make FEOC-compliant supply critical for tax-credit eligibility, prompting agreements like GM-Vianode.
How does sodium-ion technology affect synthetic graphite demand?
Each sodium-ion EV can eliminate 8–10 kg of graphite, potentially displacing up to 100,000 t by 2028 if adoption hits 8% of global EV output.
What is the main cost challenge for European synthetic graphite producers?
High electricity prices raise energy’s share of cash costs to 40-45%, shrinking margins relative to Chinese peers.
Who leads the battery-anode market today?
Chinese producers BTR New Material and Shanghai Shanshan supply over 40% of total anode volume owing to vertical integration and cost leadership.
Page last updated on:


