Vaccine Packaging Market Size and Share
Market Overview
| Study Period | 2020 - 2031 |
|---|---|
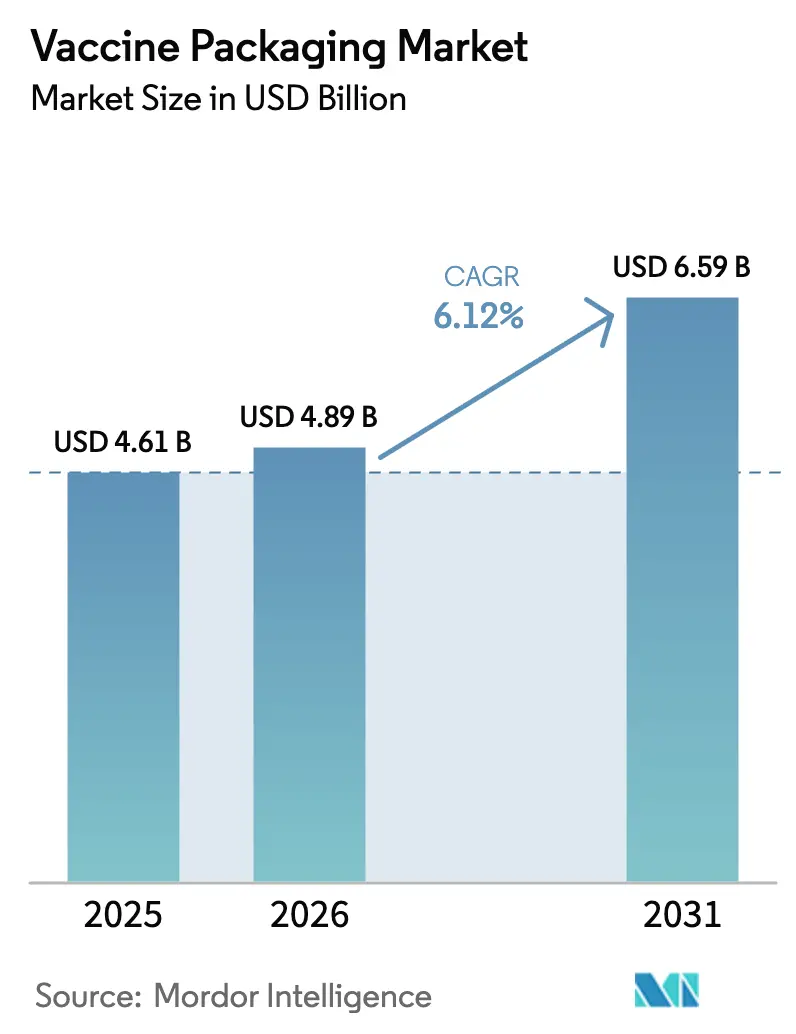
| Market Size (2026) | USD 4.89 Billion |
| Market Size (2031) | USD 6.59 Billion |
| Growth Rate (2026 - 2031) | 6.12% CAGR |
| Fastest Growing Market | Asia-Pacific |
| Largest Market | Europe |
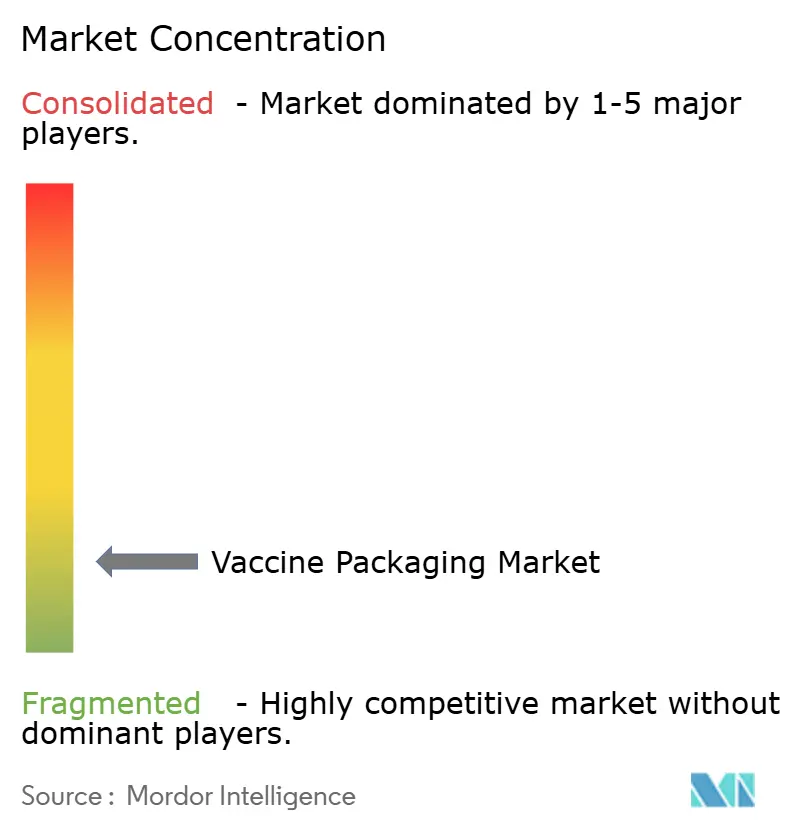
| Market Concentration | Low |
Major Players *Disclaimer: Major Players sorted in no particular order Image © Mordor Intelligence. Reuse requires attribution under CC BY 4.0. | |
Vaccine Packaging Market Analysis by Mordor Intelligence
The vaccine packaging market size was valued at USD 4.61 billion in 2025 and estimated to grow from USD 4.89 billion in 2026 to reach USD 6.59 billion by 2031, at a CAGR of 6.12% during the forecast period (2026-2031). Growth is anchored in aggressive national immunization drives, recurring booster campaigns, and heightened vigilance toward emerging infectious diseases. Demand for packaging able to protect increasingly temperature-sensitive biologics, including mRNA platforms stored at –80 °C, is reshaping material choices and cold-chain logistics. Healthcare providers are gravitating toward ready-to-use (RTU) formats that cut preparation time and reduce contamination risk, while regulators tighten expectations around extractables, leachables, and container-closure integrity. Sustainability pressures are also steering investment into recyclable materials and low-carbon manufacturing. In this environment, the vaccine packaging market is balancing large-scale production economics with the need for nimble response to sudden disease outbreaks and variant-specific reformulations.
Key Report Takeaways
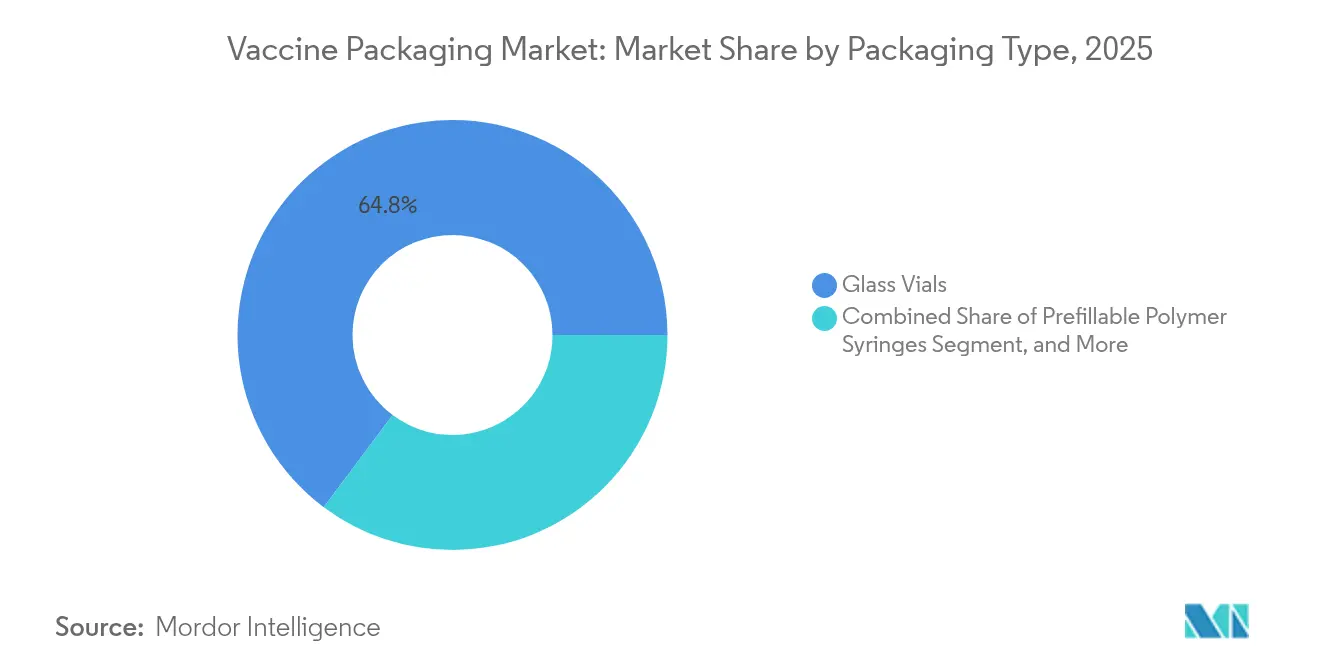
- By primary packaging type, glass vials held 64.78% of the vaccine packaging market share in 2025, whereas prefillable polymer syringes are forecast to expand at a 9.65% CAGR through 2031.
- By material, glass accounted for 67.72% revenue in 2025, while COP/COC polymers are projected to grow fastest at 8.86% CAGR to 2031.
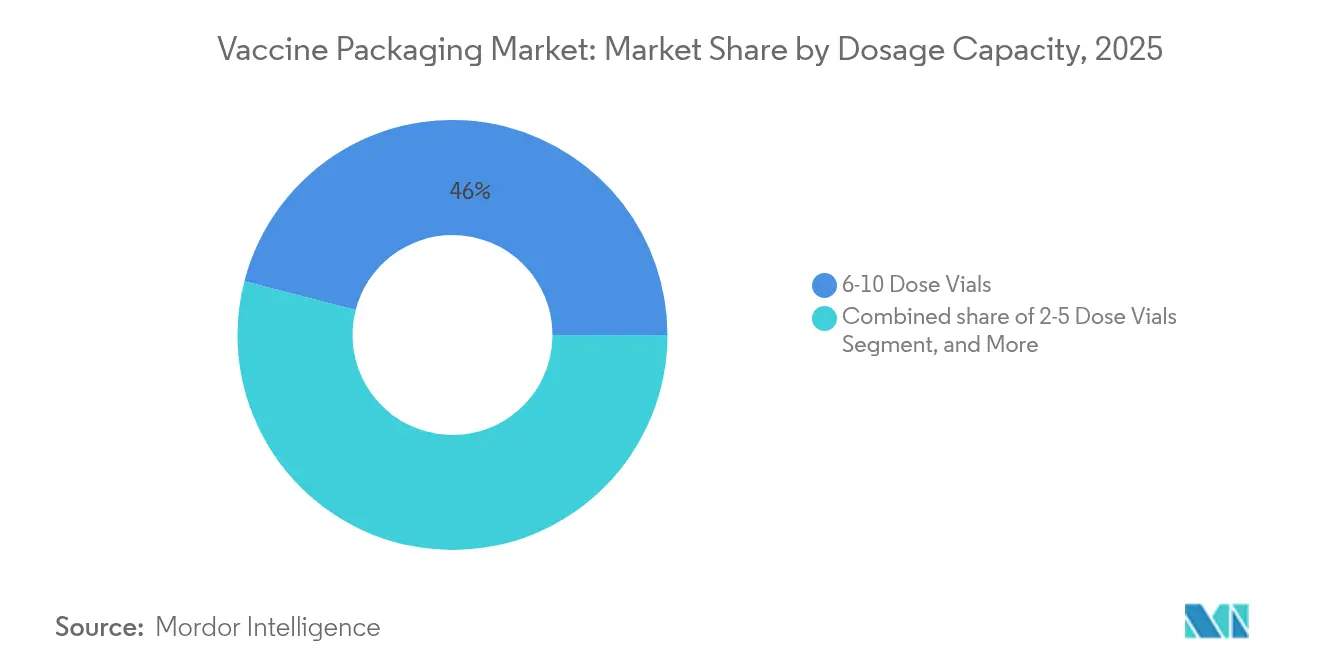
- By dosage capacity, 6-10 dose vials represented 45.98% of the vaccine packaging market size in 2025, yet 2-5 dose vials are on track for a 7.36% CAGR.
- By end user, CDMOs commanded 47.84% share in 2025 and lead growth with an 8.03% CAGR thanks to heightened outsourcing.
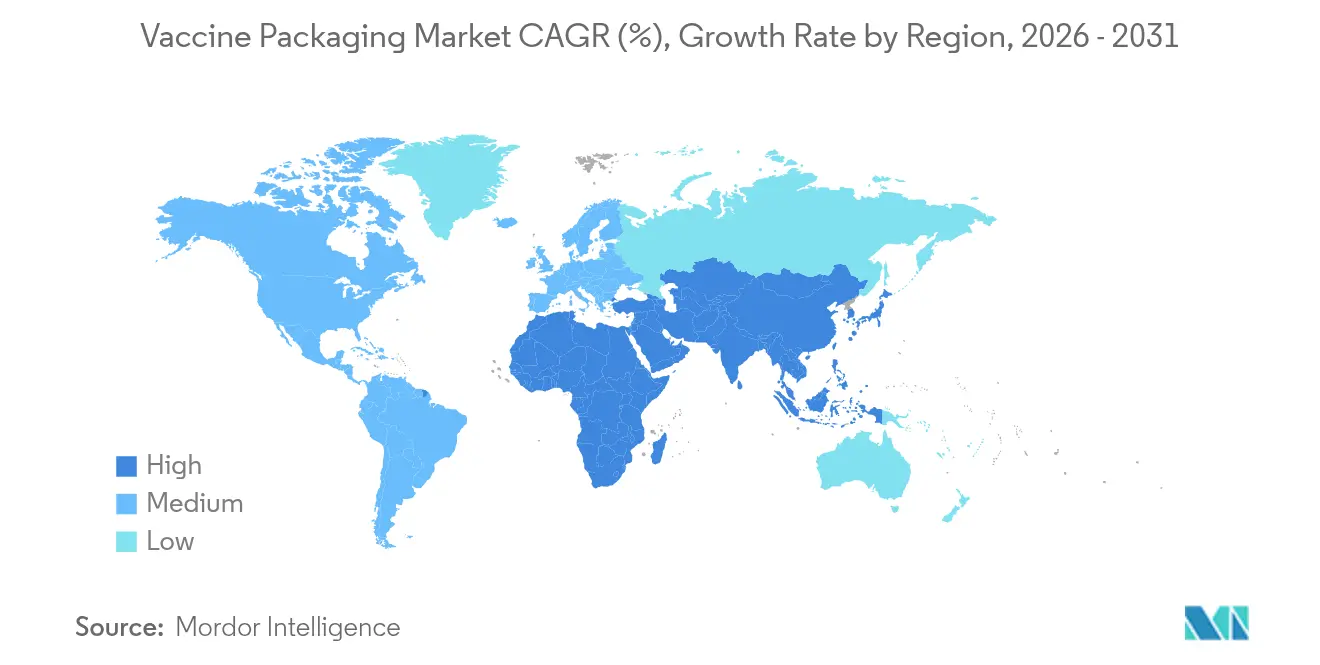
- By region, Europe dominated with 37.42% share in 2025, while Asia-Pacific is the fastest-growing geography at a 9.18% CAGR.
Note: Market size and forecast figures in this report are generated using Mordor Intelligence’s proprietary estimation framework, updated with the latest available data and insights as of 2026.
Global Vaccine Packaging Market Trends and Insights
Drivers Impact Analysis*
| Driver | (~) % Impact on CAGR Forecast | Geographic Relevance | Impact Timeline |
|---|---|---|---|
| Intensified immunization campaigns and booster drives | +1.2% | Global, with emphasis on emerging markets | Medium term (2-4 years) |
| Rising prevalence of emerging infectious diseases | +0.8% | Global, concentrated in high-risk regions | Short term (≤ 2 years) |
| Expansion of cold-chain capacity in emerging markets | +1.0% | Asia-Pacific, Africa, Latin America | Long term (≥ 4 years) |
| Shift toward single-dose RTU formats (prefillable syringes) | +0.9% | North America, Europe, developed APAC | Medium term (2-4 years) |
| Regulatory push for low-siliconization, delamination-resistant containers | +0.7% | Global, led by FDA and EMA jurisdictions | Long term (≥ 4 years) |
| ESG-led demand for low-carbon / recyclable vial solutions | +0.6% | Europe, North America | Long term (≥ 4 years) |
| Source: Mordor Intelligence | |||
Intensified Immunization Campaigns and Booster Drives
National vaccination programs are scaling rapidly to close immunity gaps, illustrated by WHO’s call to reach 14.5 million previously unvaccinated children worldwide.[1]World Health Organization, “New Report Highlights Need for Redoubled Efforts to Reach 2030 Global Immunization Targets,” who.int Advisory bodies such as the CDC recommend thimerosal-free single-dose presentations for children and pregnant women, pushing demand for specialized containers. India’s Mission Indradhanush cut zero-dose prevalence to 0.06% in 2024, requiring enormous packaging throughput for 5.46 crore administered doses. UNICEF’s emergency mpox vaccine tender covering up to 12 million doses underscores the need for flexible vial formats that can ship quickly to crisis regions. Veterinary immunization is joining mainstream schedules as Elanco’s H5N1 cattle vaccine gains routine status, broadening packaging demand beyond human health.
Rising Prevalence of Emerging Infectious Diseases
Frequent pathogen evolution drives continuous package-ready reformulations. EMA’s recommendation to tailor COVID-19 vaccines to the LP.8.1 variant requires containers certified for accelerated stability studies. WHO-prequalified nOPV2 has already crossed 1 billion administered doses, highlighting enormous packaging volumes borne by a single manufacturer pipeline. During New York City’s 2023-2024 RSV season, 45% of nirsevimab doses were given in week 1 of life, affirming the requirement for neonatal-friendly, low-dead-space syringes. Resurgent measles and cholera outbreaks create unpredictable spikes that stretch fill-finish capacity. Merck Animal Health’s USD 895 million production expansion signals how zoonotic threats are also steering capital toward versatile packaging lines.
Expansion of Cold-Chain Capacity in Emerging Markets
Low- and middle-income countries are installing new refrigeration, enabling broader vaccine reach yet imposing stricter container-closure standards. WHO guidance on multi-dose-vial storage times elevates the role of vial coatings and stopper quality. Thermo Fisher’s tamper-evident cartons rated to –80 °C show how secondary packaging must survive extreme conditions for mRNA platforms. Healthcare IoT spending, projected to surpass USD 550 billion by 2031, is pulling smart labels with embedded sensors into routine shipments. Avery Dennison’s Saga Card IoT tag integrates directly with shipper boxes, reducing spoilage and supporting audit readiness. Indonesia’s standardized immunization guidelines evidence how emerging economies are institutionalizing best practices, fortifying long-term vaccine packaging demand.
Shift Toward Single-Dose RTU Formats (Prefillable Syringes)
RTU containers shorten clinic workflows and lower accidental contamination. Moderna advocates pre-filled syringes to streamline mRNA administration and secure exact dosing during high-volume campaigns. Nipro’s expansion in Germany adds forming lines dedicated to D2F™ pre-fillable glass syringes, reflecting capital pouring into RTU scalability. Its D2F™ RTU vial, produced with Stevanato’s EZ-fill® process, merges familiar glass chemistry with aseptic-ready convenience. West’s Daikyo PLASCAP® closures remove aluminum parts and arrive E-beam-sterilized, avoiding in-house sterilization steps and easing compliance with revised EU GMP Annex 1. Zoetis’s intranasal 0.5 mL kennel cough vaccine proves that single-nostril RTU designs can improve animal patient comfort while keeping inventory lean
Restraints Impact Analysis*
| Restraint | (~) % Impact on CAGR Forecast | Geographic Relevance | Impact Timeline |
|---|---|---|---|
| High capex for glass tubing and fill-finish lines | -0.9% | Global, particularly affecting smaller manufacturers | Medium term (2-4 years) |
| Volatile borosilicate glass and aluminosilicate supply chain | -0.7% | Global, with acute impact in Europe and North America | Short term (≤ 2 years) |
| Regulatory delays over extractables/leachables in COP/COC polymers | -0.5% | FDA and EMA jurisdictions | Long term (≥ 4 years) |
| CCIT failures at –80°C hindering novel vial adoption | -0.4% | Global, affecting mRNA vaccine packaging | Medium term (2-4 years) |
| Source: Mordor Intelligence | |||
High Capex for Glass Tubing and Fill-Finish Lines
Modern vial plants produce tens of millions of containers daily, demanding automated inspection and strict quality control. Schott runs over 3,000 inspection stations across sites to achieve this scale . Thermo Fisher earmarked USD 1.5 billion of a larger USD 2 billion program solely for new life-science capital assets in the United States, highlighting the monetary hurdle to stay competitive . Secondary packaging is not exempt: Nosco’s new press boosts carton output by 125 million units yet required sizable upfront spend . Schott’s Perfexion inspection for tubing uses lasers and high-speed cameras, adding both cost and technical complexity. The capital intensity favors scale players and can slow adoption of niche materials or specialized vial designs.
Volatile Borosilicate Glass and Aluminosilicate Supply Chain
Specialty glass relies on a small group of global tubing producers, making the supply chain susceptible to disruption. Packaging buyers therefore explore sustainable alternatives that also promise steadier availability, a trend underpinning the 15.4% CAGR forecast for eco-friendly pharma packaging through 2027. SCHOTT Pharma markets EVERIC® pure and Type I plus® vials with hydrophilic barriers to stretch raw-material yield while enhancing performance. AdaptiQ® sterilized vials further help differentiate glass amid commodity volatility. Dedecke supplies Fiolax®-based vials in small batches, serving specialized needs but depending on the same narrow feedstock funnel. Continued material swings encourage dual-sourcing strategies and accelerate polymer adoption where regulations permit.
*Our forecasts treat driver/restraint impacts as directional, not additive. The impact forecasts reflect baseline growth, mix effects, and variable interactions.
Segment Analysis
By Packaging Type: RTU Formats Drive Innovation
The vaccine packaging market size for primary containers remains anchored in glass vials, which secured 64.78% share in 2025, yet prefillable polymer syringes are outperforming at a 9.65% CAGR. Glass endures because of its chemical inertness and regulatory familiarity, particularly for lyophilized antigens. Meanwhile, demand for RTU convenience fuels syringe line investments that cut on-site washing, depyrogenation, and sterilization. Prefillable glass syringes act as a hybrid bridge, merging established glass chemistry with RTU workflow benefits. Vial closures and stoppers are evolving in parallel; metal-free PLASCAP® RUV seals eliminate secondary sterilization steps while meeting Annex 1 upgrades. On the secondary side, smart cartons and RFID-enabled labels transform boxes from passive protectors into real-time data hubs, aiding clinical trials, recalls, and patient engagement. Aluminium seals persist due to tamper evidence and recyclability, while emerging digital display labels remove manual relabeling and ensure protocol compliance.
Secondary packaging innovation supports broader supply-chain transparency. Schreiner MediPharm’s connected syringe boxes enable investigators to reconcile returned doses automatically, lowering error rates. NFC-embedded labels allow clinicians to tap a smartphone for real-time temperature logs, enhancing pharmacovigilance. Complementary advances in shipper insulation and GPS tracking minimize excursions and reduce spoilage insurance costs. Together, these developments reinforce the competitive edge of RTU formats, even as bulk glass vials remain fundamental during mass-vaccination surges.


By Material: Glass Dominance Challenged by Polymer Innovation
Glass controlled 67.72% of revenue in 2025, yet COP/COC containers are expanding at an 8.86% CAGR as barrier performance improves. Delamination-resistant formulations such as EVERIC® pure address protein adsorption concerns, helping glass retain a dominant role for sensitive biologics. Nonetheless, polymer vials offer break resistance, weight savings, and lower extractables—appealing for field campaigns in remote areas. Polypropylene supplies lower-cost veterinary programs where temperature demands are less severe. Elastomer closure science is advancing in tandem, targeting reduced extractables and compatibility with ultra-low temperatures.
COP/COC can endure -80 °C storage while maintaining container-closure integrity, making them attractive for next-generation mRNA vaccines. Their glass-like transparency reassures clinicians during dose inspection, while reduced siliconization simplifies downstream analytical testing. Aluminum remains indispensable for flip-off caps, with suppliers tweaking alloys and coatings to support recyclability without sacrificing torque performance. Paperboard is winning back share in secondary cartons because EU regulations curb single-use plastics, and biobased films are gaining acceptance as inner liners in cold-chain shippers. Material selection is thus a dynamic trade-off between regulatory familiarity, performance, and sustainability.
By Dosage Capacity: Multi-Dose Efficiency Versus Waste Reduction
Multi-dose 6-10 vial formats captured 45.98% of the vaccine packaging market share in 2025 due to efficient cold-chain utilization during national campaigns. However, 2-5 dose vials are the fastest risers at 7.36% CAGR as programs seek to curb open-vial wastage. WHO’s multi-dose vial policy stipulates strict beyond-use dating once punctured, a driver for smaller fills where usage per session is unpredictable. Single-dose formats serve neonatal and immunocompromised cohorts, where preservative-free formulations and contamination risk avoidance outweigh higher unit costs.
Large >10 dose vials still play a niche role in mass livestock immunization and outbreak stockpiles where field administrators can exhaust full vials quickly. UNICEF market guidance advocates tailoring vial size to logistics realities, balancing storage footprint with wastage economics. Flexible dosage concepts, such as Merck’s mix-on-site SEQUIVITY® platform, may inspire new human vaccine presentations where antigens and adjuvants are combined at the point of care, distributing cold-chain load across smaller, lighter secondary components. Data analytics and electronic stock dashboards help planners match vial capacity to clinic throughput, reducing the environmental and financial cost of discarded doses.
By End User: CDMO Dominance Reflects Outsourcing Trend
CDMOs accounted for 47.84% revenue in 2025 and are poised for an 8.03% CAGR, reflecting biopharma’s preference for asset-light strategies. Outsourcing offers rapid access to high-grade aseptic suites, specialized fill-finish know-how, and regulatory filing support. Public immunization programs remain critical volume anchors, but their price sensitivity pushes packaging suppliers toward standard vial formats and bulk purchase agreements. The CDC’s Vaccines for Children program provides a predictable yet cost-focused pipeline requiring data-rich labels and robust secondary packaging.
Private hospitals prioritize workflow efficiency and are willing to pay premiums for RTU syringes that reduce nursing time. Veterinary producers, governed by USDA biological product licensing, demand packaging that withstands diverse storage and field conditions; clear differentiation in color coding and label durability helps prevent species mis-administration. Convergence between human and veterinary packaging is increasing as both segments adopt similar cold-chain monitoring and contamination controls, widening addressable demand for suppliers that master cross-segment regulatory nuances.
Geography Analysis
Europe led with 37.42% of 2025 revenue, underpinned by mature pharmaceutical manufacturing clusters, strict regulatory oversight, and entrenched cold-chain logistics. Germany illustrates rising downstream demand: pneumococcal vaccinations climbed 23% between 2018 and 2024, while meningococcal B uptake jumped 52% following new STIKO guidelines. EMA’s proactive variant-specific vaccine guidance compels local packaging lines to remain configurable for quick formulation changes. Sanofi’s 2025 European Immunization Week pointed to just 38% flu coverage in adults over 60, signaling room for packaging-driven access initiatives.
Asia-Pacific is the fastest growing at 9.18% CAGR as governments invest heavily in production autonomy and distribution infrastructure. India’s reduction of zero-dose children demonstrates effective program execution, demanding large yet agile packaging volumes suited to varied climates. China’s expanding biologics sector and Japan’s precision engineering elevate regional standards, while ASEAN nations roll out new domestic plants, often through joint ventures with European glass makers. Improved port and road logistics help maintain cold-chain integrity, further lifting market potential.
North America maintains robust demand through innovation leadership and stringent FDA oversight. Thermo Fisher’s multibillion-dollar investment strengthens domestic supply resilience, while CDC recommendations continue shaping container specifications, particularly around preservative-free pediatric doses. The Middle East & Africa and South America collectively form an emerging opportunity as they upgrade immunization schedules and deploy new regional manufacturing hubs, often supported by multilateral funding. Packaging suppliers focusing on cost-efficient glass/polymer hybrids and rugged shippers are well-positioned to capture incremental share.

Competitive Landscape
The vaccine packaging market is Fragmented. Gerresheimer, Schott, and Stevanato Group leverage large-scale glass melting, proprietary vial coatings, and expanding RTU portfolios to defend share. Continuous investment in high-speed inspection, such as Schott’s 3,000+ system array, underpins quality leadership. These incumbents also diversify into polymer offerings to hedge against glass supply swings.
Mid-tier challengers and material innovators are targeting sustainability and digitization. SiO2 Materials Science promotes hybrid glass-polymer containers claimed to reduce breakage and weight, while Avery Dennison’s smart labels provide end-to-end visibility for cold-chain compliance. Patent activity clusters around tamper-evident secondary packs and ultra-cold-resistant closures; Thermo Fisher’s Tamper Evident Carton exemplifies intellectual-property-backed differentiation.[3]Patheon (Thermo Fisher Scientific), “Tamper-Evident Packaging for Clinical Supply Protection,” patheon.com
White-space opportunities align with ESG mandates. Recyclable glass compositions with lower melt temperatures cut scope 1 emissions, while bio-based polymers meet single-use-plastic directives. Smart packaging that integrates RFID, NFC, or temperature sensors opens premium niches for clinical trials and traceability-heavy pediatric vaccines. Agile regional converters capable of small-batch RTU fills for orphan or veterinary vaccines can capture underserved corners as big players focus on high-volume lines.
Vaccine Packaging Industry Leaders
Gerresheimer AG
Nipro Corporation
Piramal Glass Private Limited
Catalent, Inc.
Schott AG
- *Disclaimer: Major Players sorted in no particular order

Recent Industry Developments
- May 2025: Nipro Group expanded syringe capacity at its Münnerstadt facility, adding new forming lines and a 4,000 sqm building for D2F™ pre-fillable syringes.
- May 2025: Merck Animal Health and Kansas announced a USD 895 million investment in De Soto production and R&D sites.
- April 2025: Thermo Fisher Scientific launched a USD 2 billion U.S. manufacturing and R&D expansion program.
- April 2025: Thermo Fisher unveiled the 5 L DynaDrive single-use bioreactor, enabling 27% productivity gains over glass setups.


Global Vaccine Packaging Market Report Scope
Vaccine packaging is the process that includes securely packaging vaccines in order to keep their therapeutic potency for a certain period.
The vaccine packaging market is segmented by type (glass vials, prefillable syringes, vial closures, secondary vaccine packaging) and geography (North America, Europe, Asia-Pacific, Latin America, and Middle East and Africa). The market sizes and forecasts are provided in terms of value (USD million) for all the above segments.
| Primary Packaging | Glass Vials |
| Polymer Vials (COP, COC, PP) | |
| Prefillable Glass Syringes | |
| Prefillable Polymer Syringes | |
| Vial Closures and Stoppers | |
| Aluminum Seals and Caps | |
| Secondary Packaging (cartons, labels, shippers) |
| Glass (Borosilicate, Aluminosilicate) |
| Cyclic Olefin Polymer / Copolymer |
| Polypropylene (PP) |
| Elastomers (bromobutyl, chlorobutyl) |
| Aluminum |
| Paper and Paperboard |
| Single-Dose Containers |
| 2–5 Dose Vials |
| 6–10 Dose Vials |
| More than 10 Dose Vials |
| Public Immunization Programs |
| Private Hospitals and Clinics |
| Contract Manufacturing / CDMOs |
| Veterinary Vaccine Producers |
| North America | United States | |
| Canada | ||
| Mexico | ||
| Europe | Germany | |
| United Kingdom | ||
| France | ||
| Italy | ||
| Spain | ||
| Russia | ||
| Rest of Europe | ||
| Asia-Pacific | China | |
| India | ||
| Japan | ||
| South Korea | ||
| Australia and New Zealand | ||
| ASEAN | ||
| Rest of Asia-Pacific | ||
| Middle East and Africa | Middle East | Saudi Arabia |
| United Arab Emirates | ||
| Turkey | ||
| Africa | South Africa | |
| Nigeria | ||
| Egypt | ||
| Rest of Africa | ||
| South America | Brazil | |
| Argentina | ||
| Rest of South America | ||
| By Packaging Type | Primary Packaging | Glass Vials | |
| Polymer Vials (COP, COC, PP) | |||
| Prefillable Glass Syringes | |||
| Prefillable Polymer Syringes | |||
| Vial Closures and Stoppers | |||
| Aluminum Seals and Caps | |||
| Secondary Packaging (cartons, labels, shippers) | |||
| By Material | Glass (Borosilicate, Aluminosilicate) | ||
| Cyclic Olefin Polymer / Copolymer | |||
| Polypropylene (PP) | |||
| Elastomers (bromobutyl, chlorobutyl) | |||
| Aluminum | |||
| Paper and Paperboard | |||
| By Dosage Capacity | Single-Dose Containers | ||
| 2–5 Dose Vials | |||
| 6–10 Dose Vials | |||
| More than 10 Dose Vials | |||
| By End User | Public Immunization Programs | ||
| Private Hospitals and Clinics | |||
| Contract Manufacturing / CDMOs | |||
| Veterinary Vaccine Producers | |||
| By Geography | North America | United States | |
| Canada | |||
| Mexico | |||
| Europe | Germany | ||
| United Kingdom | |||
| France | |||
| Italy | |||
| Spain | |||
| Russia | |||
| Rest of Europe | |||
| Asia-Pacific | China | ||
| India | |||
| Japan | |||
| South Korea | |||
| Australia and New Zealand | |||
| ASEAN | |||
| Rest of Asia-Pacific | |||
| Middle East and Africa | Middle East | Saudi Arabia | |
| United Arab Emirates | |||
| Turkey | |||
| Africa | South Africa | ||
| Nigeria | |||
| Egypt | |||
| Rest of Africa | |||
| South America | Brazil | ||
| Argentina | |||
| Rest of South America | |||


Key Questions Answered in the Report
What is the current size of the vaccine packaging market?
The market is valued at USD 4.89 billion in 2026 and is projected to reach USD 6.59 billion by 2031.
Which primary packaging format is growing fastest?
Prefillable polymer syringes lead growth at a 9.65% CAGR thanks to ready-to-use convenience and contamination control advantages.
Why are COP/COC polymers gaining ground over glass?
They offer break resistance, low extractables, and reliable container-closure integrity at ultra-low temperatures, driving an 8.86% CAGR through 2031.
Which region presents the strongest growth opportunity?
Asia-Pacific shows the highest CAGR at 9.18%, propelled by large immunization programs and expanding local manufacturing capacity.
How are sustainability goals influencing vaccine packaging?
Regulations and corporate ESG targets are accelerating adoption of recyclable glass, bio-based polymers, and low-carbon manufacturing processes, opening new competitive niches.
Page last updated on:


