
Market Overview
| Study Period | 2020 - 2031 |
|---|---|
| Forecast Data Period | 2026 - 2031 |
| Base Year Market Size (2025) | USD 58.95 Billion |
| Market Size (2026) | USD 62.85 Billion |
| Market Size (2031) | USD 90.69 Billion |
| Growth Rate (2026 - 2031) | 7.61 % |
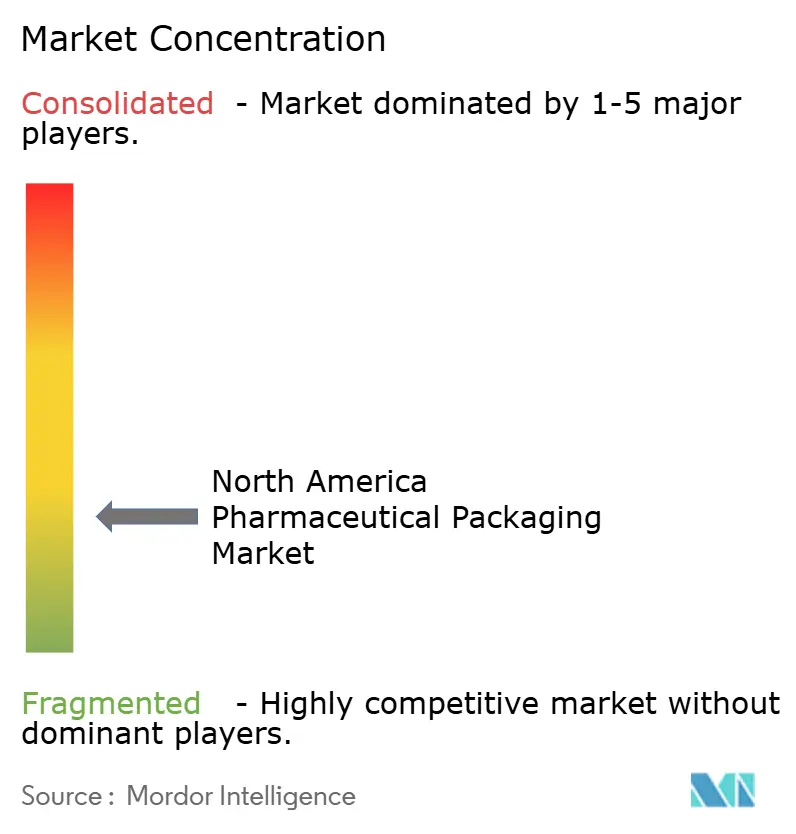
| Market Concentration | Low |
Major Players *Disclaimer: Major Players sorted in no particular order Image © Mordor Intelligence. Reuse requires attribution under CC BY 4.0. | |
North America Pharmaceutical Packaging Market Analysis by Mordor Intelligence
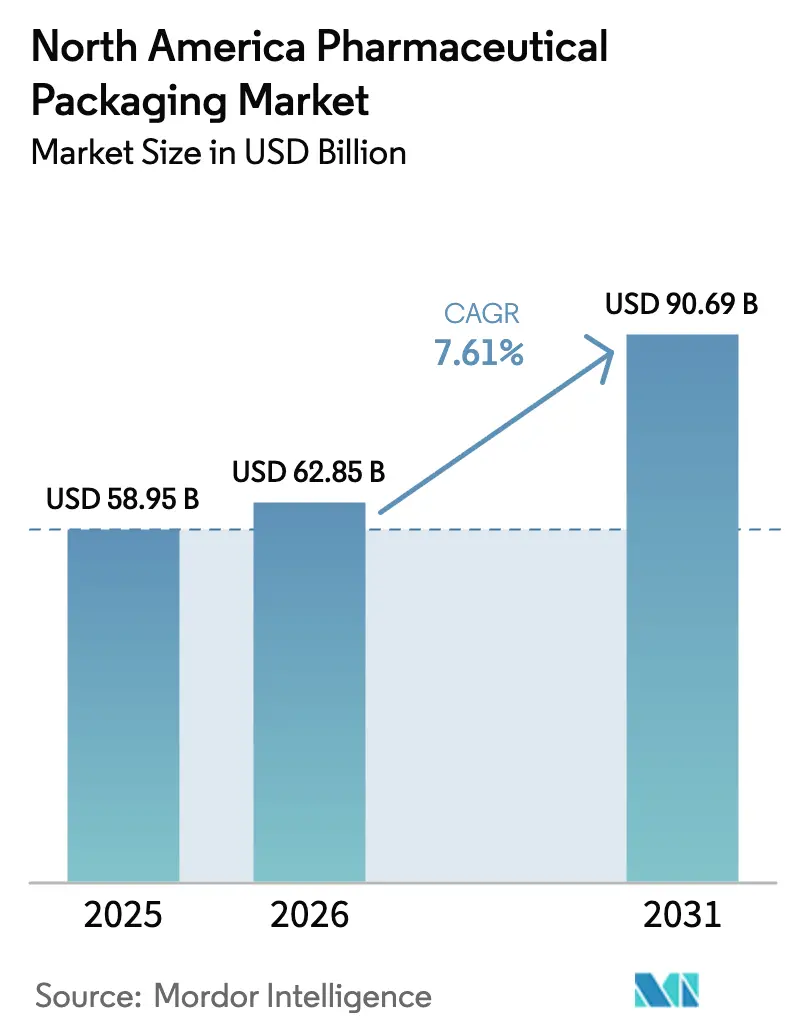
The North America pharmaceutical packaging market size is expected to grow from USD 58.95 billion in 2025 to USD 62.85 billion in 2026 and is forecast to reach USD 90.69 billion by 2031 at 7.61% CAGR over 2026-2031. This growth trajectory is supported by rising biologics approvals, the full enforcement of U.S. serialization rules, and patient-centric delivery innovation. Primary container integrity, digital track-and-trace, and eco-design initiatives are converging, prompting capital spending on high-performance materials and inspection technologies. Biologic drug developers are prioritizing prefilled syringes and cartridges that mitigate protein aggregation, while state-level extended-producer-responsibility mandates are steering converters toward recyclable mono-material formats. Contract packagers are scaling cold-chain assembly lines and clean rooms to capture outsourcing demand, and nearshoring in Mexico is shortening upstream lead times for U.S. distribution hubs.
Key Report Takeaways
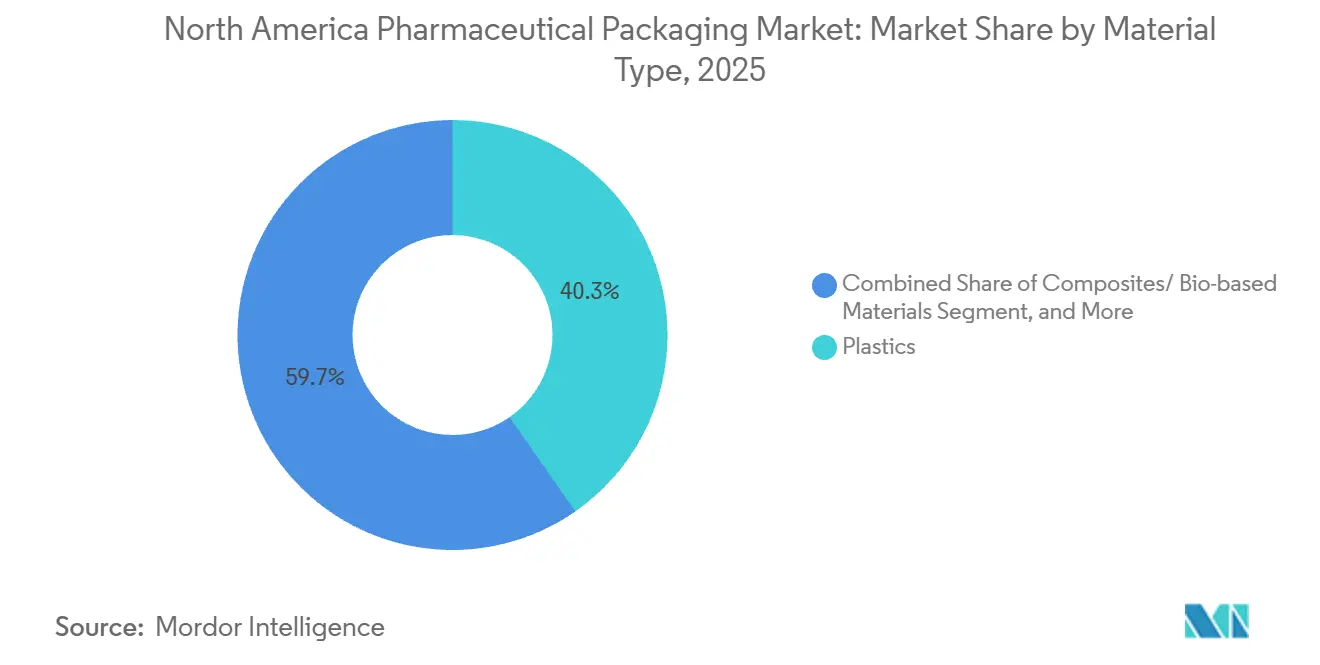
- By material type, plastics held 40.32% of the North America pharmaceutical packaging market share in 2025, while composites and bio-based grades are set to expand at a 9.21% CAGR through 2031.
- By product type, bottles led with 22.43% of the North America pharmaceutical packaging market share in 2025, while pouches and bags are projected to grow at an 8.54% CAGR through 2031.
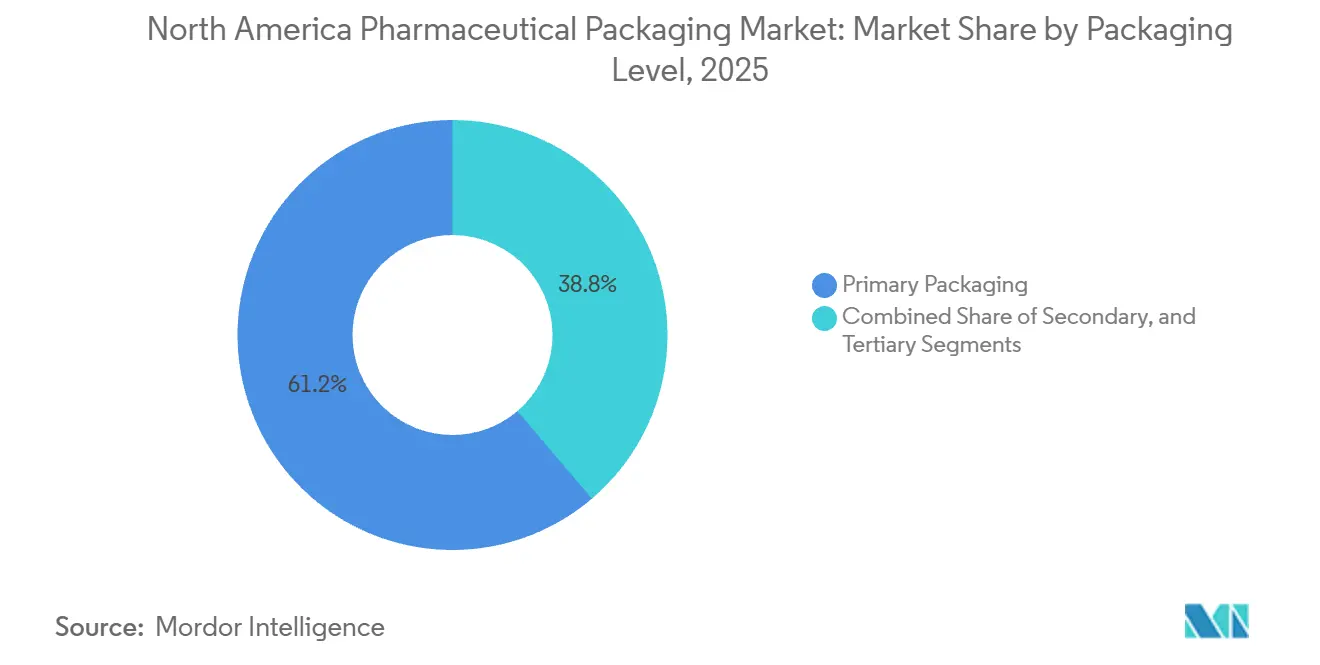
- By packaging level, primary formats commanded 61.23% of the North America pharmaceutical packaging market share in 2025 and are forecast to rise at an 8.21% CAGR to 2031.
- By end-user, contract packaging organizations are advancing at a 9.11% CAGR between 2026 and 2031, outpacing the pharmaceutical manufacturing companies segment, which accounted for a 49.98% share in 2025.
- By geography, the United States accounted for 78.08% market share in 2025. whereas Mexico is expected to record the fastest CAGR of 8.47% through 2031, boosted by nearshoring investments and streamlined regulatory approvals.
Note: Market size and forecast figures in this report are generated using Mordor Intelligence’s proprietary estimation framework, updated with the latest available data and insights as of January 2026.
Market Trends and Insights
Drivers Impact Analysis of North America Pharmaceutical Packaging Market*
| Driver | (~) % Impact on CAGR Forecast | Geographic Relevance | Impact Timeline |
|---|---|---|---|
| Growth of Biologics Requiring Specialized Container-Closure Systems | +1.8% | United States and Canada, emerging in Mexico | Medium term (2-4 years) |
| Stringent Anti-Counterfeiting Regulations Stimulating Advanced Track-and-Trace | +1.5% | United States, Canada | Short term (≤ 2 years) |
| Rise in At-Home Care Driving Demand for Patient-Friendly Delivery Formats | +1.3% | United States and Canada | Medium term (2-4 years) |
| Increasing Adoption of Smart Blister Packaging Solutions | +1.1% | United States, pilot projects in Canada | Medium term (2-4 years) |
| Expansion of Cold Chain Infrastructure for Temperature-Sensitive Drugs | +0.9% | United States, Canada, Mexico | Long term (≥ 4 years) |
| Shift Toward Sustainable and Recyclable Packaging Materials in Pharma | +0.7% | United States, Canada | Long term (≥ 4 years) |
| Source: Mordor Intelligence | |||
Growth of Biologics Requiring Specialized Container-Closure Systems
Biologics represented nearly 30% of FDA approvals in 2025, and each molecule demands rigorously validated elastomer stoppers, barrier coatings, and deterministic integrity testing that prevent oxygen ingress and particulate migration. Prefilled syringes and cartridges dominate self-administered monoclonal antibody and GLP-1 therapies, prompting West Pharmaceutical Services to accelerate NovaPure production lines in North Carolina to meet double-digit order growth.[1]West Pharmaceutical Services, “2025 Annual Report,” westpharma.com Drug owners are willing to pay premium prices for components that lower batch rejection risk, and are requesting helium-leak and laser-based inspections that simulate real-world transport vibration. The migration from vials to ready-to-inject devices shortens fill-finish cycles and reduces nurse preparation steps, making high-value closures critical to therapeutic outcomes. As a result, primary packaging suppliers that co-locate technical laboratories near biologics plants are winning multiyear supply contracts.
Stringent Anti-Counterfeiting Regulations Stimulating Advanced Track-and-Trace
Full DSCSA enforcement in November 2024 required every prescription pack shipped in the United States to carry a unique 2D code, and FDA warning letters issued in 2025 pushed wholesalers to verify serial numbers at unit level. Brand owners installed high-speed vision systems capable of authenticating 400 packs per minute, while contract packagers integrated aggregation software with enterprise resource planning suites to supply compliance data to trading partners. NFC-enabled labels and tamper-evident seals now allow pharmacists and patients to authenticate drugs with a smartphone, curbing diversion and gray-market infiltration. Although serialization raises per-unit costs by up to 12 cents, pharmaceutical sponsors view this as the price of market access. The downstream effect is sustained capital spending on digital presses, variable-data printing, and cloud-hosted traceability dashboards.
Rise in At-Home Care Driving Demand for Patient-Friendly Delivery Formats
U.S. home-health expenditures climbed to USD 135 billion in 2025 as insurers expanded reimbursement for self-injected biologics, shifting packaging priorities toward devices that older adults with limited dexterity can use safely. Pharmacy chains adopted automated blister-packing lines to produce calendar-based adherence cards, and AptarGroup launched a dry-powder inhaler with tactile and audible dose confirmation cues. Updated FDA human-factors guidance requires patient usability studies, elevating packaging to a clinical consideration rather than a secondary procurement item. Suppliers that embed color coding, soft-touch grips, and single-hand actuation are gaining preference from formulators aiming to reduce dose errors. Consequently, the line between drug-delivery device and package is blurring, rewarding companies that blend industrial design with regulatory compliance expertise.
Increasing Adoption of Smart Blister Packaging Solutions
Smart blisters using near-field communication chips and printed sensors deliver real-time adherence data to mobile applications, helping trial sponsors verify protocol compliance and reduce costly dropouts.[2]Schreiner MediPharm, “Pharma-Cycle Smart Blister Platform Launch,” schreiner-group.com Schreiner MediPharm’s 2025 Pharma-Cycle platform integrates temperature and humidity sensors to ensure cold-chain integrity for specialty drugs sensitive to excursions. Commercial adoption remains restrained by a 50-75 cent per-unit premium and fragmented app ecosystems, yet early results show improved adherence for chronic-disease patients. The FDA has not formalized cybersecurity or data-privacy rules for connected packaging, creating a regulatory gray zone, but sponsors view digital packs as a competitive differentiator for high-value therapies requiring precise dosing schedules. As production volumes scale, cost curves are expected to decline, unlocking broader retail-pharmacy deployment.
Restraints Impact Analysis of North America Pharmaceutical Packaging Market*
| Restraint | (~) % Impact on CAGR Forecast | Geographic Relevance | Impact Timeline |
|---|---|---|---|
| Volatility in Raw Material Prices of Medical-Grade Plastics | -0.8% | United States and Canada, pass-through to Mexico | Short term (≤ 2 years) |
| Complex Regulatory Approval Cycles for New Packaging Innovations | -0.6% | United States, Canada, Mexico | Medium term (2-4 years) |
| Environmental Scrutiny on Single-Use Plastics Leading to Costly Compliance | -0.4% | United States, Canada | Long term (≥ 4 years) |
| Supply Chain Disruptions Causing Capacity Constraints | -0.3% | United States, Canada, Mexico | Short term (≤ 2 years) |
| Source: Mordor Intelligence | |||
Volatility in Raw Material Prices of Medical-Grade Plastics
Medical-grade high-density polyethylene and polypropylene resin prices surged 22% in Q1 2025 following unplanned outages at petrochemical plants along the U.S. Gulf Coast, compressing converter margins. Force-majeure declarations by resin suppliers rose 40% year-on-year, underscoring supply vulnerability to weather-related disruptions. Long-term contracts fixing prices for 12-24 months, combined with limited pass-through, are forcing converters to renegotiate mid-term or absorb margin erosion. Sustainability mandates are amplifying volatility because recycled resin trades at a 15-20% premium and suffers from inconsistent quality that requires extra sorting and washing. Suppliers are accelerating diversification of feedstock sources and qualifying alternative suppliers to hedge risk, but price uncertainty remains an immediate profitability threat across the value chain.
Complex Regulatory Approval Cycles for New Packaging Innovations
The FDA’s 21 CFR Part 211 and USP <661> require extractables-and-leachables, stability, and biocompatibility testing that can extend 18-24 months, delaying commercialization of innovative materials. Novel bio-based polyethylenes and multilayer films with barrier coatings lack clear guidance, forcing brand owners to fund redundant tests for each drug application. The draft 2024 container-closure guidance did not address smart-label adhesives or digital-printing inks, creating uncertainty over acceptable migration limits.[3]U.S. Food and Drug Administration, “Guidance for Industry: Container Closure Systems for Packaging Human Drugs and Biologics,” fda.gov As drug sponsors prioritize speed-to-market, they often defer sustainability upgrades that could trigger lengthy validation, slowing adoption of greener solutions. Converters with in-house toxicology labs and historical data libraries can shorten review timelines, making regulatory fluency a strategic differentiator.
*Our forecasts treat driver/restraint impacts as directional, not additive. The impact forecasts reflect baseline growth, mix effects, and variable interactions.
North America Pharmaceutical Packaging Market Segment Analysis
By Material Type:
Composites Gain as Sustainability Mandates IntensifyComposites and bio-based grades are projected to increase at a 9.21% CAGR from 2026 to 2031, outpacing incumbent substrates as converters meet EPR obligations in California, Colorado, and Maine. Plastics dominated 40.32% North America pharmaceutical packaging market share in 2025, driven by high-density polyethylene bottles and low-density polyethylene squeezers, yet resin price swings and recycling hurdles weigh on margins. Glass maintains its position for parenteral formats where inertness is paramount, but weight and breakage risk prompt exploration of cyclic olefin copolymer vials for ultra-high value biologics. Metal tubes for topicals face aluminum cost inflation, and laminate alternatives are gaining share by delivering equivalent barrier at lower gram weight.
Paperboard cartons and corrugated shippers remain essential for secondary and tertiary containment, although moisture sensitivity necessitates barrier coatings for humid routes. Amcor achieved 30% post-consumer recycled content in its North America pharmaceutical portfolio in 2025, showcasing technical progress on contaminant removal. Bio-based polyethylene sourced from sugarcane holds promise, but limited feedstock and a 10-15% premium constrain uptake. Suppliers moving the fastest to certify new composites under USP guidelines are positioned to capture forthcoming tenders as brand owners quantify Scope 3 emissions.



By Product Type:
Flexible Formats Capture Share from Rigid ContainersPouches and bags are forecast to expand at an 8.54% CAGR through 2031 as drug makers favor flexible containment that slashes material weight, supports unit-dose therapy, and integrates tamper-evident seals. Bottles retained 22.43% North America pharmaceutical packaging market share in 2025, yet blister packs and stick packs are encroaching on solid oral and over-the-counter categories. Vials and ampoules remain indispensable for injectables, especially in cold-chain logistics, and prefilled cartridges dominate auto-injector platforms for GLP-1 therapies.
Blister line investments by contract packagers now top 1,200 cavities per minute with in-line serialization, shrinking batch turnaround for trial materials. Tubes service ophthalmic and dermal products, and laminate structures leveraging advanced foil replacements lower carbon footprint without sacrificing barrier. Caps and closures must meet child-resistant and senior-friendly torque windows, prompting design iterations that balance safety with accessibility. Labels have migrated from paper to multilayer films harboring holograms and color-shifting inks, creating downstream complexity in recycling but boosting brand owner security strategies.
By Packaging Level:
Primary Formats Lead on Regulatory and Safety ImperativesPrimary containers held 61.23% of the North America pharmaceutical packaging market share in 2025 and will rise at an 8.21% CAGR, anchored by sterility, extractables-and-leachables compliance, and deterministic container-closure integrity testing. Secondary cartons provide branding real estate and now bear serialized codes, transforming them into compliance assets rather than cost centers. Tertiary shipping systems are evolving toward temperature-tracked insulated boxes deploying phase-change materials to maintain 2-8 °C corridors during multi-day routes.
The FDA’s 2024 integrity guidance encourages probabilistic simulations of vibration and compression, nudging suppliers to invest in helium-leak detectors and dye-ingress rigs. Some device makers eliminate secondary packaging by embedding needle shields directly on prefilled syringes, reducing material waste and facilitating automated assembly. Meanwhile, serialization aggregation codes migrate from secondary to primary surfaces, further blurring traditional level distinctions.
By End-User Industry:
Contract Packagers Outpace Captive OperationsContract packaging organizations are set to grow at a 9.11% CAGR between 2026 and 2031, benefiting from drug sponsors outsourcing serialization, clinical-trial kitting, and low-volume biologic fills. Pharmaceutical manufacturers still controlled 49.98% of North America pharmaceutical packaging market share in the market for high-volume generics in 2025, yet the economic case for in-house upgrades weakens as molecule complexity and cold-chain requirements intensify. Retail and institutional pharmacies deploy robotics to produce unit-dose pouches and calendar cards, streamlining medication adherence.
Hospitals move from bulk vials to ready-to-administer syringe kits to ease nursing workloads and minimize aseptic compounding errors. Long-term care facilities adopt pre-organized therapy trays that reduce pill sorting errors across polypharmacy regimens. Catalent’s 2025 blow-fill-seal expansion highlights the competitive edge that specialized technologies confer on contract players, while regional converters without sterile capabilities risk commoditization.
Geography Analysis
United States Pharmaceutical Packaging Market
The United States generated 78.08% of 2025 revenue, underpinned by the world’s largest prescription market, mature cold-chain infrastructure, and robust DSCSA enforcement. Pharmaceutical sponsors invested roughly USD 1.2 billion in 2025 on serialization vision systems and track-and-trace repositories, a spending wave that lifted demand for digitally printable cartons and labels. State EPR mandates in California, Colorado, and Maine drive redesign toward mono-material packs that survive curbside recycling. West Pharmaceutical Services expanded elastomer capacity in Pennsylvania to supply GLP-1 closure components, underscoring the U.S. focus on obesity and diabetes biologics.
Mexico Pharmaceutical Packaging Market
Mexico is poised for an 8.47% CAGR through 2031 as multinational drug makers nearshore production to mitigate tariffs and shorten delivery times to U.S. hubs. Gerresheimer’s new Monterrey vial plant will supply 500 million units annually, leveraging competitive wages and proximity to Texas distribution centers. 2024 health-law amendments cut COFEPRIS approval cycles from 18 months to 12 months, aligning local standards with FDA requirements and accelerating market entry for novel primary containers. Domestic converters are transitioning from secondary folding cartons to higher-margin prefilled formats, raising technical skill requirements and stimulating joint ventures with global suppliers.
Canada Pharmaceutical Packaging Market
Canada expands in line with population growth and a 2024 federal pledge to broaden public drug coverage for diabetes and contraceptives, boosting dispensing volumes. Health Canada serialization rules effective 2025 require unit identifiers but grant smaller firms grace periods, tempering immediate capital outlays. A proposed federal single-use plastics ban exempts pharmaceutical packs for safety reasons, yet provincial EPR fees in British Columbia and Quebec add 2-4 cents per pack, nudging brand owners to adopt recyclable structures.
Regulatory Landscape
In the United States, pharmaceutical packaging is shaped by FDA requirements covering labeling and packaging system performance. The main anchors include 21 CFR Part 201 for drug labeling and FDA guidance for container-closure systems for human drugs and biologics, which set expectations for compatibility and protection across the product lifecycle. DSCSA requirements, fully enforced from November 2024, move unit-level traceability into day-to-day packaging operations, making serialized identifiers and verification workflows a baseline for prescription packs shipped in the country.
A trade-policy overlay emerged in April 2026, when a Presidential proclamation under Section 232 of the Trade Expansion Act of 1962 imposed tariffs on imported patented pharmaceuticals and APIs. The framework scheduled 100% duties to take effect starting July 31, 2026 for certain companies and expanding on September 29, 2026 for others that do not secure specified agreements. In Canada, Health Canada labeling frameworks, including plain-language labeling reforms introduced via 2015 amendments, and establishment requirements such as Guide-0067 for contract packaging and labeling services for foreign-owned drugs influence how packaging artwork, statements, and service models are structured for market access.
Value Chain Analysis
The value chain starts with feedstock and material suppliers (medical-grade polymers and additives, glass tubing, aluminum, paperboard) and moves into primary-container and component manufacturing, including vials and ampoules, bottles, prefilled syringes and cartridges, stoppers, and caps and closures. It then extends to converters and printers that produce secondary packs and variable-data labels. Contract packaging organizations (CPOs) and specialized service providers anchor operations for clinical-trial packaging, kitting, serialization and aggregation, and cold-chain assembly, before handoff to wholesalers, pharmacies, hospitals, and integrated delivery networks. In those downstream channels, verification and dispensing requirements sustain demand for label durability, scan performance, and tamper evidence.
Regulatory and standards compliance connects each step. FDA cGMP expectations and USP chapters for plastic materials and parenteral packaging drive qualification, extractables and leachables testing, and container-closure integrity programs. A broader shift toward ready-to-use (RTU) primary packaging reduces processing steps at fill-finish sites, shifting more value toward upstream sterilization and quality-release capabilities. This is reinforced by resilience investment, such as SCHOTT Pharma inaugurating expanded vial production lines in Lebanon, Pennsylvania in June 2026, a USD 60 million project supported by BARDA, which supports domestic supply for standard and sterile RTU glass vials.
Competitive Landscape
The North America pharmaceutical packaging market is fragmented, with Amcor, West Pharmaceutical Services, Gerresheimer, AptarGroup, and Schott accounting for roughly 35-40% of 2025 revenue, while regional converters and specialized contract packagers divide the remainder. Scale players integrate digital printing for on-demand serialization, open technical centers near client plants, and file patents covering low-extractable elastomers. Regional converters license third-party track-and-trace software to serve local contract manufacturers that lack the capital for proprietary solutions, competing on agility and customer service.
Sustainability is a white-space battleground; suppliers that qualify post-consumer recycled resins for sterile applications or prove barrier-performance parity with bio-based polymers can command price premiums. Digital-health entrants that embed sensors in blister packs offer data-driven adherence tools, yet high unit costs and uncertain cybersecurity rules temper adoption. Technology convergence is shifting buyer preferences toward suppliers that pair material science with data analytics, forcing traditional converters to invest in software integration and cold-chain monitoring.
Recent strategic moves are reshaping competitive positions. West Pharmaceutical Services invested USD 95 million to expand NovaPure elastomer capacity in North Carolina, doubling output for GLP-1 prefilled-syringe components and cutting lead times by 20%. Gerresheimer opened a USD 180 million glass-vial plant in Monterrey that will supply 500 million units annually to nearshoring biosimilar fill-finish sites. Amcor partnered with Eastman Chemical to co-develop Crystalyx copolyester bottles containing 50% recycled content, signaling an alliance model that blends resin innovation with converter scale. Becton, Dickinson and Company’s USD 120 million stake in Sensile Medical secures on-body injector technology, positioning the firm to compete in high-growth wearable delivery niches. These investments underscore a pattern of capacity expansion, vertical collaboration, and device convergence that raises entry barriers for smaller converters.
North America Pharmaceutical Packaging Industry Leaders
Amcor PLC
Winpak Ltd.
Sealed Air Corporation
Sonoco Products Company
Gerresheimer AG
- *Disclaimer: Major Players sorted in no particular order
North America Pharmaceutical Packaging Market Companies Covered in this Report
- Amcor plc
- West Pharmaceutical Services Inc.
- AptarGroup Inc.
- Gerresheimer AG
- Schott AG
- Becton, Dickinson and Company
- Cardinal Health Inc.
- Sealed Air Corporation
- Sonoco Products Company
- Alpha Packaging
- Catalent Inc.
- Winpak Ltd.
- Graham Packaging Company L.P.
- COMAR LLC
- Origin Pharma Packaging
- Rohrer Corporation
- Owens-Illinois Inc.
- Placon Corporation
- Neopac US Inc.
Read Analysis of North America Pharmaceutical Packaging Companies

Market Opportunities and Future Outlook
A near-term opportunity sits in regulatory-driven labeling and data-standardization work. In March 2026, the FDA finalized a rule requiring FDA-assigned National Drug Codes to adopt a uniform 12-digit format, along with revised barcode labeling requirements under 21 CFR Part 201 to permit non-linear (2D) barcodes to encode the 12-digit NDC. This is translating into demand for packaging redesign, change-control support, and upgrades to print-and-verify systems that can handle 2D symbologies alongside existing DSCSA serialization and aggregation workflows.
Another opportunity is emerging from capacity and capability localization for sterile and specialty primary packaging, supported by active build-outs and public-sector resilience programs. SCHOTT Pharma's June 2026 BARDA-supported expansion in Pennsylvania, alongside Gerresheimer's completed Monterrey vial facility (500 million units annually), shows continued investment aimed at injectable and biologics supply chains, including RTU formats that simplify fill-finish validation. Sustainability-driven redesign is also a defined whitespace, where state-level EPR mandates and brand-owner Scope 3 reporting pressures increase demand for recyclable structures and qualified recycled-content solutions. At the same time, the 18-24 month validation cycles linked to USP and FDA expectations make regulatory-ready material science and documentation a differentiator for suppliers and CPO partners.
Recent Industry Developments in North America Pharmaceutical Packaging Market
- June 2026: SCHOTT Pharma inaugurated expanded vial production in Lebanon, Pennsylvania, adding new converting lines for standard and sterile ready-to-use glass vials as part of a USD 60 million investment supported by BARDA. The expansion strengthens North American supply security for parenteral primary packaging and supports fill-finish sites seeking RTU components to reduce in-house sterilization and validation burden.
- December 2025: Gerresheimer AG completed a USD 180 million glass-vial facility in Monterrey, Mexico, designed for 500 million units of annual capacity targeting biosimilar and injectable supply chains. The site reinforces nearshoring dynamics for US-bound distribution and raises competitive pressure on regional vial and ampoule suppliers on lead time and qualification support.
- November 2024: Full DSCSA enforcement required every prescription pack shipped in the United States to carry a unique product identifier, accelerating investment in unit-level serialization and aggregation across manufacturers and contract packagers. Packaging lines increasingly paired variable-data printing with high-speed vision inspection to reduce compliance risk while sustaining throughput for secondary cartons, labels, and an expanding set of primary formats.


North America Pharmaceutical Packaging Market Report Scope and Research Methodology
Market Definition and Coverage
For this study, the market covers packaging used to contain, protect, label, and distribute pharmaceutical products across North America, counted in value terms for packaging materials and packaging formats supplied into drug manufacturing and packing lines.
Scope exclusions: We exclude drug substance, drug formulation, logistics services, and standalone equipment, and we also exclude packaging used purely for non-pharma healthcare products.
Segments Covered in This Report
- By Material Type
- Plastic
- High-Density Polyethylene (HDPE)
- Low-Density Polyethylene (LDPE)
- Polyethylene Terephthalate (PET)
- Other Plastics
- Glass
- Metal
- Paper and Paperboard
- Composites/ Bio-based Materials
- Plastic
- By Product Type
- Bottles
- Vials and Ampoules
- Blister Packs
- Prefilled Syringes and Cartridges
- Tubes
- Caps and Closures
- Pouches and Bags
- Labels
- Other Product Types
- By Packaging Level
- Primary
- Secondary
- Tertiary
- By End-user Industry
- Pharmaceutical Manufacturing Companies
- Contract Packaging Organizations
- Retail and Institutional Pharmacies
- Hospitals and Clinics
- Other End-user Industries
- By Country
- United States
- Canada
- Mexico
Data Sources, Market Sizing, and Validation
Desk Research
Desk research started with public statistics and regulatory context that shape packaging demand and compliance in North America. We typically reference sources such as the US FDA guidance and databases, US International Trade Commission trade statistics, US Census Bureau manufacturing data, Statistics Canada tables, and UN Comtrade to cross-check materials and packaging-related flows.
Alongside this, we reviewed company filings, investor presentations, product catalogs, association publications (such as packaging and pharma groups), and reputable press coverage to understand mix shifts like biologics growth, unit dose formats, and serialization needs. A paid subscription for company financials and another for news and financials were also used to speed up screening and to check ownership changes and capacity announcements. These desk sources are illustrative, and we used additional public and paid references for data collection, validation, and clarification as we refined assumptions tied to specific packaging segments.
Primary Interviews and Surveys
Primary work was used to confirm which packaging formats are gaining share, how pricing moves with resin, aluminum foil, and glass input costs, and how quickly compliance-led upgrades are being adopted. We spoke with packaging suppliers, converters, contract packagers, and procurement or packaging engineering stakeholders at pharma and CDMO sites across North America, and then used their input to close data gaps and pressure-test the desk-based model before finalization.
Distribution of primary research fieldwork respondents
| Company type | Respondent position |
|---|---|
| Top tier: 33% | CXOs: 17% |
| Mid tier: 47% | Functional/Unit leaders: 33% |
| Smaller Players: 20% | Managers: 50% |
Market-Sizing & Forecasting
Sizing was built using a top-down approach that reconstructs packaging demand from pharma output and pack-level consumption signals, and then translates that into value using format-level pricing. The model was subsequently checked with selective bottom-up approximations, such as supplier revenue sampling, channel checks, and volume-by-format multiplied by typical ASP ranges, and totals were adjusted only when the checks repeatedly pointed to the same direction.
Key inputs included (illustrative) prescription and OTC shipment trends, the share of biologics and injectables versus oral solids, the mix of primary versus secondary packaging, serialization and track-and-trace compliance timing, and material cost movements for plastics, glass, and aluminum-based structures. When detailed splits were not consistently available by country or format, we used a staged gap-handling step where proxy ratios from comparable product groups were applied and then reviewed in primary calls.
For the forecast, scenario analysis was used around a base case, with demand drivers like therapy mix, manufacturing localization, and regulatory compliance cadence being varied within ranges that interviewees considered realistic. This keeps the output explainable and repeatable, and it remains tied to the packaging formats that are actually purchased for pharma packs in the region.
Data Validation & Update Cycle
Outputs were validated through a set of cross-checks, including consistency against pharma production and shipment direction, material price signals, and observed packaging format adoption. Outliers were reviewed, assumptions were revisited, and follow-up outreach was triggered when a country split or format share moved beyond what desk signals could justify.
Before sign-off, results pass through multi-step internal review so unit assumptions, currency treatment, and year alignment are consistent across the model. Reports are refreshed annually, and interim updates are made when material events occur, such as a major regulatory shift or a sharp input cost swing. Right before delivery, a final review pass is completed so clients receive the most current view available at that time.
Mordor Intelligence's North America Pharmaceutical Packaging Market Market Estimate Compared With Other Published Estimates
Published market sizes for North America pharmaceutical packaging can differ even when the topic label looks the same, because each publisher makes its own calls on what counts as packaging value and how regional totals are built. Differences most often come from scope choices, how packaging levels are treated, the pricing basis used for materials and formats, and how frequently assumptions are refreshed.
Some estimates fold in broader healthcare packaging and related services, and some also mix tertiary distribution packaging into the same total. In Mordor Intelligence, the total is kept to pharmaceutical packaging value for the United States, Canada, and Mexico, and adjacent service revenues and non-pharma healthcare packs are not counted, which narrows the number but keeps it traceable to pack demand and format pricing.
Benchmark comparison
| Source | Market Size | Gaps in Research Methodology |
|---|---|---|
| Mordor Intelligence | USD 58.95 B (2025) | |
| Regional Consultancy A | USD 53.91 B (2024) | Uses a different base year and country set (often limited to the United States and Canada), and published totals can shift if Mexico demand and packaging mix are not explicitly modeled and reconciled. |
| Trade Journal B | USD 47.43 B (2024) | Appears to apply a broader product taxonomy and a different split across packaging levels, and the revenue basis and price progression method are not clearly anchored to format-level consumption checks. |
Taken together, the spread is mainly explained by base year choice, the exact country coverage, and whether adjacent packaging or service items get pulled into the same bucket. By keeping the model tied to observable pharma output signals and to packaging-format pricing logic, the resulting estimate stays balanced and easier to reproduce when assumptions are revisited.


Key Questions Answered in the Report
What is the current value of the North America pharmaceutical packaging market?
The North America pharmaceutical packaging market size reached USD 62.85 billion in 2026.
How fast is North America's pharmaceutical packaging demand expected to grow?
The market is projected to register a 7.61% CAGR from 2026 to 2031.
Which material segment is expanding the quickest?
Composites and bio-based materials are forecast to rise at a 9.21% CAGR due to sustainability mandates.
Why are contract packaging organizations gaining share?
Drug sponsors are outsourcing serialization, cold-chain assembly, and low-volume biologic fills, driving a 9.11% CAGR for contract packagers.
What factor makes Mexico the fastest-growing geography?
Nearshoring investments and reduced regulatory timelines are propelling an 8.47% CAGR in Mexican pharmaceutical packaging.
Page last updated on:


 Your data is secure and never sold or shared.


