Poland Data Center Power Market Size and Share
Market Overview
| Study Period | 2020 - 2031 |
|---|---|
| Forecast Data Period | 2026 - 2031 |
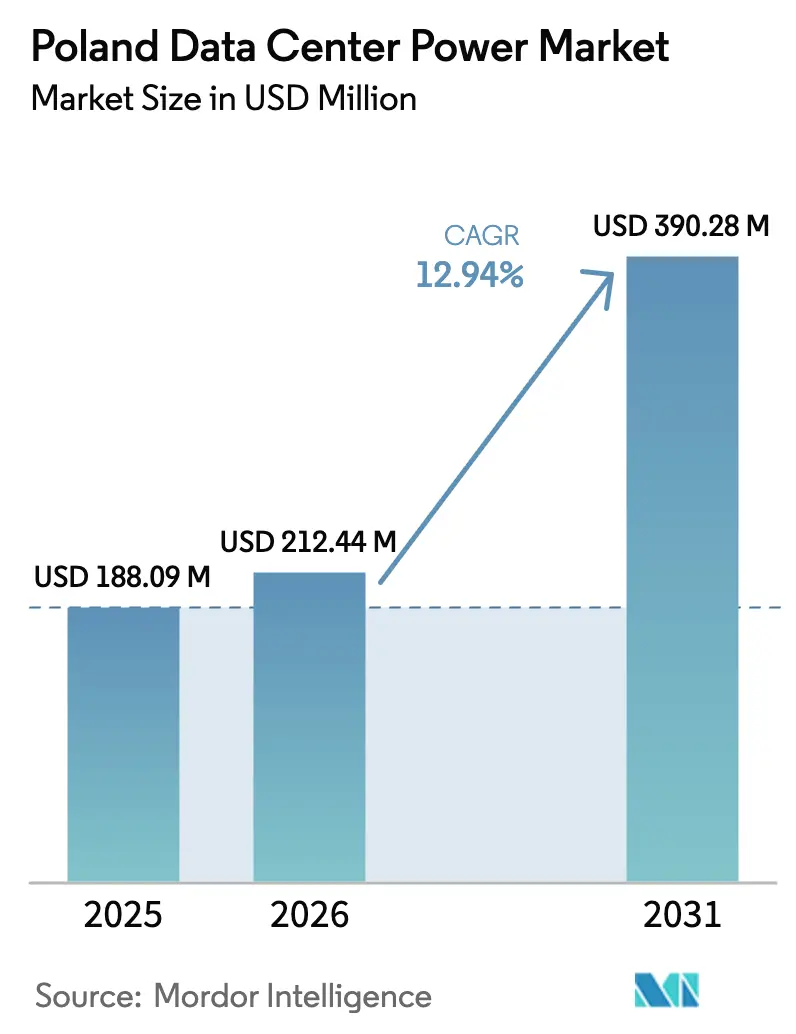
| Base Year Market Size (2025) | USD 188.09 Million |
| Market Size (2026) | USD 212.44 Million |
| Market Size (2031) | USD 390.28 Million |
| Growth Rate (2026 - 2031) | 12.94% CAGR |
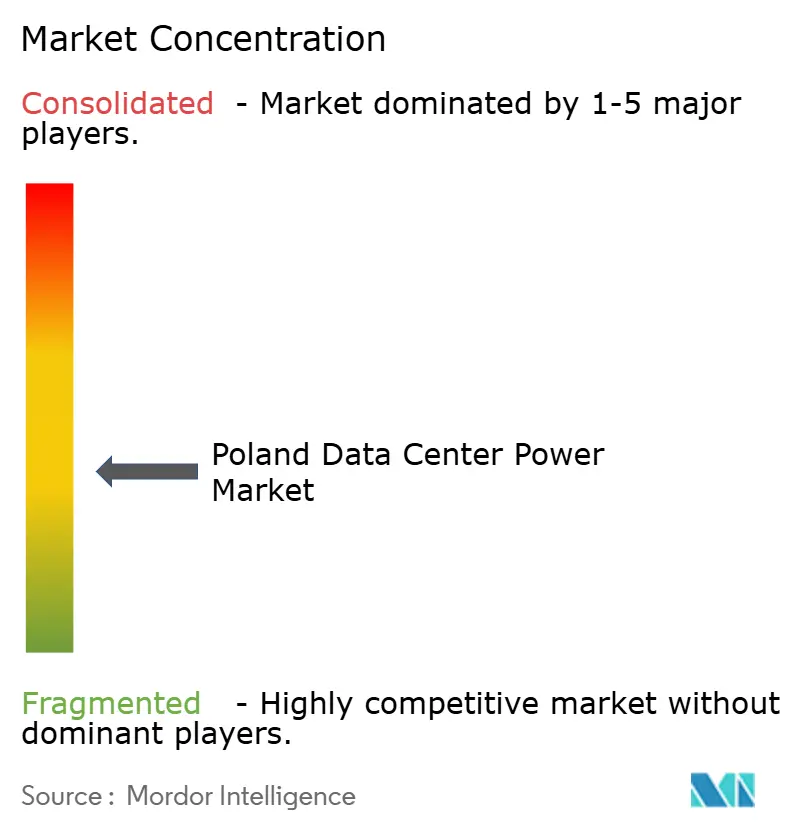
| Market Concentration | Medium |
Major Players *Disclaimer: Major Players sorted in no particular order Image © Mordor Intelligence. Reuse requires attribution under CC BY 4.0. | |
Poland Data Center Power Market Analysis by Mordor Intelligence
The Poland data center power market size is expected to grow from USD 188.09 million in 2025 to USD 212.44 million in 2026 and is forecast to reach USD 390.28 million by 2031 at 12.94% CAGR over 2026-2031. The growth momentum mirrors Poland’s strategy to become Central Europe’s digital infrastructure hub, a role reinforced when Microsoft confirmed a USD 704 million expansion of its Warsaw cloud region in February 2025. Generous EU funding for grid-interactive storage and a national digital budget of USD 7.4 billion keep capital flowing toward power-dense facilities that can host AI training clusters. Poland’s grid is also cleaner than before: renewables provided 27% of electricity in 2024 compared with the coal-heavy mix seen two years earlier. Equipment demand tracks these policy and investment shifts.
Key Report Takeaways
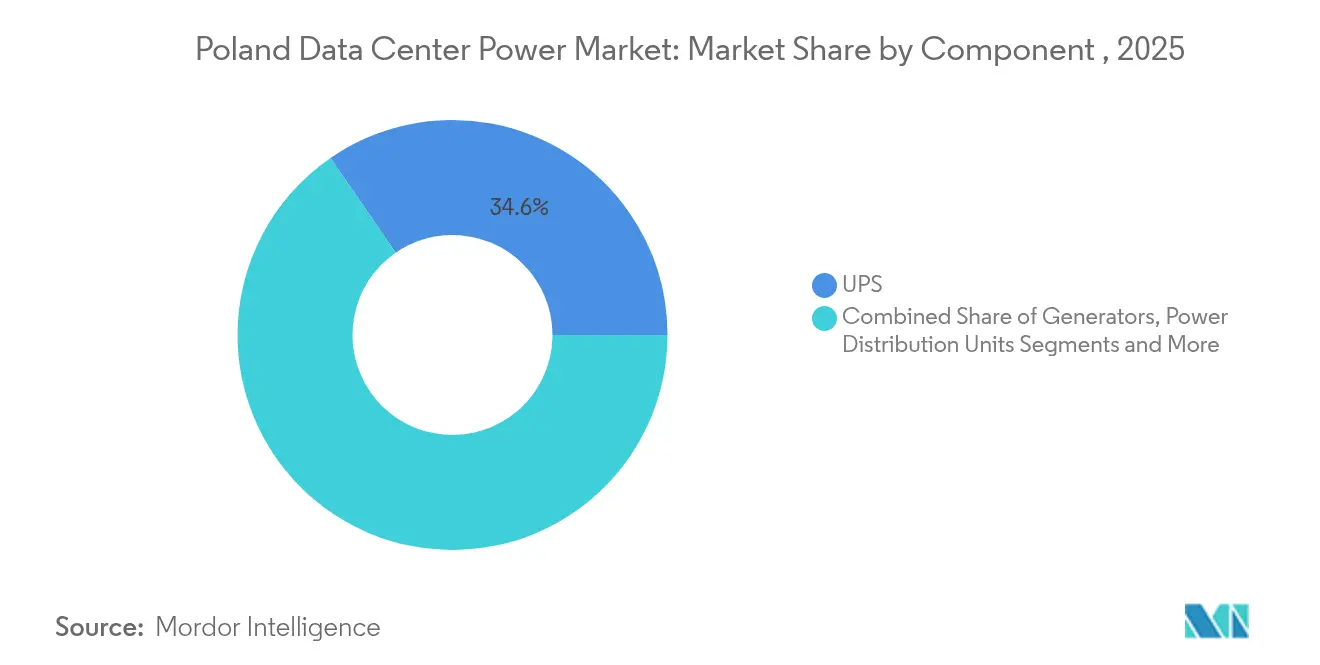
- By component, UPS Systems led with 34.60% of the Poland data center power market share in 2025, while Power Distribution Units are forecast to expand at a 13.42% CAGR to 2031.
- By data center type, colocation providers accounted for 51.20% revenue in 2025; hyperscale and cloud operators are projected to grow the fastest at a 14.49% CAGR through 2031.
- By data center size, large facilities captured 30.40% of the Poland data center power market size in 2025, whereas mega-scale projects are poised to advance at a 15.05% CAGR to 2031.
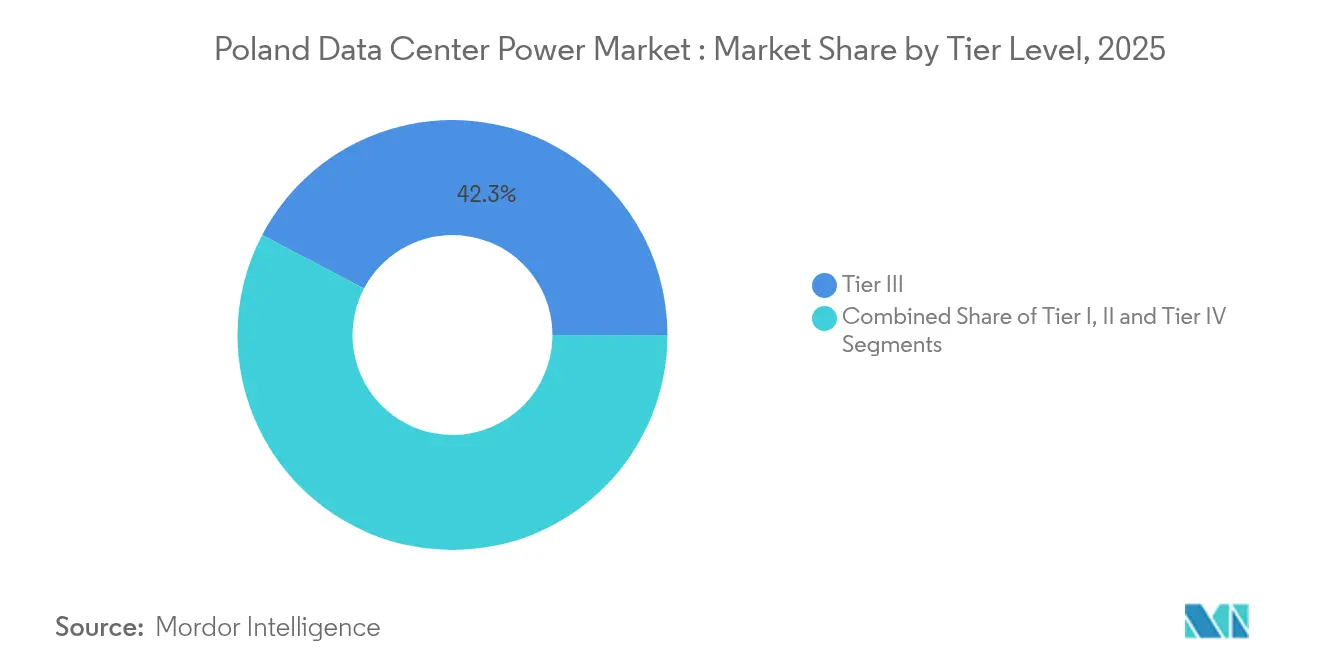
- By tier level, Tier III facilities dominated with a 42.30% share in 2025, while Tier IV is the fastest-growing class at a 15.28% CAGR through 2031.
Note: Market size and forecast figures in this report are generated using Mordor Intelligence’s proprietary estimation framework, updated with the latest available data and insights as of 2026.
Poland Data Center Power Market Trends and Insights
Drivers Impact Analysis*
| Driver | (~)% Impact on CAGR Forecast | Geographic Relevance | Impact Timeline |
|---|---|---|---|
| Cloud & hyperscale build-outs accelerate UPS and generator refresh cycles | +3.2% | Warsaw metro, secondary cities | Medium term (2-4 years) |
| AI-driven rack densities (>60 kW) pushing transition to lithium-ion & solid-state UPS | +2.8% | Major data center hubs nationwide | Short term (≤ 2 years) |
| EU subsidies for grid-interactive battery storage co-located with data centers | +2.1% | National, with concentration in Mazowieckie | Long term (≥ 4 years) |
| Modular power "pods" cut Polish construction lead-times by 40% | +1.9% | National deployment, Bielsko-Biała manufacturing hub | Medium term (2-4 years) |
| On-site renewables + PPAs improve PUE and unlock preferential power tariffs | +1.6% | National, with early adoption in Warsaw region | Long term (≥ 4 years) |
| Flex's new Bielsko-Biała switchgear plant localizes supply chain, lowering CAPEX | +1.4% | National supply chain optimization | Medium term (2-4 years) |
| Source: Mordor Intelligence | |||
Cloud and Hyperscale Build-outs Accelerate UPS and Generator Refresh Cycles
Hyperscale operators are dismantling the old ten-year depreciation playbook by swapping out legacy UPS fleets every five to seven years to match AI server needs. Microsoft’s current USD 704 million expansion is conditioned on higher-efficiency electrical gear that can support super-dense racks without unplanned outages. Beyond.pl mirrors the trend with a 150 MW campus engineered for AI training, where power equipment ratings sit 40–60% above colocation norms. As such, contracts flow, manufacturers gain repeat orders, and a secondary market emerges for refurbished UPS frames. Local integrators also benefit because fast swap cycles translate into multi-year service revenues. The upshot is a positive feedback loop: better power resilience encourages more cloud loads to land in Poland, reinforcing the Poland data center power market as a go-to regional hub.
AI-driven Rack Densities Pushing Transition to Lithium-ion and Solid-state UPS
AI clusters that draw more than 60 kW per rack force operators to rethink chemistry. Lithium-ion banks deliver 50–70% smaller footprints and slash heat output by 40% versus VRLA batteries, easing cooling burdens inside Warsaw’s tight real-estate footprints.[1]Legrand, “Powering the Future of AI Innovation and Efficiency,” legrand.comCisco’s internal AI rollout demonstrated that cleaner discharge curves improved neural-network training accuracy, a finding prompting other hyperscalers to adopt solid-state UPS blocks despite higher upfront cost cisco.com. Supply agreements now bundle eight-year performance guarantees as standard, further tilting the cost-benefit equation. Poland’s early adoption sends a signal to equipment makers to pilot their newest chemistries here, and those test beds feed back into better worldwide product designs.
An EU-sanctioned EUR 1.2 billion storage scheme partially offsets the capex of batteries that both protect servers and stabilize the Polish grid. [2]European Commission, “State aid: Commission approves €1.2 billion Polish scheme to support electricity storage facilities,” European Commission, ec.europa.eu The subsidy can cover up to 45% of qualified investments, making the business case attractive for colocation firms eager to monetize idle energy assets by bidding into the liberalized balancing market launched in June 2024. Early movers forecast payback periods below five years once frequency-response revenues are tallied. Mazowieckie, where most facilities connect, is the prime beneficiary because grid congestion is heaviest near Warsaw. Operators also frame the program as a hedge against rising wholesale power tariffs, championing it as proof that data centers can be part of the net-zero solution.
Modular Power Pods Reduce Polish Construction Lead-times by 40%
Flex doubled the footprint of its Bielsko-Biała plant to 1.2 million square feet to mass-produce factory-tested power pods that slot into Polish sites like Lego bricks. Prefabrication trims on-site labor by roughly 60%, critical in a country short of Tier IV electricians. Vertiv counts similar outcomes, claiming its off-site builds shave 30% off standard schedules.[3]Vertiv, “Prefabricated Data Center,” vertiv.comThe speed advantage gives local developers a way to secure cloud contracts that hinge on tight delivery windows. Standardized skids also help investors model capex with less variance, encouraging repeat builds that compound demand for switchgear, transformers, and monitoring systems.
Restraints Impact Analysis*
| Restraint | (~)% Impact on CAGR Forecast | Geographic Relevance | Impact Timeline |
|---|---|---|---|
| 25% YoY spike in Polish wholesale electricity prices post-2022 | -2.4% | National, with acute impact in industrial zones | Short term (≤ 2 years) |
| Grid-connection permitting delays averaging 18 months in Mazowieckie | -1.8% | Warsaw metro area, extending to secondary cities | Medium term (2-4 years) |
| Scarcity of Tier IV-certified electrical engineers in Poland | -1.2% | National skills shortage, concentrated in technical hubs | Long term (≥ 4 years) |
| Rising diesel costs inflate generator OPEX budgets by >15% | -0.9% | National impact on backup power systems | Short term (≤ 2 years) |
| Source: Mordor Intelligence | |||
25% YoY Spike in Polish Wholesale Electricity Prices Post-2022
The household tariff cap set by the government at 500 PLN/MWh offers no relief to commercial buyers, so colocation players scramble for renewable PPAs and energy-efficiency retrofits. Projects in early design are now modeling much higher utility costs and may face financing delays until lenders are convinced that hedging strategies are robust. While those pressures stimulate interest in on-site solar, they drag on headline growth, particularly for small entrants lacking economies of scale.
Grid-connection Permitting Delays Averaging 18 Months in Mazowieckie
Securing a medium-voltage tie-in to the Warsaw grid can take a year and a half as transmission operator PSE juggles competing requests from wind farms, factories, and data centers. Developers often shoulder EUR 2–5 million of grid-upgrade costs, pushing total project budgets higher and dampening IRRs. Some hyperscalers now consider Poznań or Wrocław to sidestep the Warsaw bottleneck, but those moves raise latency and complicate ecosystem clustering. The Energy Regulatory Office says reforms will ease purely technical refusals in 2026, yet current backlogs temper the otherwise strong outlook for the Poland data center power market.
*Our forecasts treat driver/restraint impacts as directional, not additive. The impact forecasts reflect baseline growth, mix effects, and variable interactions.
Segment Analysis
By Component: UPS Systems Anchor Spending While Intelligent PDUs Race Ahead
UPS Systems generated the largest slice of revenue, controlling 34.60% of the Poland data center power market in 2025. That standing stems from the non-negotiable need for conditioned power when AI training loads would crash within milliseconds of a voltage sag. Lithium-ion topologies dominate new fit-outs because they free up rack space and lower cooling demand. Hybrid diesel-plus-battery designs now ship with advanced monitoring so operators can flip to grid-support mode in under four seconds when frequency deviates. Meanwhile, the Poland data center power market size attached to PDUs is surging at a 13.42% CAGR, a reflection of racks evolving from passive metal frames to smart energy nodes. Modern PDUs feature circuit-level metering that feeds DCIM dashboards in real time, letting operators shed non-critical loads during price peaks or grid events. Vendors capitalize on these data streams by bundling analytics that predict breaker trips days in advance.
Service contracts expand in parallel. Complex lithium chemistries need certified technicians, pushing demand for Maintenance and Support packages that extend warranty cover beyond five years. Training modules now blend augmented-reality walk-throughs so Poland’s thin talent pool can upskill without leaving the facility, a win for both employer and engineer


By Data Center Type: Hyperscale Acceleration Redefines Design Norms
Colocation still represents 51.20% of sector revenue because local enterprises prefer renting space rather than funding a full build-out. Yet hyperscalers will log the fastest 14.49% CAGR through 2031 as AI workloads flock to dedicated campuses engineered above 60 kW per rack. Those campuses import standardized electrical rooms that bolt together like shipping containers, slashing field wiring hours and raising the Poland data center power market profile with global procurement teams. Edge and enterprise facilities fill a complementary role. Banks and public agencies, bound by sovereignty mandates, stick with on-premises rooms that seldom exceed 5 MW but demand near-Tier III uptime, reinforcing a healthy tail of medium-sized orders for switchgear and standby gensets
By Data Center Size: Mega Projects Pull the Spending Curve Upward
Large facilities led revenue stakes with a 30.40% share in 2025, yet mega-scale sites will grow at a 15.05% rate over the forecasted period. Economics drive this pivot: doubling capacity only raises electrical capex by around 65% because switchgear housings and control rooms scale non-linearly. Mega campuses spread across 100-plus acres also offer land for on-site solar arrays big enough to offset 5–10% of load, a slice that meaningfully dented the Poland data center power market size for external electricity purchases in 2024. Massive and medium sites remain relevant for latency-sensitive uses, notably gaming platforms that must stay under 15 milliseconds for regional users. Small data centers, often retrofits in office basements, see fewer new builds but plentiful modernization work as tenants request lithium UPS retrofits that avert fire-code headaches common with VRLA rooms.

By Tier Level: Premium Tier IV Adoption Signals Zero-Downtime Economics
Tier III remains the commercial workhorse with 42.30% share due to its pragmatic N+1 redundancy and familiar O&M routines. Operators tolerate the incremental downtime risk because it shaves roughly USD 4 million off capex for a 10 MW hall versus a pure Tier IV blueprint. Yet client appetite for AI training and high-frequency trading is nudging the CAGR needle: Tier IV installations, each boasting fully independent electrical paths, will rise 15.28% annually to 2031. That trend lifts the Poland data center power market because Tier IV doubles the quantity of UPS strings, busways, and automatic transfer switches. Costs run 25–40% above Tier III, but financial penalties from any outage easily eclipse those premiums for algorithmic traders or generative AI modelers.
Geography Analysis
Warsaw offers the deepest fiber routes, carrier hotels, and enterprise demand clusters. The concentration pushes land prices up but grants sub-20 millisecond latency to most CEE capitals, a statistic that cements Warsaw as the front door for hyperscalers entering the region. Grid congestion, however, makes developers weigh Kraków, Poznań, and Wrocław more seriously. Kraków benefits from hydro-rich southern Poland, Poznań sits near Germany’s 50Hertz interconnection, and Wrocław grabs attention for its lower real-estate costs and educated workforce supplied by local universities.
Northern provinces could gain as offshore wind farms connect into 400 kV substations now being upgraded by SPIE under contracts with PSE spie.com. Data-center planners see an opening to anchor campuses near those substations where power is green and interconnection fees are modest. Meanwhile, Poland’s chilly climate allows free-air cooling for roughly half the year, trimming PUE by 0.1–0.2 points versus Vienna or Frankfurt. That climatic edge supports the Poland data center power market narrative that the country can host compute-intensive AI clusters at lower energy overhead.
Competitive Landscape
ABB, Schneider Electric, and Vertiv leverage global R&D budgets to roll out lithium-ready switchgear and predictive-maintenance software. Delta Electronics and Riello occupy the value niche, winning deals in edge sites by tailoring compact UPS blocks. Domestic providers such as Atman and Beyond.pl differentiate on integrated offerings: they own the white space and supply the power plant, which removes interface risk for tenants. The mix produces a mid-level market concentration where no single vendor tops an eighth of revenue, leaving room for specialization. The market is moderately consolidated.
Strategically, modularization is the battlefield. Flex’s plant expansion puts Polish-made pods on a four-week delivery timeline versus the ten-week import cycle from Asia flex.com. That speed compels foreign OEMs to consider local assembly lines, raising Poland’s footprint in the global data center supply chain. Another differentiator is participation in grid services. Enel X signs virtual power plant agreements so data centers can bid spinning reserve, a feature that lures operators wary of thin margins from pure space-and-power leases. Hydrogen fuel-cell prototypes by Eaton and Ballard are also undergoing field trials, pushed by operators keen to meet net-zero targets ahead of EU deadlines.
Poland Data Center Power Industry Leaders
ABB Ltd
Caterpillar Inc.
Eaton Corporation
Vertiv Group Corp.
Schneider Electric SE
- *Disclaimer: Major Players sorted in no particular order

Recent Industry Developments
- May 2025: Flex announced the expansion of its Critical Power Business manufacturing footprint in Bielsko-Biała, doubling production capacity to 1.2 million sq ft and adding 700 jobs.
- May 2025: Greykite and White Star Real Estate completed Digital Ursus, converting a Warsaw warehouse into an 18 MW facility with a USD 339 million plan to reach 65 MW.
- March 2025: BlackRock launched the AI Infrastructure Partnership with Microsoft and others, mobilizing USD 30 billion for AI data centers and energy assets.
- February 2025: Microsoft confirmed an additional USD 704 million expansion of its Polish cloud region, targeting completion by summer 2026.


Research Methodology Framework and Report Scope
Market Definitions and Key Coverage
Our study defines the Poland data center power market as the yearly expenditure on electrical infrastructure and allied services that keep domestic data halls energized. The basket covers uninterruptible power-supply systems, backup generators, power-distribution units, transfer switches, switchgear, critical monitoring, plus installation and maintenance services used across colocation, hyperscale, enterprise, and edge facilities. Purchases are counted when physical hardware is delivered onsite; leasing fees and utility bills are excluded to keep figures tied to tangible assets.
Scope exclusions: Cooling equipment, mechanical racks, civil construction, and retail electricity charges are outside this review.
Segmentation Overview
- By Component
- Electrical Solutions
- UPS Systems
- Generators
- Diesel Generators
- Gas Generators
- Hydrogen Fuel-cell Generators
- Power Distribution Units
- Switchgear
- Transfer Switches
- Remote Power Panels
- Energy-storage Systems
- Service
- Installation and Commissioning
- Maintenance and Support
- Training and Consulting
- Electrical Solutions
- By Data Center Type
- Hyperscaler/Cloud Service Providers
- Colocation Providers
- Enterprise and Edge Data Center
- By Data Center Size
- Small Size Data Centers
- Medium Size Data Centers
- Large Size Data Centers
- Massive Size Data Centers
- Mega Size Data Centers
- By Tier Level
- Tier I and II
- Tier III
- Tier IV
Detailed Research Methodology and Data Validation
Primary Research
Mordor analysts then conduct structured interviews with facility engineers, electrical contractors, OEM channel partners, and regional grid planners in Warsaw, Poznan, Krakow, and Wroclaw. Insights on average selling prices, redundancy preferences, lead-time slippage, and grid-upgrade costs sharpen assumptions and close data gaps surfaced during desk work.
Desk Research
We build an initial universe of facilities from Poland's Energy Regulatory Office filings, customs import codes for UPS and gensets, the Polish Data Center Association registry, and project tenders. Company 10-Ks, investor decks, reputable trade press, and paid feeds such as D&B Hoovers and Dow Jones Factiva supply shipment values, vendor splits, and deal timelines. These public and subscription sources, alongside many others, furnish the baseline dataset that underpins our model.
Market-Sizing & Forecasting
A top-down spend model begins with installed IT load and forecast megawatt additions announced by operators, which are converted to electrical capex using interview-derived $ per MW ratios. Select bottom-up checks, supplier roll-ups and sampled UPS ASP x volume, anchor unit realism before totals are finalized. Key variables include new IT load pipeline, targeted PUE levels, diesel price trends, PLN-USD exchange rates, and project permitting timelines. A multivariate regression on these drivers yields the 2025-2030 outlook, with scenario analysis layering energy-price or incentive shocks.
Data Validation & Update Cycle
Outputs face anomaly screens against import statistics, vendor revenue splits, and prior forecasts, followed by a two-layer analyst review. We refresh the model annually and issue interim updates whenever a single project above 5 MW reaches financial close, ensuring clients receive the most current view.
Why Mordor's Poland Data Center Power Baseline Commands Reliability
Published estimates often diverge because firms mix differing equipment baskets, lock ASPs to separate years, or freeze currency at assorted rates.
By disclosing scope, rebuilding unit economics each refresh, and aligning values to the delivery year, Mordor delivers a balanced baseline decision-makers can trust.
Benchmark comparison
| Market Size | Anonymized source | Primary gap driver |
|---|---|---|
| 188.09 million | Mordor Intelligence | - |
| 176.24 million (2024) | Regional Consultancy A | Includes energy-storage systems and uses 2021 ASPs |
| 166.30 million | Global Consultancy B | Applies pan-European ASPs, omits installation services |
| 215.00 million (2025) | Trade Journal C | Blends electrical and mechanical spend, assumes aggressive hyperscale ramp-up |
The comparison shows that once scope, currency, and timing are harmonized, gaps narrow quickly, reinforcing that Mordor's disciplined, annually refreshed framework provides the most transparent and reproducible baseline for Poland's data center power opportunity.


Key Questions Answered in the Report
What is the current size of the Poland data center power market and how fast is it growing?
The market is valued at USD 212.44 million in 2026 and is forecast to reach USD 390.28 million by 2031 on a 12.94% CAGR trajectory.
Which component captures the largest revenue share in Poland’s data center power spending?
UPS Systems lead the component landscape, holding 34.60% of market revenue in 2025 due to stringent power-quality requirements for AI workloads.
Why are hyperscale and cloud operators expanding so aggressively in Poland?
They benefit from large digital-economy budgets, EU storage subsidies, and modular power pods that cut build times by about 40%, driving a 14.49% CAGR for the hyperscale segment through 2031.
How important is Tier IV redundancy in the Polish market outlook?
Tier IV facilities are the fastest-growing tier class at a 15.28% CAGR because mission-critical AI training and trading applications cannot tolerate any unplanned downtime.
Page last updated on:


