Utility Markers Market Size and Share
Market Overview
| Study Period | 2019 - 2030 |
|---|---|
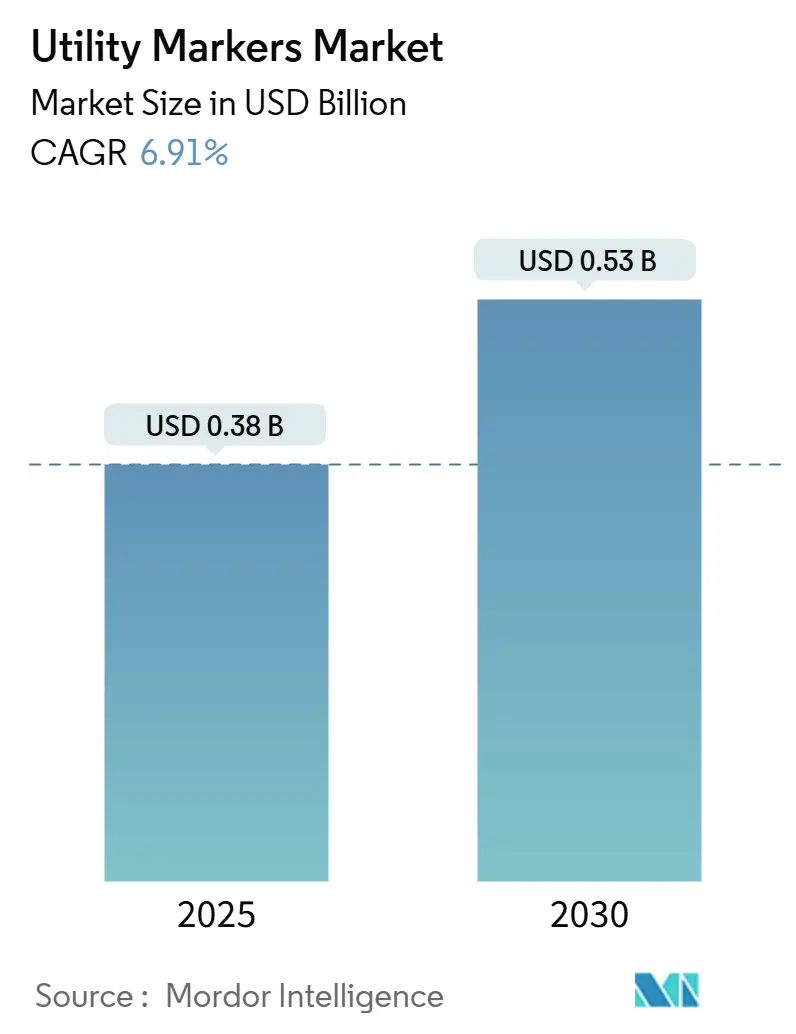
| Market Size (2025) | USD 0.38 Billion |
| Market Size (2030) | USD 0.53 Billion |
| Growth Rate (2025 - 2030) | 6.91% CAGR |
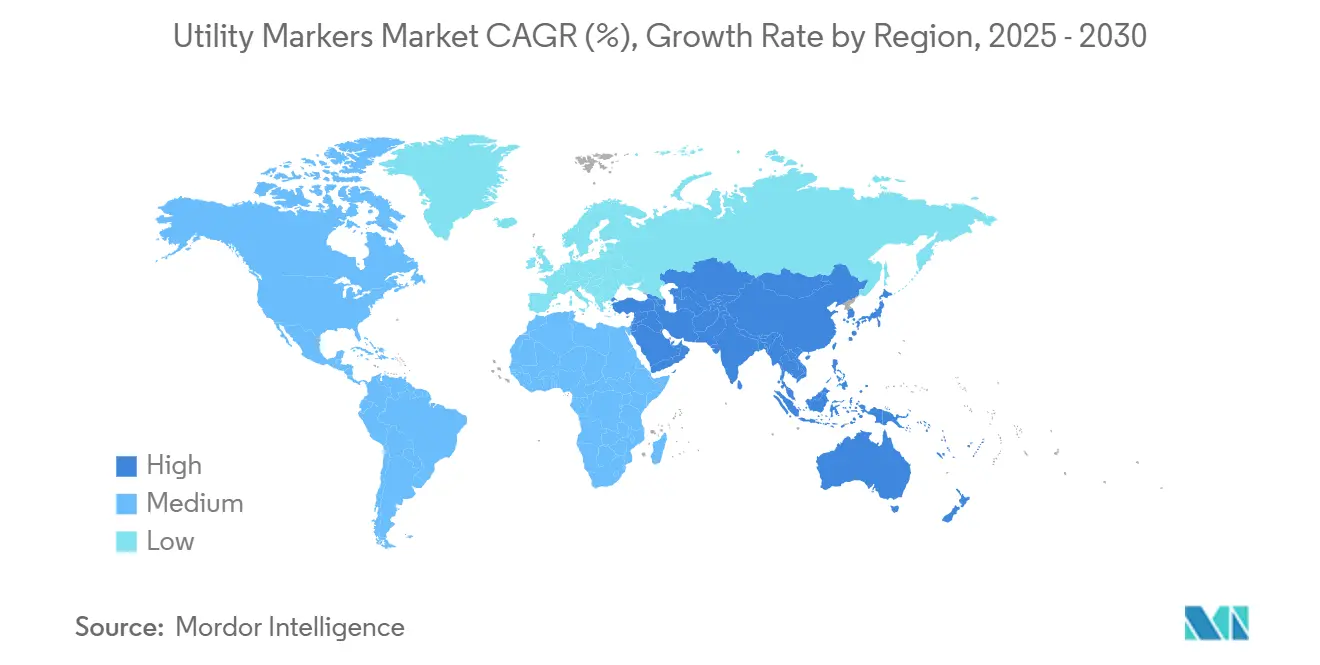
| Fastest Growing Market | Asia Pacific |
| Largest Market | North America |
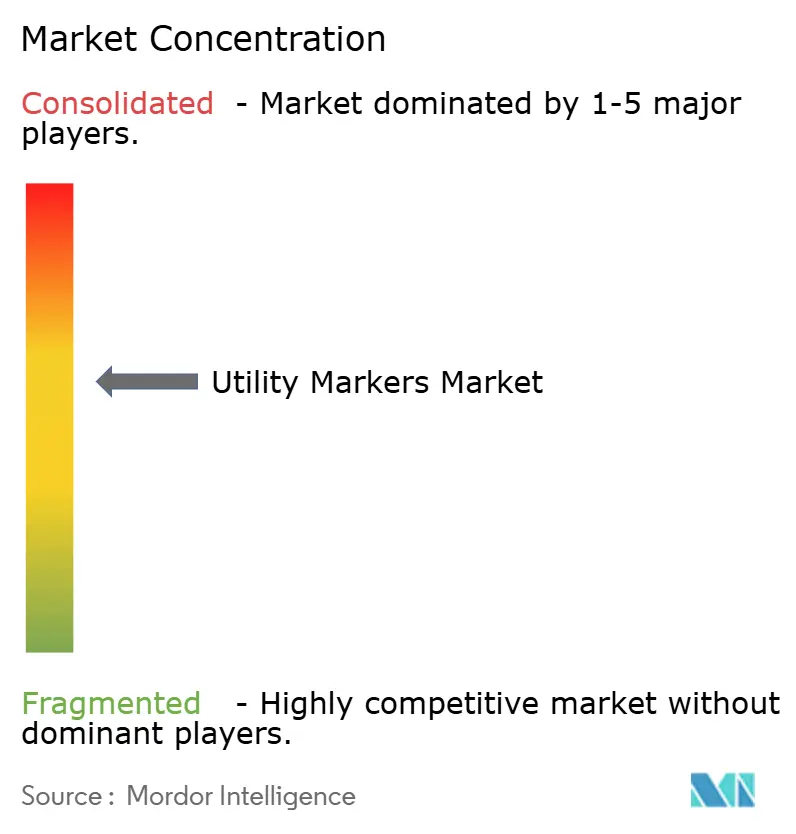
| Market Concentration | Medium |
Major Players *Disclaimer: Major Players sorted in no particular order Image © Mordor Intelligence. Reuse requires attribution under CC BY 4.0. | |
Utility Markers Market Analysis by Mordor Intelligence
The utility markers market size reached USD 380 million in 2025 and is projected to hit USD 530 million by 2030, reflecting a 6.91% CAGR. Consistent public- and private-sector spending on 5G fiber corridors, smart-grid upgrades, and climate-resilient undergrounding programs sustains demand, while convergence toward American Public Works Association (APWA) color-coded standards lowers adoption barriers and stimulates global ordering volumes. Growing preference for electronic and RFID-enabled identifiers ties physical assets to enterprise digital-twin platforms, allowing utilities to reduce strike incidents and maintenance downtime. Enforcement momentum also matters; Washington State, New Jersey, and Energy Safe Victoria have all raised civil penalties for unmarked or inaccurately marked utilities, translating into tangible purchasing incentives. Meanwhile, stable HDPE pricing amid polyethylene oversupply tempers raw-material inflation, even as fiberglass and composite alternatives gain favor for long-life installations.
Key Report Takeaways
- By utility type, electric power held 28.34% of the utility markers market share in 2024, while telecom and fiber utilities are expanding at a 7.12% CAGR through 2030.
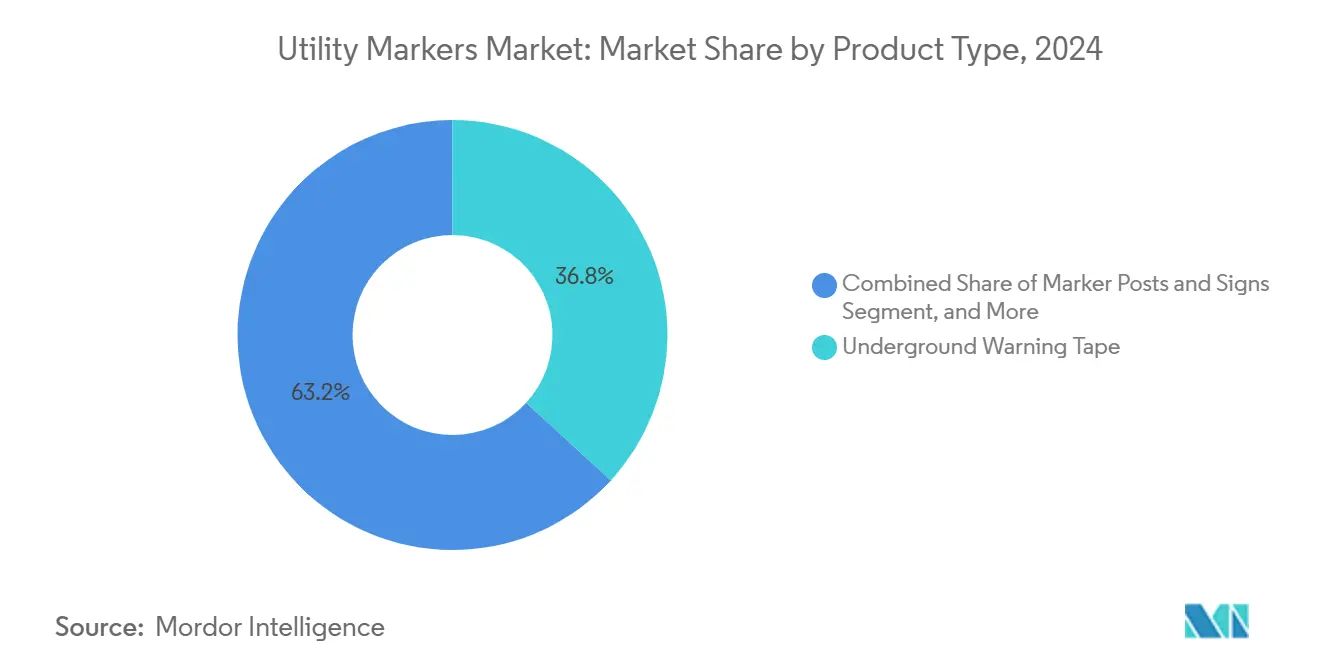
- By product type, underground warning tape accounted for 36.82% of the utility markers market size in 2024, whereas electronic/RFID markers are advancing at a 7.67% CAGR to 2030.
- By detection technology, passive color-coded systems retained 43.87% of the utility markers market size in 2024, but RFID/EMS solutions are poised for a 7.73% CAGR through 2030.
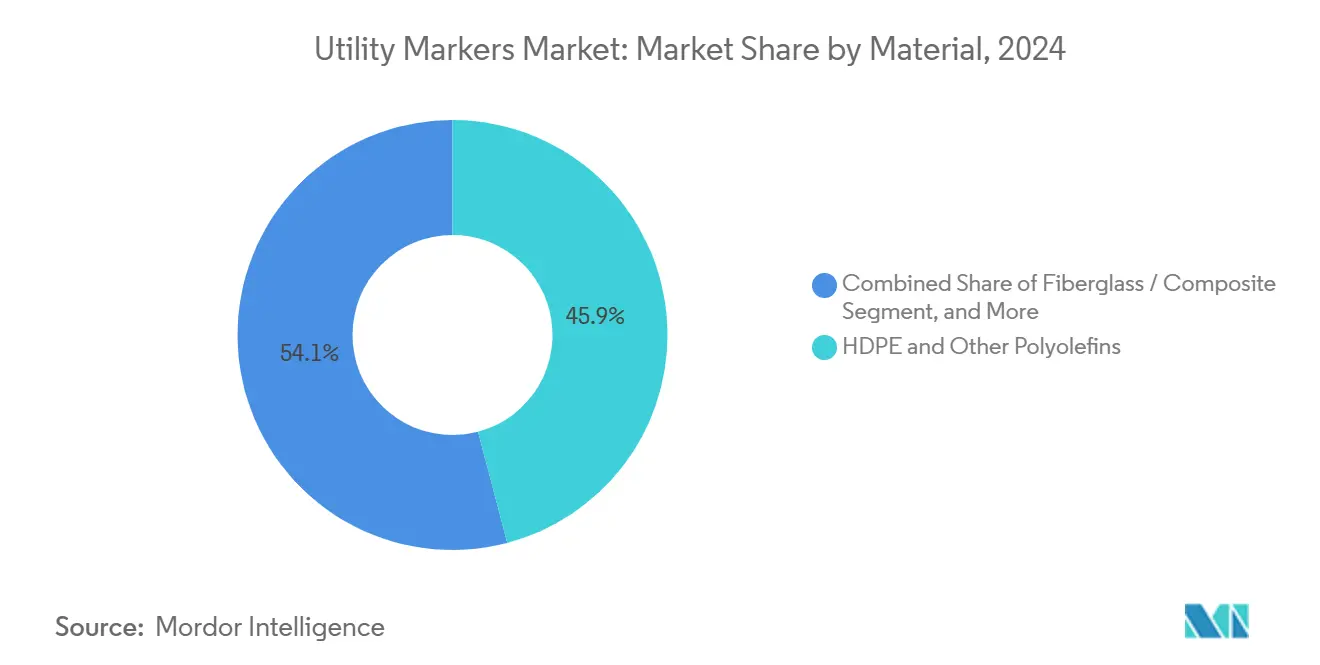
- By material, HDPE and other polyolefins captured 45.91 of % utility markers market share in 2024, yet fiberglass/composites show the fastest growth at 7.46% CAGR.
- By end user, utility network operators represented 32.68% of 2024 demand, while EPC and construction contractors are growing at a 7.89% CAGR through 2030.
- By geography, North America led with 42.74% utility markers market share in 2024; Asia-Pacific is forecast to climb at a 6.97% CAGR between 2025 and 2030.
Global Utility Markers Market Trends and Insights
Drivers Impact Analysis*
| Driver | (~) % Impact on CAGR Forecast | Geographic Relevance | Impact Timeline |
|---|---|---|---|
| Rapid rollout of 5G fiber and grid-modernization | +1.8% | Global, led by Asia-Pacific and North America | Medium term (2-4 years) |
| Surge in undergrounding mandates | +1.5% | North America and EU; expanding in Asia-Pacific | Long term (≥ 4 years) |
| Regulatory shift to APWA compliance | +1.2% | Global | Medium term (2-4 years) |
| Adoption of RFID/ID markers | +1.0% | North America and EU core, Asia-Pacific spill-over | Long term (≥ 4 years) |
| Higher penalties for utility strikes | +0.8% | North America and Australia | Short term (≤ 2 years) |
| AI-enabled asset-management bundling | +0.6% | Global | Long term (≥ 4 years) |
| Source: Mordor Intelligence | |||
Rapid rollout of 5G fiber and grid-modernization projects
State Grid Corporation of China broke ground on a CNY 35.3 billion (USD 4.82 billion) ±800 kV UHV line in 2025, underscoring how next-generation transmission corridors require dense underground identifiers to protect high-value assets.[1]Enerdata, “China Starts Work on an ±800 kV Transmission Project,” ENERDATA.NET Parallel smart-grid expansions in India allocate USD 109 billion to green-power interconnections, each kilometer of new trench demanding color-coded tape and RFID beacons that align with APWA conventions. Fiber-to-the-premises rollouts share many of the very same rights-of-way, multiplying marker counts per linear mile. Telecom operators and electric utilities increasingly pool procurement to simplify BOMs and leverage volume pricing. Consequently, multi-utility corridors have become a core growth node for the utility markers market.
Surge in undergrounding mandates to climate-proof utilities
Extreme weather events push municipal and state agencies to bury power lines, water mains, and fiber conduits for resilience. Katy, Texas, imposed a moratorium on fresh fiber work after repeated water-line strikes, a move that triggered new tender packages specifying higher-visibility marker materials and RFID tags. EarthGrid’s USD 18 billion plasma-boring JV promises faster trenching but also mandates long-life fiberglass posts at every access vault. Similar policies appear in California, Florida, and parts of Germany, lifting unit volumes for composite posts and warning tapes that survive decades underground without fading or delaminating.
Regulatory shift toward APWA color-coded compliance worldwide.
Australia’s AS5488 now mirrors APWA’s hue assignments, allowing global OEMs to manufacture a consolidated product line and reduce SKU complexity.[2]Jurovich Surveying, “Standard Colours for Underground Utility Surveys,” JUROVICHSURVEYING.COM.AU Washington State toughened its dig law in July 2025, imposing fines up to USD 25,000 for damaging gas pipelines and making design locating compulsory near transmission lines. Conformity demands spur utilities to refresh legacy markers, replace generic tapes, and integrate data-rich RFID chips for audit traceability. These harmonized rules lower compliance costs and accelerate cross-border product approvals, giving the utility markers market another growth lever.
Adoption of RFID/ID markers enabling digital-twin integration
Berntsen International’s OmniMarker II encodes location, owner, and depth data, feeding GIS and AI analytics for predictive maintenance scheduling.[3]Berntsen International, “OmniMarker II Product Information,” BERNTSEN.COM Southern Company Gas uses similar technology to feed risk models that cut dig-in incidents, proving ROI on higher-priced RFID tags. As utilities chase operational excellence and regulatory pressure for strike reduction, RFID adoption migrates from pilots to capital budgets. Coupled with cellular or NB-IoT readers, buried assets now “self-report,” making manual locate tickets faster and cheaper.
Restraints Impact Analysis*
| Restraint | (~) % Impact on CAGR Forecast | Geographic Relevance | Impact Timeline |
|---|---|---|---|
| Volatile petro-polymer prices | −1.2% | Global; Asia-Pacific most exposed | Short term (≤ 2 years) |
| Locator skills shortage | −0.8% | North America and EU | Medium term (2-4 years) |
| Fragmented procurement codes | −0.5% | Global | Long term (≥ 4 years) |
| Environmental pushback on single-use plastics | −0.3% | EU and North America | Long term (≥ 4 years) |
| Source: Mordor Intelligence | |||
Volatile petro-polymer prices inflate tape and post costs.
China and Southeast Asia added 5 million tons of new polyethylene capacity in 2025, rattling global price stability; HDPE film has swung between USD 910 and USD 1,030 per ton since late 2024, squeezing converter margins. In the U.S., propylene feedstock spiked after LyondellBasell’s Houston shutdown, pushing polymer-grade propylene above 40 cents per pound. Marker manufacturers hedge with quarterly surcharges, but utilities still face unpredictable bid prices on long-duration projects, slowing order releases, and trimming near-term volumes in the utility markers market.
Locator skills shortage slows electronic marker adoption.
The manufacturing sector advertised 486,000 open positions in mid-2024, and technical vacancies spill into specialized locating crews that install and program RFID markers. Smaller municipal utilities struggle to recruit or retrain staff, often opting for conventional color tape despite interest in digital solutions. Training backlogs lengthen installation lead times and push utilities to outsource to EPC contractors, dampening do-it-yourself demand. Unless vocational pipelines expand, RFID penetration may plateau below its technology potential in several regions.
*Our forecasts treat driver/restraint impacts as directional, not additive. The impact forecasts reflect baseline growth, mix effects, and variable interactions.
Segment Analysis
By Product Type: Underground Warning Tape Retains the Volume Advantage
Underground warning tape accounted for 36.82% of the utility markers market size in 2024, reflecting its low unit cost and straightforward installation protocols. Electronic/RFID balls and tags, although costlier, are registering the fastest 7.67% CAGR because they align with digital-twin mandates and yield measurable OPEX savings over asset life. Marker posts and signs remain indispensable for rural rights-of-way, while paint and flags serve temporary projects where removal is expected post-construction. The utility markers market, therefore, balances a high-volume, low-margin tape segment with a smaller but faster-growing electronic category that boosts blended ASPs.
Unit economics favor tape when installation crews are paid by the foot, yet utilities are beginning to layer RFID chips into tape rolls, creating a hybrid that keeps costs manageable while delivering electronic traceability. Brady Corporation’s V4500 scanner pairs natively with its color-coded tapes, illustrating how incumbents are future-proofing commodity SKUs. Industry dialogues now center on specifying dual-function products in master bid schedules; once such hybrids become routine, the electronic share of the utility markers market could rise more steeply after 2027.


By Detection Technology: Passive Systems Still Dominate but RFID/EMS Surges
Passive hue-based markers controlled 43.87% of the utility markers market share in 2024 because every excavator recognizes APWA colors with minimal tooling. RFID/EMS solutions, projecting a 7.73% CAGR, deliver depth and ownership metadata that passive markers cannot, positioning them as the backbone of smart-utility programs. Metallic foil and magnetic tags provide mid-tier options where electromagnetic locate tools already exist; adoption is steady but not explosive.
Cost differentials narrow each year, especially as 3M phases out PFAS coatings and moves to next-generation polymers that cut total installed cost by 8-10%. Utility purchasing committees are thus recalibrating life-cycle value calculations. Caltrans reported a 95% reduction in manual locate time after integrating AI mapping with RFID markers, sparking interest among DOTs nationwide. If similar case studies proliferate, the detection-technology mix within the utility markers market may flip earlier than current forecasts assume.
By Utility Type: Power Grids Lead while Telecom Accelerates
Electric power networks held 28.34% of 2024 demand in the utility markers market owing to multiyear smart-grid allocations and federal reliability targets. Telecom and fiber corridors, however, show the swiftest 7.12% CAGR as 5G rollouts and data-center backhauls stretch into suburban and rural counties. Gas and steam pipelines continue to procure high-spec markers to meet heightened safety audits following several notable explosions, while water and sewer upgrades piggyback on federal infrastructure grants to replace corroded lines.
Shared trenching amplifies marker density because each utility must be identifiable both visually and electronically. Valmont Industries’ Q1 2025 results confirm upticks in telecommunications-related hardware shipments, supporting the consensus that fiber will be the single-largest incremental growth driver through 2030. The telecom swell is unlikely to dislodge electric power from revenue leadership before 2030, yet it reshapes specification sheets toward higher-tech solutions and broadens the customer base for the utility markers market.
By Material: HDPE Dominance Faces Composite Upswing
HDPE and other polyolefins formed 45.91% of 2024 sales, a figure reflecting long-standing converter availability and favorable price-performance ratios. Fiberglass and composite alternatives are expanding at a 7.46% CAGR, propelled by longer service life, UV stability, and resistance to soil chemistry in acidic or alkaline districts. Metallic foils remain essential for electromagnetic detectability, yet the weight penalty drives interest in lightweight GFRP pultrusions, especially in high-wind or corrosive coastal zones.
Composite costs, once double those of plastics, have narrowed as pultrusion plants scale and resin suppliers reformulate lower-styrene blends that cure faster. Project owners now evaluate 30-year life cycles, tilting bid awards toward composites despite higher upfront capex. Several state DOTs already stipulate fiberglass marker posts for highway shoulders to cut replacement truck-rolls, signaling a structural materials shift inside the utility markers market.
By End User: Contractors Gain Share as Outsourcing Rises
Utility network operators captured 32.68% of demand in 2024, but EPC and construction contractors are not far behind and register the highest 7.89% CAGR. Outsourcing spreads capital risk and leverages specialist crews amid ongoing labor shortages. Municipal authorities represent a steady if fragmented buyer cluster as they upgrade public works and enforce APWA conformity in permit conditions. Pipeline and midstream operators, grappling with stricter federal audits, account for a stable slice, yet they increasingly mandate RFID markers for long-distance transmission segments.
Contractors serving design-build projects often select composite posts and RFID-embedded tapes to meet warranty clauses that run well past substantial completion. Their growing influence means spec dominance could shift faster than if utilities alone dictated bills of material. The utility markers market thus taps two separate but synergistic capital pools: public-utility budgets and private-contractor project funds.
Geography Analysis
North America led with 42.74% utility markers market share in 2024, anchored by stringent “One Call” statutes and high average strike remediation costs of USD 56,000 per incident. Penalty hikes in New Jersey and Washington State reinforce compliance urgency and sustain steady reorder cycles. Canada’s rollout of national 5G corridors and wildfire-driven undergrounding in California and British Columbia further elevate marker density per linear mile.
Asia-Pacific is forecast to expand at a 6.97% CAGR, propelled by China’s USD 4 trillion “hidden infrastructure” program that renovates aging pipelines beneath urban blocks. State Grid’s plan to extend UHV lines beyond 51,670 km by 2030, plus India’s USD 109 billion green-power network, amplifies ordering prospects. Rapid urbanization encourages municipalities from Jakarta to Manila to hard-spec APWA color schemes, compressing time-to-market for international vendors.
Europe maintains mid-single-digit growth underpinned by climate-adaptation budgets that favor durable composite posts and reusable RFID tags to cut plastic waste. EU directives on circular materials could mandate recycled-content tape by 2028, offering first-mover advantage to suppliers with green formulations. The Middle East and Africa see steady demand around oil, gas, and desalination corridors, while South America benefits from Brazilian grid expansions and Argentina’s fiber-optic backbone projects. Each region exhibits unique regulatory textures, yet all coalesce around standardized color nomenclature, providing a unified tailwind for the utility markers market.

Competitive Landscape
The utility markers market shows moderate fragmentation: the top five vendors command roughly 55-65% combined revenue, driven by package breadth and global distribution footprints. 3M, Brady Corporation, and Berntsen International leverage R&D scale and cross-sector customer lists to lock in long-term master agreements. Brady posted USD 1.341 billion in fiscal-2024 sales with a 51.6% gross margin, aided by new scanners and printers that bundle software with consumables, thereby raising switching costs.
Market leaders focus on technology roadmaps rather than pure price competition. 3M’s PFAS exit accelerates innovation in non-fluorinated coatings that may extend tape longevity by 15% while meeting tightening environmental rules. Berntsen’s OmniMarker II embeds encrypted memory, allowing chain-of-custody audit trails-a feature appealing to gas utilities facing federal scrutiny. Meanwhile, niche firms like Rhino Marking and Tempo Communications occupy regional or vertical sweet spots, supplying custom-printed tape or telecom-centric locators and sustaining healthy margins through specialization.
Disruptive entrants emphasize sustainability and digital integration. Start-ups are piloting bio-based resins and IoT-enabled locate wands that stream live positioning data to cloud dashboards. Established contractors such as Valmont Industries diversify into markers, cross-selling through their pole and tower channels after telecommunications revenue rose 5.9% year-on-year in Q1 2025. Consolidation remains plausible, especially as composite material know-how becomes a strategic asset; yet antitrust thresholds and the localized nature of excavation codes temper blockbuster M&A.
Utility Markers Industry Leaders
3M Company
Brady Corporation
Valmont Composite Structures, Inc. (Carsonite)
Berntsen International, Inc.
Vulcan Inc.
- *Disclaimer: Major Players sorted in no particular order

Recent Industry Developments
- July 2025: China approved its first cross-provincial green hydrogen pipeline linking Inner Mongolia and Beijing, setting new precedent for hydrogen-ready identification protocols.
- July 2025: Washington State enacted tougher dig laws with fines up to USD 25,000 for pipeline hits, deepening compliance obligations.
- May 2025: Energy Safe Victoria raised maximum corporate fines to AUD 237,108 (USD 158,000) for unsafe electrical work, bolstering demand for high-visibility markers.
- April 2025: AT&T incurred USD 60,000 in penalties for 60 unmarked lines, underscoring economic impacts of non-compliance.


Global Utility Markers Market Report Scope
| Underground Warning Tape |
| Electronic/RFID Marker Balls and Tags |
| Marker Posts and Signs |
| Paint, Flags and Misc. |
| Passive (Colour / Visual) |
| Detectable Metallic |
| RFID / EMS |
| Magnetic and Resonance |
| Electric Power |
| Gas / Oil / Steam |
| Telecom and Fibre |
| Water and Sewer |
| Reclaimed / Purple Water |
| HDPE and Other Polyolefins |
| Fiberglass / Composite |
| Metallic Foil and Magnets |
| Specialty Inks and Paints |
| Utility Network Operators |
| EPC and Construction Contractors |
| Municipal Authorities |
| Pipeline and Midstream Operators |
| North America | United States | |
| Canada | ||
| Mexico | ||
| Europe | Germany | |
| United Kingdom | ||
| France | ||
| Russia | ||
| Rest of Europe | ||
| Asia-Pacific | China | |
| Japan | ||
| India | ||
| South Korea | ||
| Australia | ||
| Rest of Asia-Pacific | ||
| Middle East and Africa | Middle East | Saudi Arabia |
| United Arab Emirates | ||
| Rest of Middle East | ||
| Africa | South Africa | |
| Egypt | ||
| Rest of Africa | ||
| South America | Brazil | |
| Argentina | ||
| Rest of South America | ||
| By Product Type | Underground Warning Tape | ||
| Electronic/RFID Marker Balls and Tags | |||
| Marker Posts and Signs | |||
| Paint, Flags and Misc. | |||
| By Detection Technology | Passive (Colour / Visual) | ||
| Detectable Metallic | |||
| RFID / EMS | |||
| Magnetic and Resonance | |||
| By Utility Type | Electric Power | ||
| Gas / Oil / Steam | |||
| Telecom and Fibre | |||
| Water and Sewer | |||
| Reclaimed / Purple Water | |||
| By Material | HDPE and Other Polyolefins | ||
| Fiberglass / Composite | |||
| Metallic Foil and Magnets | |||
| Specialty Inks and Paints | |||
| By End-User | Utility Network Operators | ||
| EPC and Construction Contractors | |||
| Municipal Authorities | |||
| Pipeline and Midstream Operators | |||
| By Geography | North America | United States | |
| Canada | |||
| Mexico | |||
| Europe | Germany | ||
| United Kingdom | |||
| France | |||
| Russia | |||
| Rest of Europe | |||
| Asia-Pacific | China | ||
| Japan | |||
| India | |||
| South Korea | |||
| Australia | |||
| Rest of Asia-Pacific | |||
| Middle East and Africa | Middle East | Saudi Arabia | |
| United Arab Emirates | |||
| Rest of Middle East | |||
| Africa | South Africa | ||
| Egypt | |||
| Rest of Africa | |||
| South America | Brazil | ||
| Argentina | |||
| Rest of South America | |||


Key Questions Answered in the Report
What is the current value of the utility markers market?
The market stands at USD 380 million in 2025 and is forecast to reach USD 530 million by 2030.
Which product type commands the largest share today?
Underground warning tape leads with 36.82% revenue share in 2024.
Which segment is growing fastest?
Electronic/RFID markers exhibit the highest 7.67% CAGR through 2030.
Why is Asia-Pacific the quickest-growing region?
Massive infrastructure programs in China and India combined with 5G rollouts lift Asia-Pacific to a 6.97% CAGR.
How are stricter penalties influencing demand?
Higher fines for strike incidents incentivize utilities to invest in compliant markers, directly boosting order volume.
What materials trend is shaping future demand?
Fiberglass and composite markers are gaining ground thanks to superior durability and lower life-cycle cost.
Page last updated on:


