Market Overview
| Study Period | 2020 - 2031 |
|---|---|
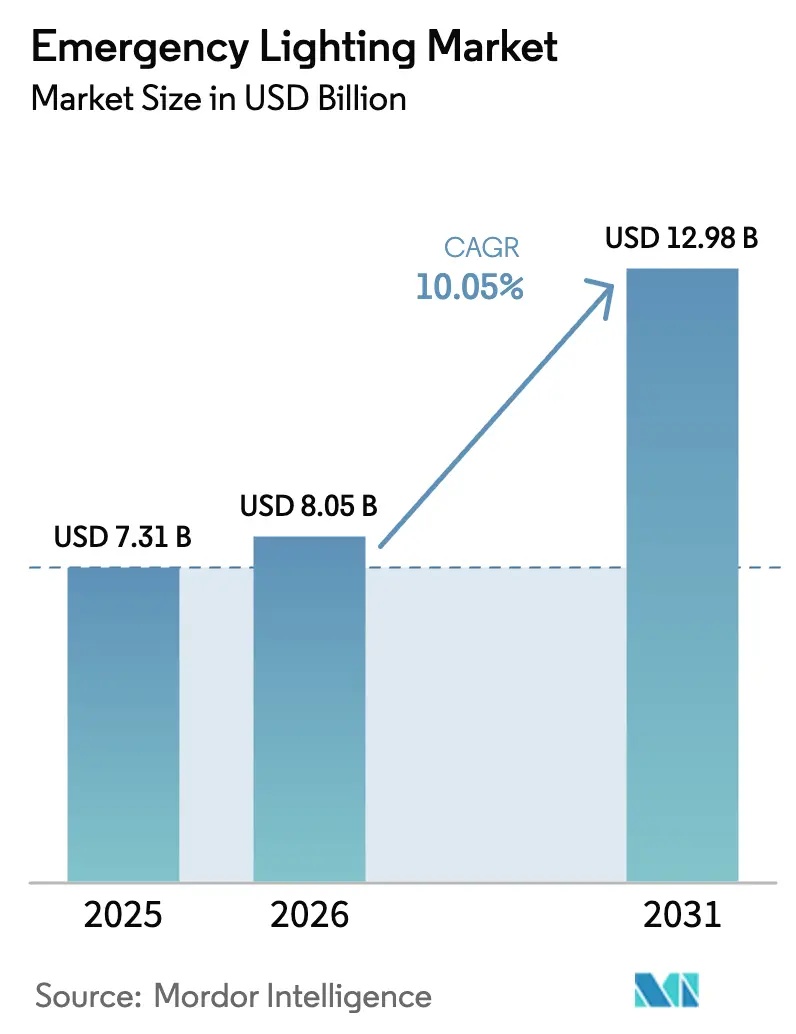
| Market Size (2026) | USD 8.05 Billion |
| Market Size (2031) | USD 12.98 Billion |
| Growth Rate (2026 - 2031) | 10.05% CAGR |
| Fastest Growing Market | Middle East and Africa |
| Largest Market | Asia Pacific |
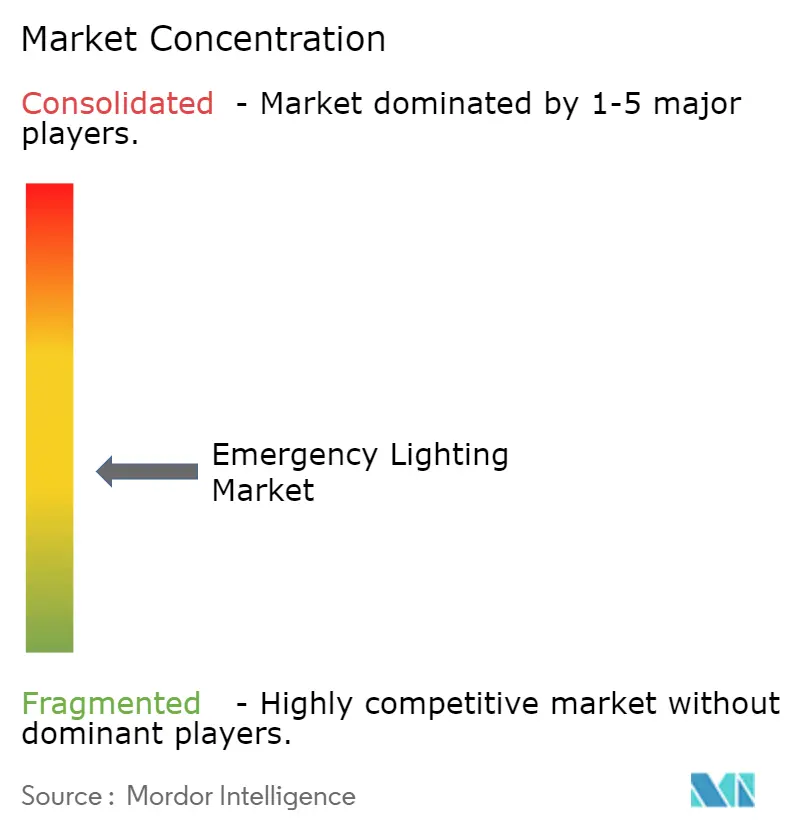
| Market Concentration | Medium |
Major Players *Disclaimer: Major Players sorted in no particular order Image © Mordor Intelligence. Reuse requires attribution under CC BY 4.0. | |
Emergency Lighting Market Analysis by Mordor Intelligence
The emergency lighting market size was valued at USD 7.31 billion in 2025 and estimated to grow from USD 8.05 billion in 2026 to reach USD 12.98 billion by 2031, at a CAGR of 10.05% during the forecast period (2026-2031). The expansion is propelled by stringent life-safety codes, retrofits tied to green-building targets, and smart-lighting technologies that provide automated testing and remote monitoring. LED conversion remains the largest upgrade driver, while wireless connectivity lowers installation costs for existing buildings. Infrastructure investments in tunnels, airports, and data centers further accelerate demand, especially in Asia-Pacific and the Middle East. Competitive dynamics favor brands that pair hardware with cloud-based diagnostics, allowing facility managers to oversee thousands of devices from a single dashboard.[1]International Code Council, “Fire Code, 2024 (IFC 2024),” UpCodes, up.codes
Key Report Takeaways
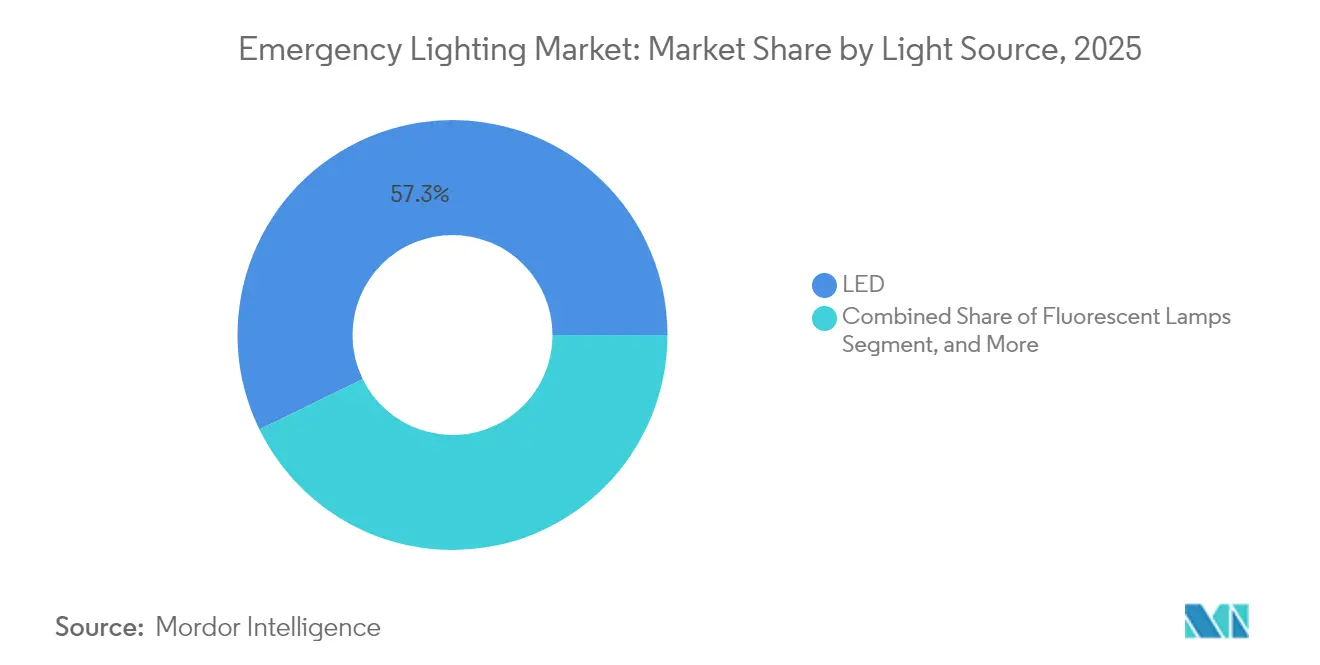
- By light source, LED held 57.25% of emergency lighting market share in 2025; wireless/IoT-enabled systems are expected to expand at a 13.02% CAGR to 2031.
- By power system, self-contained solutions accounted for 65.05% share of the emergency lighting market size in 2025, while centralized battery systems advance at an 11.12% CAGR through 2031.
- By installation type, surface-mounted units dominated with 46.12% revenue share in 2025; recessed fixtures are projected to grow at a 10.18% CAGR to 2031.
- By communication, wired products retained 81.55% share in 2025, but wireless alternatives will record the fastest growth at 13.02% through 2031.
- By end user, commercial offices led with 27.65% of emergency lighting market share in 2025; public infrastructure segments are forecast to post an 11.33% CAGR through 2031.
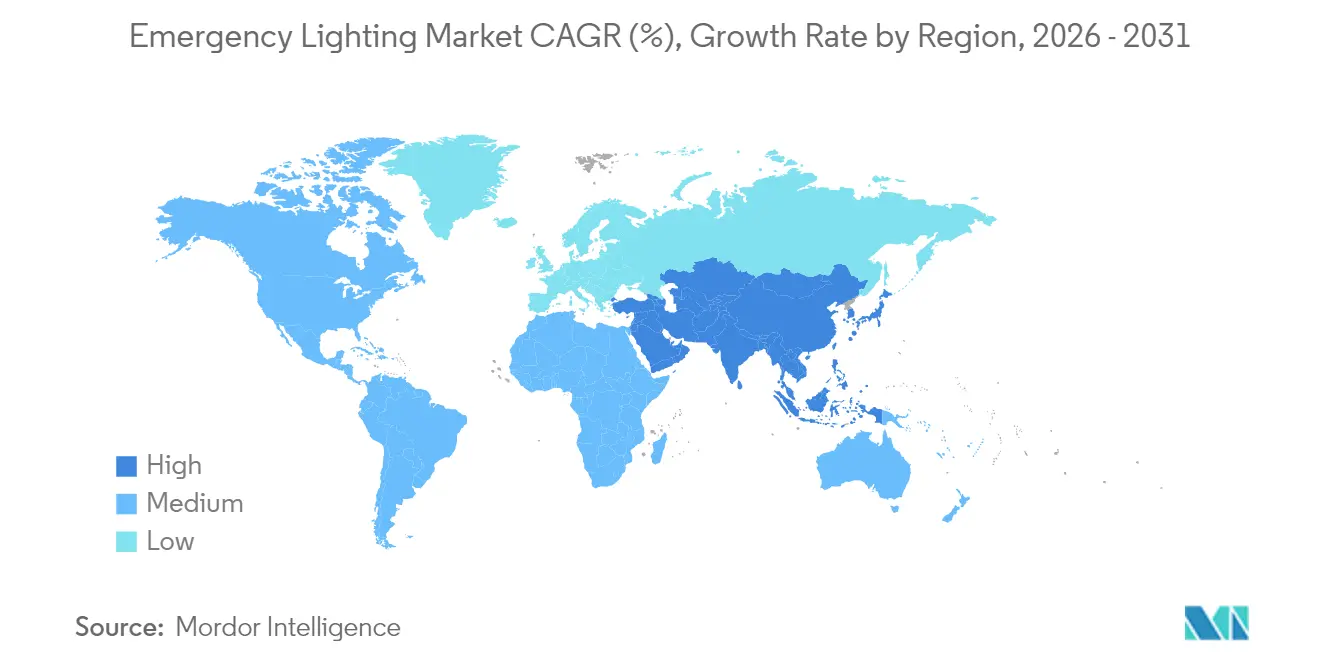
- By geography, Asia-Pacific captured 33.85% of the emergency lighting market in 2025; the Middle East and Africa region is poised for the highest 10.74% CAGR through 2031.
Note: Market size and forecast figures in this report are generated using Mordor Intelligence’s proprietary estimation framework, updated with the latest available data and insights as of 2026.
Global Emergency Lighting Market Trends and Insights
Drivers Impact Analysis*
| Driver | (~) (%) Impact on CAGR Forecast | Geographic Relevance | Impact Timeline |
|---|---|---|---|
| Smart LED retrofits across European public infrastructure | +1.8% | Europe → North America | Medium term (2-4 years) |
| Stricter U.S. IBC/NFPA 101 mandates for high-rises | +2.1% | North America → APAC | Short term (≤ 2 years) |
| Urban rail-tunnel build-outs in China and India | +1.5% | Asia-Pacific | Long term (≥ 4 years) |
| Data-center boom adopting centralized battery systems | +1.9% | North America & EU → APAC | Medium term (2-4 years) |
| ESG-linked LED exit-sign upgrades | +1.2% | Global developed markets | Long term (≥ 4 years) |
| Offshore platform investments in the Middle East | +0.7% | Middle East, North Sea | Medium term (2-4 years) |
| Source: Mordor Intelligence | |||
Smart LED retrofits across European public infrastructure
European municipalities are replacing fluorescent fixtures with networked LED luminaires that cut energy consumption by up to 50% while simplifying compliance reporting. The EU Green Deal pushes public buildings to reach carbon neutrality by 2030, and connected fixtures automatically send test logs to facility dashboards, trimming maintenance labor. Acuity Brands’ STAR Gateway illustrates how automated audits meet EN 50172 requirements, making smart LEDs the default choice for rail stations, schools, and government offices.[2]Acuity Brands, “Emergency Lighting Testing with STAR,” acuitybrands.com
Stricter U.S. IBC/NFPA 101 mandates for high-rises
The 2024 code cycle raises minimum egress illuminance to 1.07 lux for 90 minutes and cuts activation time to 10 seconds. Many legacy nickel-cadmium units cannot pass updated UL 924 tests that now require a “normal-power present” signal, compelling owners to replace equipment ahead of recertification deadlines. Federal facilities add another layer of pressure by specifying LED systems with integrated controls to meet GSA energy targets.[3]U.S. General Services Administration, “LED Lighting and Controls Guidance for Federal Buildings,” gsa.gov
Urban rail-tunnel build-outs in China and India
Metro systems in Beijing, Mumbai, and new Tier-2 cities demand IP67-rated, vibration-resistant luminaires capable of operating during single-point failures. Funding from multilaterals such as the Asian Development Bank underpins dozens of projects, each requiring kilometers of emergency fixtures that interface with SCADA platforms.[4]Asian Development Bank, “ADB to Help Nepal Upgrade Electricity Transmission and Distribution Infrastructure,” adb.org Manufacturers with turnkey tunnel packages and regional testing expertise gain a clear edge.
Data-center boom adopting centralized battery systems
Hyperscale operators favor central inverters tied to the building-wide UPS so that one bank of batteries can serve thousands of heads. Eaton’s acquisition of Fibrebond gives it prefab enclosures that combine power conversion, controls, and fire suppression, shortening deployment schedules for cloud campuses. The trend also spurs interest in lithium-ion alternatives such as hydrogen fuel cells, which demand luminaires that ride through fuel-cell “warm-up” phases.[5]Eaton, “Eaton Emergency Lighting UPS,” eaton.com
Restraints Impact Analysis*
| Restraint | (~) (%) Impact on CAGR Forecast | Geographic Relevance | Impact Timeline |
|---|---|---|---|
| Lithium-ion fire-safety concerns in healthcare | -1.4% | Global developed markets | Short term (≤ 2 years) |
| Supply-chain crunch for IC drivers & optics | -1.1% | Global, notably APAC | Medium term (2-4 years) |
| Fragmented standards across ASEAN | -0.8% | ASEAN emerging | Long term (≥ 4 years) |
| High install/test cost for wireless systems | -0.9% | Global price-sensitive | Medium term (2-4 years) |
| Source: Mordor Intelligence | |||
Lithium-ion fire-safety concerns in healthcare facilities
Hospitals are delaying lithium-ion rollouts after thermal-runaway incidents that led to ward evacuations. NFPA is drafting NFPA 800 to govern on-site storage, but until finalized, many health networks stay with sealed lead-acid or nickel-metal hydride packs despite shorter life. Proposed U.S. legislation to codify national battery safety standards adds further uncertainty.
Supply-chain crunch for IC drivers and optics
Component shortages that began in 2023 still linger, particularly for RF chipsets used in addressable luminaires. Vendors have re-engineered boards to accept multi-source parts, but re-qualification with UL and CE adds cost and delays. Limited availability keeps wireless SKUs on allocation, slowing the highest-growth slice of the emergency lighting market.
*Our forecasts treat driver/restraint impacts as directional, not additive. The impact forecasts reflect baseline growth, mix effects, and variable interactions.
Segment Analysis
By Light Source: LED Dominance Faces Technology Transition
LED devices controlled 57.25% of emergency lighting market share in 2025, and the segment is set to advance at a 9.54% CAGR through 2031. Fluorescent tubes linger in older buildings, yet rising energy tariffs and lamp bans speed replacement schedules. Niche high-intensity discharge units remain in petrochemical zones where 10 kV surge immunity takes precedence over efficacy.
Smart diodes now embed sensors, memory, and selectable color temperatures, exemplified by the Green Creative Universal CCT Select tube, which helps specifiers tailor glare levels without swapping hardware. This convergence of intelligence with illumination keeps LED systems as the anchor of the emergency lighting market, even as wireless protocols reshape product line roadmaps.


By Power System: Centralized Systems Gain Infrastructure Traction
Self-contained packs represented 65.05% of emergency lighting market size in 2025, thanks to straightforward installation and unitized maintenance. Large venues, however, prefer central banks to cut room-by-room battery checks. Data centers exemplify the shift, with centralized racks ensuring all fixtures receive conditioned power and firmware updates from a single hub.
Eaton’s inverter platforms, soon incorporating Exertherm thermal analytics, highlight how predictive monitoring reduces unscheduled downtime. Lithium-ion strings deliver long cycle life, yet hospitals and airports still specify VRLA in critical zones until regulatory clarity improves. The split between autonomy and central command will define procurement choices over the forecast horizon.
By Installation Type: Recessed Systems Drive Aesthetic Integration
Surface-mounted housings remained the go-to retrofit option, but architects increasingly select recessed troffers that sit flush with modern ceiling grids. Growth of 10.18% CAGR stems from high-end offices, hotels, and museums where design language prizes unobtrusive hardware.
Wireless mesh controls allow recessed heads to self-commission, avoiding new conduit pulls. As building owners chase LEED v5 credits tied to lighting power density, recessed LED kits that double as both normal and emergency circuits reduce fixture counts, strengthening their value proposition across the emergency lighting market.
By Product: Combo Units Lead Innovation Integration
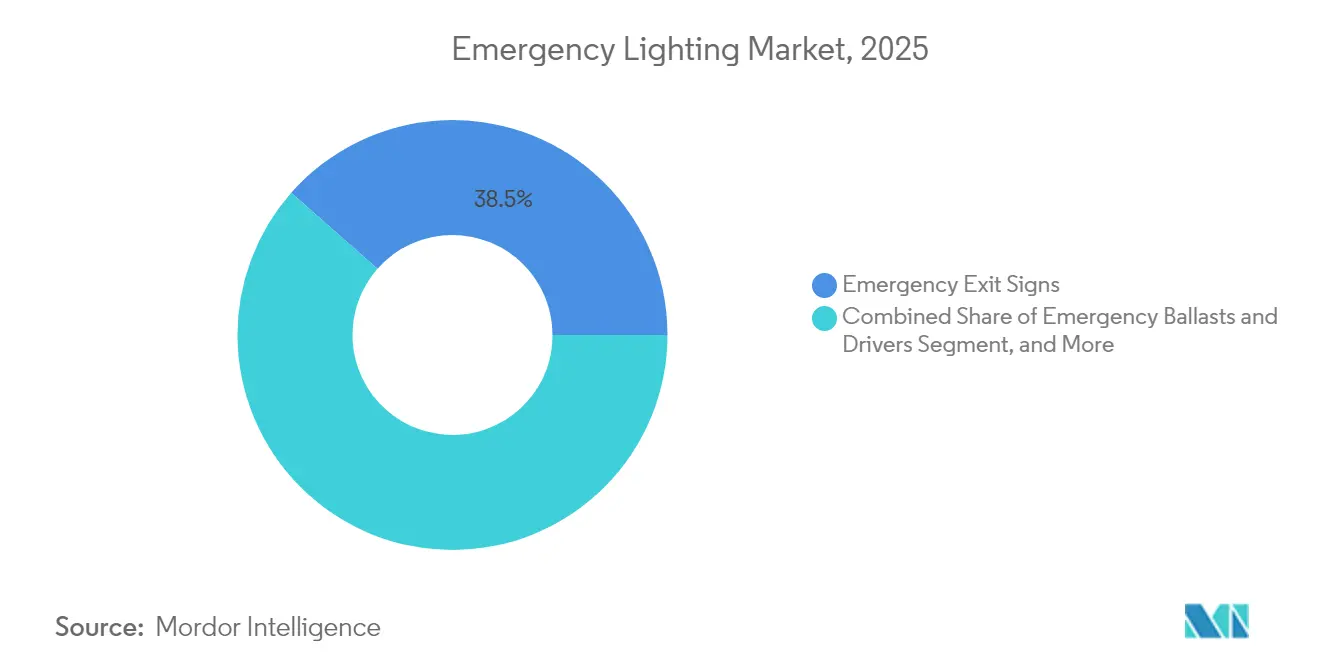
Exit signs alone delivered 38.50% of 2025 revenues, yet combo units-packing both pictograms and twin floodlights-are edging ahead with an 11.22% growth rate. They slash wiring steps and shrink SKU counts for contractors. Addressable variants auto-test each circuit, logging results for inspectors and trimming walkthrough time.
Stand-alone luminaires still shine in warehouses where 1,000 lumen beams must clear tall racks. In contrast, emergency ballasts attract projects that cannot justify fixture swaps, letting owners insert a driver into an existing troffer to meet code. The shift toward “all-in-one” hardware underscores how feature density is becoming the new battleground in the emergency lighting market.
By Communication: Wireless Systems Transform Facility Management
Hard-wired networks made up 81.55% of shipments during 2025, but wireless LoRaWAN, BLE, and proprietary RF are now the focal point for R&D. A 13.02% CAGR through 2031 is forecast as universities, housing authorities, and airports approve RF links that cut labor hours by 30%.
The landmark deployment of 10,000 LoRa-equipped units in Singapore public housing proves long-range, low-power tech can manage life-safety devices at city scale. ABB’s Naveo Pro mobile app lets technicians verify discharge tests from a smartphone, signaling how digital workflows will dominate procurement discussions within the emergency lighting market.
By End User: Public Infrastructure Drives Highest Growth
Commercial offices accounted for 27.65% of global revenues in 2025, driven by dense urban high-rises. Yet airports, tunnels, and rail platforms form the fastest-moving slice, supported by sovereign stimulus across Asia-Pacific. Here, photometric uniformity and vibration resistance weigh more heavily than aesthetics, opening space for ruggedized SKUs.
Healthcare adoption remains tempered by battery-fire fears, while warehouses seek high-candela beams for rack clarity. Residential smart-home packages start to feature micro-inverters feeding ceiling cans, hinting at future consumer interest once code bodies address single-family requirements.
Geography Analysis
Asia-Pacific, with a 33.85% stake in the emergency lighting market, benefits from megaprojects such as Mumbai Metro Line 3 and Beijing Sub-Center Tunnel. Regional governments use concessional loans from institutions like ADB to electrify outlying provinces, ensuring every new substation or rail spur specifies compliant luminaires. Semiconductor shortages make scheduling tricky, but local PCB houses in Shenzhen and Penang shorten lead times for domestic vendors.
The Middle East and Africa will register a 10.74% CAGR through 2031 as Qatar extends LNG export hubs and Saudi Vision 2030 accelerates tourism corridors. Offshore rigs in the Gulf demand copper-free aluminum bodies that survive salt-spray and 60 °C highs. Chalmit-branded Protecta X fixtures in North Sea fields validate 120,000-hour lifespans, encouraging NOCs to budget for premium solutions.
North America and Europe offer steady replacement cycles. U.S. code revisions now force high-rise landlords to upgrade within recertification windows, bolstering retrofit volumes. Europe’s Renovation Wave funnels grants toward public-sector LED swaps, with Germany underwriting smart controls that shave carbon footprints ahead of 2030 targets. Mature buyers favor vendors that bundle analytics dashboards with hardware, elevating software maintenance contracts as a vital slice of the emergency lighting market.

Competitive Landscape
Market rivalry centers on technology layers more than manufacturing scale. Acuity Brands links up to 20,000 heads through its STAR Gateway, providing cloud reporting that eases NFPA audits. Eaton folds Fibrebond’s prefabricated shelters into its offer, giving hyperscale data-center clients a single-vendor path from UPS to luminaire. Signify reorganized into vertical business units, allowing its connected-lighting arm to court transport authorities separately from consumer channels.
Private-equity exits underscore structural shifts: Hubbell sold Progress Lighting to Kingswood Capital and kept only hazardous-area brand Chalmit, reflecting a tilt toward specialized niches. Smaller European firms carve space in tunnel or maritime segments where EN 60598-2-22 tests require custom optics. The top five vendors collectively hold under 30% of global revenue, keeping the emergency lighting market moderately fragmented and innovation-driven.
Emergency Lighting Industry Leaders
Emerson Electric Co.
Schneider Electric
Hubbell Lighting Inc.
Legrand SA
Eaton Corp. plc
- *Disclaimer: Major Players sorted in no particular order

Recent Industry Developments
- March 2025: Eaton agreed to acquire Fibrebond Corporation for USD 1.4 billion, adding modular power enclosures aimed at cloud and colocation data centers.
- March 2025: Schneider Electric announced a USD 700 million U.S. expansion plan through 2027 to support automation and AI-driven energy loads.
- December 2024: Eaton previewed EV-charging and smart-home lighting at CES 2025.
- November 2024: ADB approved a USD 200 million loan to upgrade Sri Lanka’s grid, improving emergency-lighting readiness.


Research Methodology Framework and Report Scope
Market Definitions and Key Coverage
Mordor Intelligence defines the emergency lighting market as every hard-wired or self-contained luminaire, exit sign, power pack, and monitoring module that switches to battery or generator supply when normal mains fail and is permanently installed in commercial, industrial, public-infrastructure, and large residential buildings worldwide. Revenues are recorded at manufacturer selling price and expressed in USD for the calendar year 2025.
Scope exclusion: portable flashlights, vehicle lighting, and ad-hoc rental units are outside this study.
Segmentation Overview
- By Light Source
- LED
- Fluorescent Lamps
- High-Intensity Discharge (HID)
- Induction and Others
- By Power System
- Self-Contained/Battery-Backup
- Central Battery (UPS)
- Hybrid/Distributed
- By Installation Type
- Surface-Mounted
- Recessed
- Suspended
- Portable
- By Product
- Emergency Exit Signs
- Stand-alone Emergency Luminaires
- Combo Units
- Emergency Ballasts and Drivers
- By Communication
- Wired
- Wireless/IoT-Enabled
- By End-user
- Commercial - Offices
- Commercial - Hospitality and Retail
- Industrial -Manufacturing and Warehouses
- Oil and Gas/Mining
- Residential
- Public Infrastructure (Airports, Tunnels, Rail)
- Healthcare Facilities
- By Geography
- North America
- United States
- Canada
- Mexico
- Europe
- Germany
- United Kingdom
- France
- Nordics
- Rest of Europe
- South America
- Brazil
- Rest of South America
- Asia-Pacific
- China
- Japan
- India
- South-East Asia
- Rest of Asia-Pacific
- Middle East and Africa
- Middle East
- Gulf Cooperation Council Countries
- Turkey
- Rest of Middle East
- Africa
- South Africa
- Rest of Africa
- Middle East
- North America
Detailed Research Methodology and Data Validation
Primary Research
Interviews with facility managers, fire-safety inspectors, regional distributors, and component engineers across North America, Europe, Asia-Pacific, and the Gulf validated density assumptions, confirmed LED penetration rates, and provided the latest average selling prices for battery-backup luminaires and exit signs.
Desk Research
Our analysts first mapped the regulatory backbone: NFPA 70/101, International Building Code, EN 1838, and IEC 60598; then extracted fixture density norms, test schedules, and retrofit triggers from government gazettes and safety-code commentaries. Construction floor-area data from sources such as the US Census Bureau, Eurostat Building Permits, and China's NBS, together with trade statistics from UN Comtrade, helped size the installed base. Company 10-Ks, listed-supplier catalogs, and press releases were screened through D&B Hoovers and Dow Jones Factiva for typical price points and shipment mixes. These sources illustrate, not exhaust, the reference pool consulted.
Market-Sizing & Forecasting
We began with a top-down model. Commercial and industrial floor space by region was multiplied by mandatory fixture density, adjusted for code-compliant retrofit cycles and LED conversion share. Results were corroborated with selective bottom-up checks using sampled OEM shipment volumes and ASPs gathered during primary calls. Key variables feeding the model include new-build completions, retrofit subsidy budgets, LED price erosion, battery cost curve, and code adoption timelines. A multivariate regression links these drivers to historical demand and produces the 2025-2030 forecast. Scenario analysis around construction slowdowns supplies sensitivity bounds.
Data Validation & Update Cycle
Outputs pass two analyst reviews, outlier diagnostics, and year-on-year variance checks against independent indicators such as lithium battery shipments and LED package sales. The dataset refreshes annually, with interim revisions triggered by material regulatory or pricing shifts, before final release to clients.
Why Mordor's Emergency Lighting Baseline Commands Confidence
Published figures often diverge because each researcher selects different product baskets, conversion currencies, and refresh cadences. We acknowledge those differences upfront and preview the common gap drivers.
Key gap drivers include inclusion of portable lamps by some publishers, use of 2024 exchange rates without rebasing, one-time supplier surveys that miss LED price drops, and shorter refresh cycles that overstate growth during construction booms.
Benchmark comparison
| Market Size | Anonymized source | Primary gap driver |
|---|---|---|
| USD 7.31 B (2025) | Mordor Intelligence | - |
| USD 7.27 B (2024) | Global Consultancy A | Older base year and exclusion of combo units |
| USD 7.71 B (2024) | Industry Journal B | Includes portable lanterns and smart-home nodes |
In sum, Mordor's step-wise model, anchored to verifiable floor-space data and continuously refreshed price inputs, delivers a balanced, transparent baseline that decision-makers can trace, replicate, and trust.


Key Questions Answered in the Report
What is the current size of the emergency lighting market?
The market is valued at USD 8.05 billion in 2026 and is projected to reach USD 12.98 billion by 2031.
Which region dominates the emergency lighting market?
Asia-Pacific holds the largest 33.85% regional share, thanks to aggressive infrastructure development.
What technology segment is growing the fastest?
Wireless/IoT-enabled emergency lighting is forecast to grow at a 13.02% CAGR through 2031, the highest among all segments.
Why are healthcare facilities cautious about lithium-ion batteries?
Documented thermal-runaway incidents and pending NFPA 800 guidelines have raised fire-safety concerns, slowing adoption in hospitals
How do new U.S. building codes affect market demand?
The 2024 IBC and NFPA 101 updates require quicker activation and higher illuminance, prompting immediate retrofits of non-compliant systems.
What role do data centers play in future demand?
Rapid data-center construction favors centralized battery systems with remote diagnostics, adding a positive 1.9% impact to overall CAGR.
Page last updated on:


