Lighting Market Size and Share
Market Overview
| Study Period | 2020 - 2031 |
|---|---|
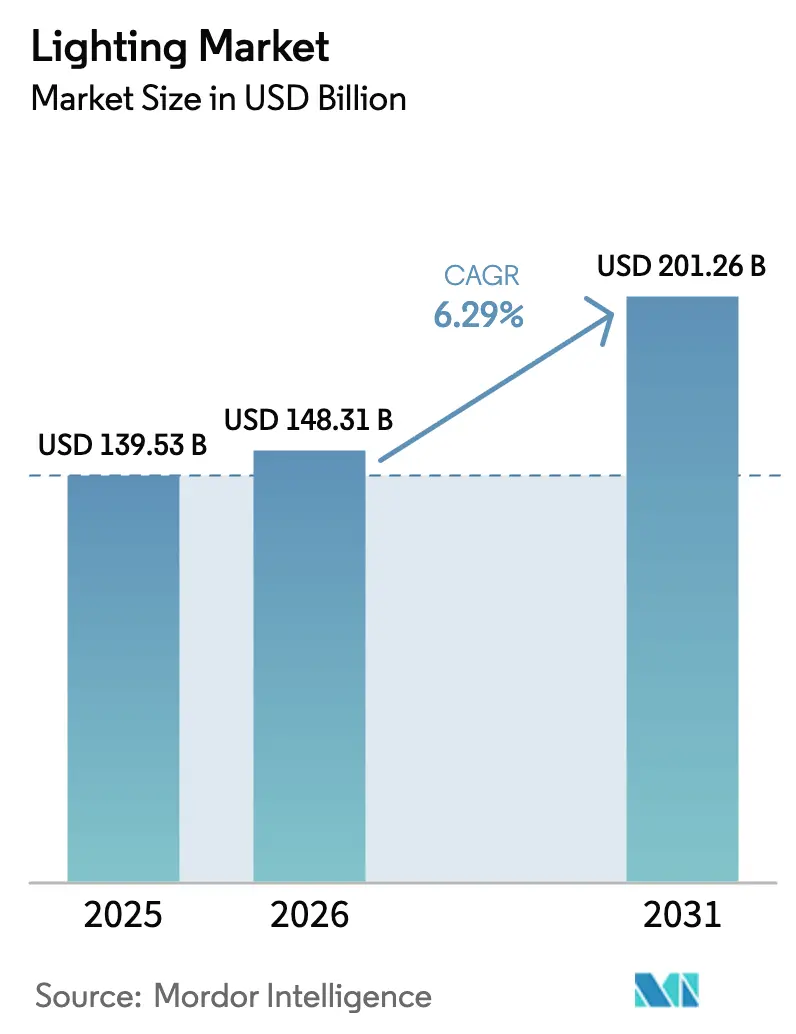
| Market Size (2026) | USD 148.31 Billion |
| Market Size (2031) | USD 201.26 Billion |
| Growth Rate (2026 - 2031) | 6.29% CAGR |
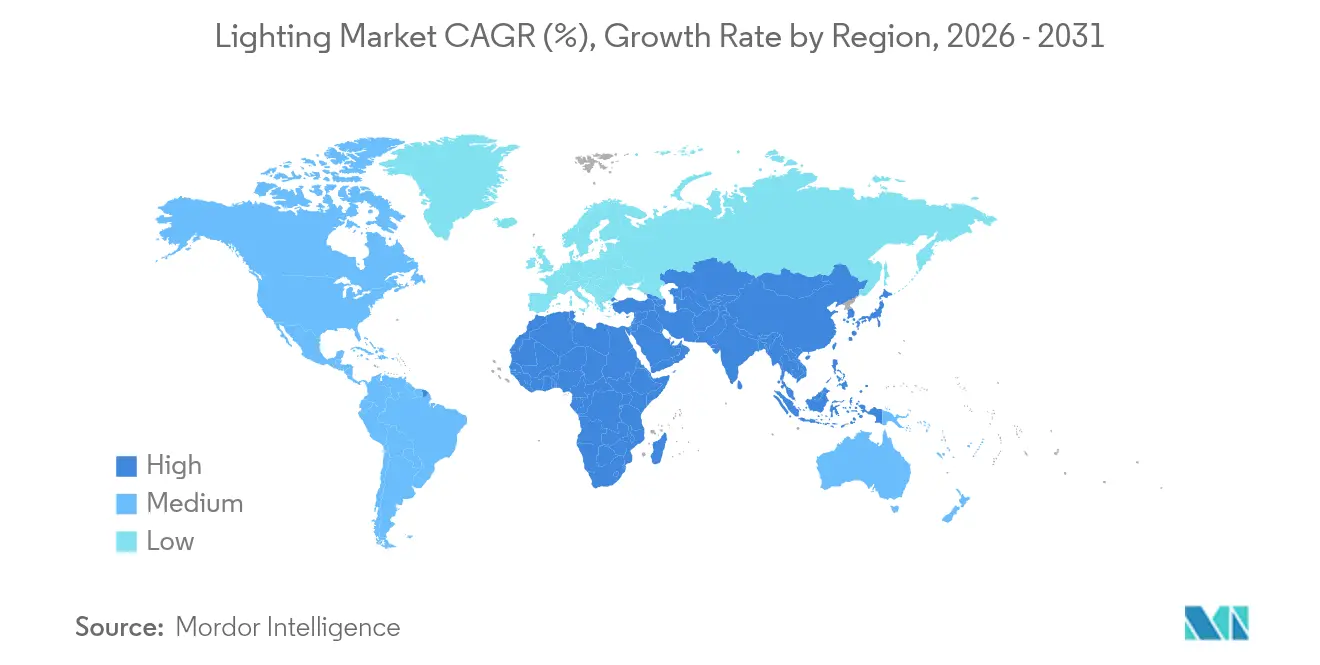
| Fastest Growing Market | Middle East and Africa |
| Largest Market | Asia Pacific |
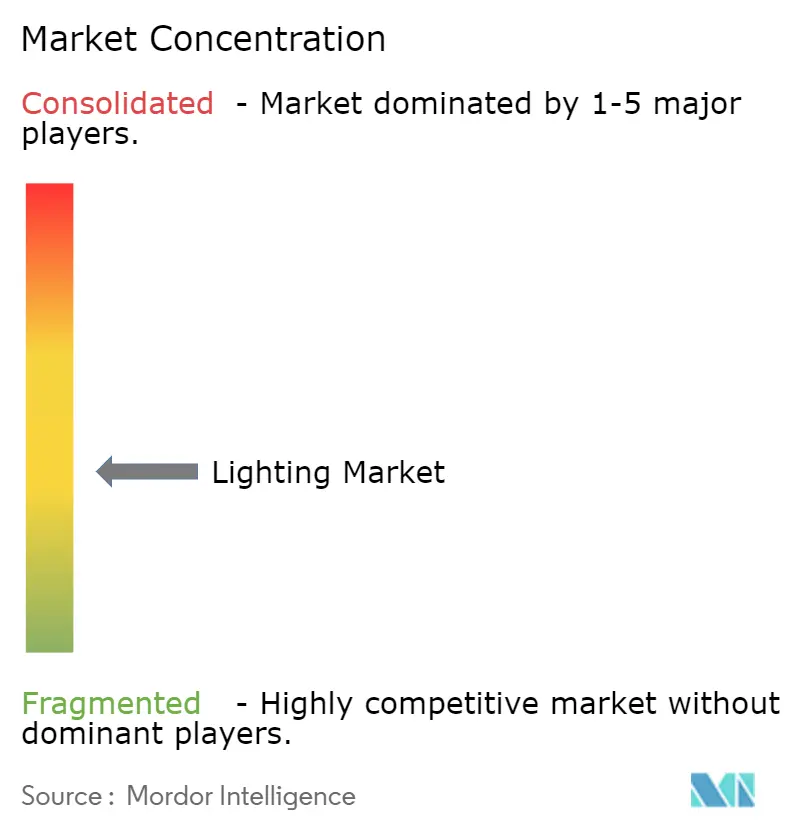
| Market Concentration | Medium |
Major Players *Disclaimer: Major Players sorted in no particular order Image © Mordor Intelligence. Reuse requires attribution under CC BY 4.0. | |
Lighting Market Analysis by Mordor Intelligence
The lighting market size is expected to grow from USD 139.53 billion in 2025 to USD 148.31 billion in 2026 and is forecast to reach USD 201.26 billion by 2031 at 6.29% CAGR over 2026-2031. The growth reflects an accelerating shift from legacy lamps to energy-efficient LEDs as governments tighten mercury and ecodesign rules, building owners chase lower energy bills, and post-pandemic retrofits unlock pent-up demand. LED secondary-replacement volumes reached 5.8 billion units in 2024, signaling a robust repeat-purchase cycle that will support both component suppliers and fixture makers through 2028. Asia-Pacific anchors demand with large-scale schemes such as India’s UJALA, while GCC smart-city budgets, North American warehouse automation, and European fluorescent bans collectively reinforce the technology transition. Competitive intensity is rising as leading vendors deepen vertical integration, defend patents, and localize production to secure margin in a price-sensitive yet specification-driven lighting market.
Key Report Takeaways
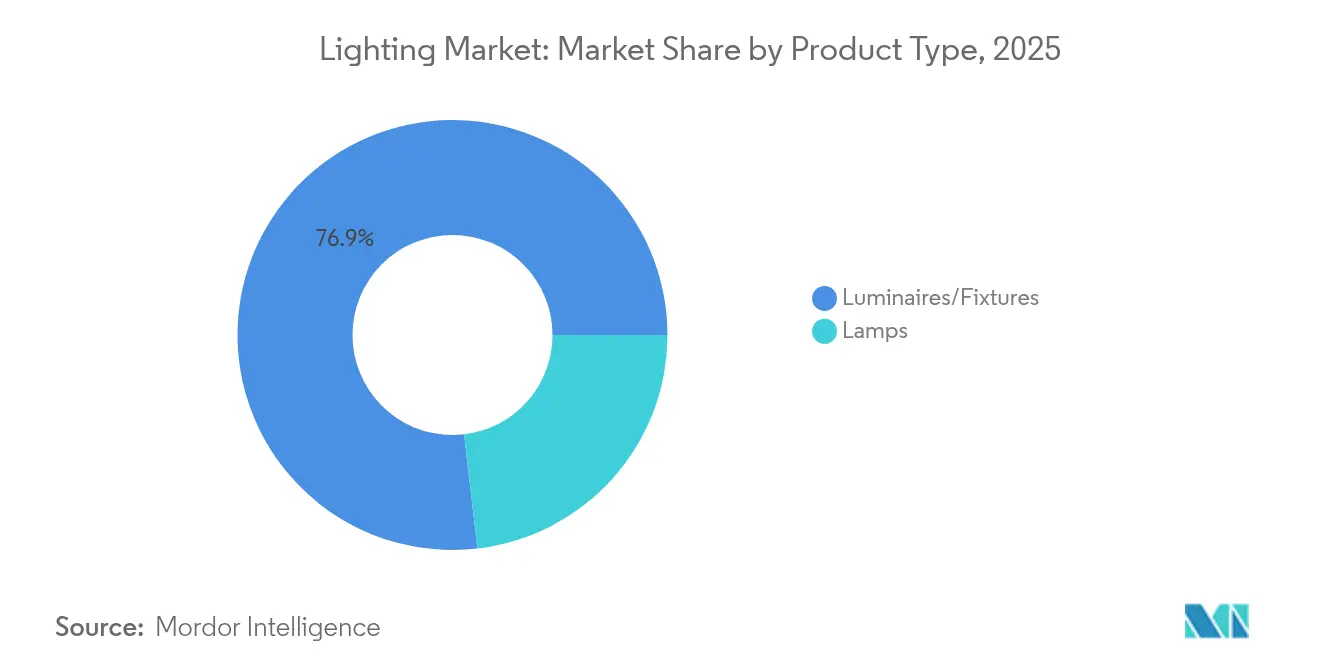
- By product type, luminaires and fixtures led with 76.85% revenue share in 2025; lamps and retrofit kits are projected to grow at a 6.21% CAGR through 2031.
- By light source, LED technology captured 68.95% of the lighting market share in 2025 and is forecast to expand at a 6.25% CAGR to 2031.
- By application, residential lighting accounted for 31.10% of the lighting market size in 2025, while horticulture and agricultural lighting is advancing at an 7.98% CAGR between 2026-2031.
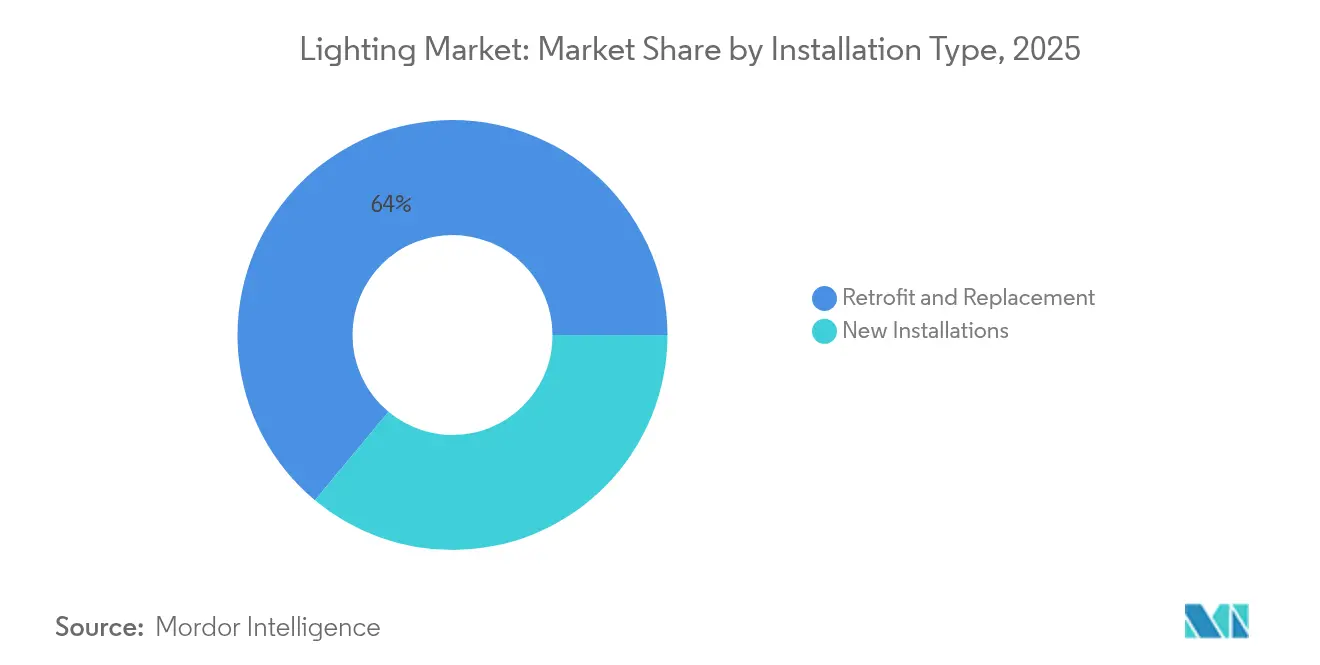
- By installation, retrofit projects held 63.95% share of the lighting market size in 2025; new-build installations are growing faster at 6.92% CAGR.
- By geography, Asia-Pacific dominated with 46.55% share in 2025; the Middle East & Africa region is the fastest-growing at a 6.64% CAGR to 2031.
Note: Market size and forecast figures in this report are generated using Mordor Intelligence’s proprietary estimation framework, updated with the latest available data and insights as of 2026.
Global Lighting Market Trends and Insights
Drivers Impact Analysis*
| Driver | (~) % Impact on CAGR Forecast | Geographic Relevance | Impact Timeline |
|---|---|---|---|
| Surge in post-COVID retrofit demand for LED lamps and luminaires across Asia | +1.2% | Asia-Pacific core, spill-over to MEA | Medium term (2-4 years) |
| Smart-city roll-outs accelerating connected street-lighting in GCC | +0.8% | Middle East | Long term (≥ 4 years) |
| Rapid warehouse automation driving high-bay LED adoption | +0.7% | North America & EU | Medium term (2-4 years) |
| EU Ecodesign Regulation phasing out fluorescents | +1.1% | Europe, global supply chain | Short term (≤ 2 years) |
| Agricultural export policies fueling horticultural lighting | +0.4% | Europe & Asia-Pacific | Long term (≥ 4 years) |
| India’s UJALA II scheme extending LED penetration in rural areas | +0.6% | India | Medium term (2-4 years) |
| Source: Mordor Intelligence | |||
Surge in Post-COVID Retrofit Demand for LED Lamps and Luminaires across Asia
Recent retrofit programs have created unprecedented pull in the lighting market as first-generation LEDs near end-of-life. Global secondary-replacement volumes hit 5.8 billion units in 2024, contributing to overall demand of 13.4 billion units. India’s UJALA reduced bulb prices to INR 70-80, proving that large-lot procurement can expand access while preserving manufacturer profitability.[1]Press Information Bureau, “UJALA Completes Seven Years of Energy-Efficient LED Distribution,” pib.gov.in Commercial property owners are now upgrading fluorescent troffers and HID high-bays to comply with mercury restrictions. Quality differentiation is widening; buyers compare lumen-maintenance and warranty terms more closely, benefiting brands that demonstrate total-cost-of-ownership gains. The sustained retrofit wave secures a baseline growth buffer for the lighting market during macro-economic swings.
Smart-City Roll-outs Accelerating Connected Street-Lighting Deployments in Gulf Cooperation Council Countries
GCC utilities treat connected luminaires as the digital backbone for urban services. Dubai’s USD 1.9 billion automatic smart-grid restoration system integrates adaptive street-lighting to cut losses and support the emirate’s 100% clean-energy vision.[2]TradeArabia News Service, “Dewa Launches Automatic Smart Grid Restoration System,” tradearabia.com Abu Dhabi’s municipal pilot shows 40-50% energy savings after replacing legacy poles with IoT-enabled LEDs. Integrated nodes host traffic counters, air-quality probes, and 5G small-cells, turning lighting furniture into real-time data hubs. Demonstration projects encourage neighboring cities to launch copy-cat tenders, widening the lighting market for controls, gateways, and cybersecurity services. Government guarantees also mitigate counterparty risk, making GCC infrastructure a coveted beachhead for global vendors.
Rapid Warehouse Automation Driving High-Bay LED Adoption in North America
Lighting consumes up to 76% of energy in conventional warehouses, so operators bundle LED retrofits with robotics and vertical-racking investments to hit payback targets.[3]Food Logistics, “Keep the Lid on Warehouse Energy Costs,” foodlogistics.com Cases such as Kane Is Able show annual savings beyond 2 million kWh after high-bay conversions. Networked luminaires now link to warehouse-management software, dimming by zone when conveyors idle and brightening around automated picking arms to improve scan accuracy. The synergy between improved ergonomics and machine-vision performance further justifies premium fixture choices. Utilities across several U.S. states broadened rebate tiers in 2025, cutting installed costs by 15-20% and keeping the lighting market for high-bays resilient despite interest-rate pressures.
EU Ecodesign Regulation (EU) 2019/2020 Phasing-out Fluorescents
The fluorescent sunset has moved faster than the legal deadline because major lamp plants shuttered lines in advance to avoid stranded inventories. Retailers report LEDs capturing more than 95% of shelf space by mid-2025, and early adopters cite three-month payback periods in office retrofits. The regulation’s spill-over effect simplifies global portfolios; multinationals now design around LED only, lowering bill-of-materials through volume. Professional specifiers, however, flag color-matching concerns for graphics-critical environments, steering demand toward higher-end LED modules with tight CIE tolerance. Overall, the rule adds roughly 1.1 percentage points to the lighting market CAGR through 2027.
Restraints Impact Analysis*
| Restraint | (~) % Impact on CAGR Forecast | Geographic Relevance | Impact Timeline |
|---|---|---|---|
| Slow-moving building permits dampening new fixture sales in Germany | -0.9% | Europe, Germany focus | Medium term (2-4 years) |
| Lithium-ion price volatility inflating smart-solar lighting costs in Africa | -0.5% | Africa | Short term (≤ 2 years) |
| IP-driven patent litigation increasing compliance costs for OEMs in U.S. | -0.4% | North America | Long term (≥ 4 years) |
| Counterfeit LED imports undermining branded margins in LATAM | -0.3% | Latin America | Medium term (2-4 years) |
| Source: Mordor Intelligence | |||
Slow-Moving Building Permits Dampening New Fixture Sales in Germany
German dwelling permits fell to 15,357 in April 2025, far below the pre-pandemic norm of around 20,000 units.[4]Trading Economics, “Germany Building Permits for New Dwellings,” tradingeconomics.com Residential permits dived 38.65% year-on-year, and industry associations foresee a further 5% revenue slide in 2025. Each permit shortfall directly erodes fixture volumes because new construction specifies integrated luminaires upfront. Developers delay projects as mortgage rates hold near decade highs, and government targets of 400,000 new homes appear out of reach. For suppliers, Germany’s contraction partially offsets gains from retrofits in surrounding EU states, leaving the lighting market reliant on renovation rather than green-field growth during the medium term.
Lithium-Ion Price Volatility Inflating Smart-Solar Lighting Costs in Africa
Off-grid lighting schemes depend on affordable storage, yet battery pack prices oscillated 25–30% over 2024-2025 amid supply disruptions. Studies show hybrid street-lighting levelized costs of USD 0.106 /kWh when battery inputs are stable, but sensitivity analyses cut margins by half when cells spike. Ghana, Rwanda, and Morocco pivot toward recycling vehicle packs to buffer volatility, positioning themselves as regional hubs. Municipal buyers nonetheless defer tenders until price clarity returns, curbing near-term shipment growth even as long-term rural-electrification plans remain intact. Vendors serving the African lighting market therefore face lumpy order books and must re-price bids more frequently to protect cash flow.
*Our forecasts treat driver/restraint impacts as directional, not additive. The impact forecasts reflect baseline growth, mix effects, and variable interactions.
Segment Analysis
By Product Type: Fixtures Drive Market Evolution
Fixtures controlled 76.85% of revenue in 2025, anchoring the lighting market as customers migrate from bulb swaps to integrated systems. Ceiling panels, pendants, and downlights lead space productivity upgrades in offices and malls, while high-bay fixtures ride warehouse automation spending. Street-lighting poles embed wireless controllers to harvest energy data for utilities. Decorative fixtures capture niche value in hospitality, leveraging advanced optics to blend design with low glare. Lamps, still vital to price-sensitive retrofits, hold 23.15% share but are ceding mix as fixture-centric renovations gain traction. The fixture segment’s 6.21% CAGR underpins a sizable portion of the lighting market size outlook to 2031.
Growth is reinforced by modular designs that simplify maintenance. OEMs now ship plug-in LED boards, letting facility managers swap engines without rewiring. Controls-ready fixtures also shorten project timelines; specifying teams can lock in both hardware and software within a single bill of materials. Replacement of aging fluorescent troffers in Europe stands out as a multi-year volume engine, while smart-city pilots in the GCC spotlight LED poles as digital-service gateways. Competitive differentiation revolves around thermal management, color consistency, and sensor fusion capabilities that future-proof the asset base.


By Light Source: LED Transformation Accelerates
LED units accounted for 68.95% of revenues in 2025, and their 6.25% CAGR through 2031 secures the technology’s dominance. Post-fluorescent bans leave LEDs as the default lamp, and economies of scale cut cost per lumen annually. Chip-on-board advances lift efficacy past 220 lm/W, lowering overall system wattage. LED share is even higher in new builds, where designers specify tunable-white engines and human-centric lighting to support occupant wellness. Fluorescent and HID categories trend downward except in niche sports venues awaiting retrofit budgets.
OEM roadmaps prioritize spectral tailoring; horticultural fixtures now allow dynamic red-to-blue ratios that optimize photosynthesis for lettuce, strawberries, or cannabis. Medical imaging suites request high-CRI LEDs to preserve color fidelity. As supply consolidates, vendors harmonize form-factors for global compatibility, thereby making LED modules interchangeable across luminaires. The shift reduces spare-parts complexity and underpins a more service-oriented lighting market.
By Application: Residential Leads, Horticulture Surges
Residential spaces held 31.10% of revenue in 2025, driven by bulk LED bulb roll-outs under government subsidy schemes and an uptick in smart-home retrofits. Voice-controlled dimming and circadian presets elevate perceived value, encouraging multi-room upgrades rather than one-to-one bulb swaps. Meanwhile, horticulture lighting posts the fastest expansion at 7.98% CAGR, propelled by Dutch greenhouse exporters and vertical farms in Japan . Tailored spectra shorten crop cycles, allowing growers to stack harvests and justify premium electricity budgets.
Commercial offices follow hybrid-work schedules, so owners invest in occupancy-sensed luminaires that dynamically adjust output to desk utilization. Retail chains seek uniform color temperature across global branches to maintain brand consistency, opening recurring revenue for commissioning services. Industrial plants favor high-bay LEDs with rugged optics and advanced surge protection to withstand power fluctuations. Infrastructure categories such as smart streets add IoT nodes for traffic analytics, ensuring diversified demand pools across the lighting market.
By Installation Type: Retrofit Dominance Continues
Retrofit projects captured 63.95% of 2025 volumes as an aging installed base hits end-of-life. Payback often lands within two years because energy rates remain elevated. Facility managers time upgrades to coincide with HVAC overhauls to minimize downtime. The retrofit wave lifts demand for dimmable drivers and wireless-ready sockets that piggyback existing wiring. Installers prize tool-less connector systems that let crews finish jobs faster, thereby lowering labor costs and driving more bids.
New construction, though smaller, expands at 6.92% CAGR. Emerging-market megaprojects specify connected lighting in planning documents, baking IoT capability into electrical blueprints. Industrial parks in Southeast Asia and logistics hubs in the Middle East illustrate this trend, rewarding fixture makers that offer unified dashboards for lighting, HVAC, and security. Despite Germany’s permit slowdown, broader APAC growth sustains the installation-mix balance and shields the lighting market from regional shocks.
By Sales Channel: B2B Channels Dominate
Direct/project B2B routes owned 59.10% share in 2025, reflecting the consultative sale cycle where engineers, contractors, and ESCOs co-design solutions. Large projects often bundle commissioning and multi-year service, securing annuity revenue. Specification teams rely on vendor software that simulates lux curves and daylight offsets, cementing brand preference early. Distributors then fulfill bulk orders while maintaining credit terms for contractors.
E-commerce grows at 7.62% CAGR as smaller enterprises and homeowners embrace click-to-ship convenience. Marketplaces offer side-by-side specification filters, narrowing the knowledge gap once bridged by showrooms. Hybrid models emerge: customers research SKUs online, then schedule virtual calls with application engineers before finalizing baskets. Brick-and-mortar outlets pivot to experiential centers showcasing connected-home platforms, sustaining foot traffic without shouldering inventory risk. The evolving channel mix obliges manufacturers to harmonize pricing and warranty policies across online and offline touchpoints to safeguard brand equity in the lighting market.
Geography Analysis
Asia-Pacific’s 46.55% slice of 2025 revenue shows the region’s dual strength in manufacturing and government-led adoption. India’s UJALA has dispensed 36.78 crore bulbs, shaving power demand by 47,778 million kWh and avoiding 3.86 crore t CO₂ each year. Chinese factories deepen cost advantage; Signify’s 200,000 m² Jiujiang plant became its largest LED unit, underscoring a supply-chain pivot toward on-shore efficiency. Japanese agritech projects deploy AI-lit greenhouses, anchoring a premium channel. Southeast Asian urbanization fuels public-lighting build-outs, adding runway for fixture suppliers and controls vendors.
North America blends mature replacement demand with automation-driven new volume. High-bay retrofits and connected office revamps offset softer residential remodels. Patent litigation, however, raises compliance overhead as Signify and others enforce smart-lighting IP. Europe’s pathway is regulation-led; the fluorescent ban boosts sales but Germany’s housing slump trims new-build pipelines. Southern European tourism hubs invest in façade and street-lighting makeovers, partially balancing northern weakness.
The Middle East & Africa region tops growth charts at 6.64% CAGR. Dubai allocates USD 1.9 billion to a city-wide adaptive grid, embedding over a million connected luminaires. Riyadh and Doha follow suit, standardizing Zhaga-based sockets to ensure vendor-agnostic upgrades. African municipalities value solar-hybrid poles but pause orders during battery-price spikes; recycling pilot zones in Morocco and Rwanda seek to localize pack refurbishment and stabilize supply. Latin America’s momentum hinges on anti-counterfeit enforcement; Brazilian tariffs on low-grade imports aim to protect domestic brands.
Mordor Intelligence provides coverage of the lighting market across other key regional markets. Detailed country-level analysis extends to India incorporating local coverage and market participation, as required.

Competitive Landscape
The lighting market exhibits moderate concentration: the top five players collectively claim near-40% share, anchored by Signify, Acuity Brands, Zumtobel, Eaton’s Cooper Lighting, and GE Current. Signify reported EUR 6.1 billion in 2024 sales with 93% LED revenue and 153 million connected light points, emphasizing a services-heavy pivot. Acuity closed its USD 1.215 billion QSC buyout, knitting audio-visual assets into its Intelligent Spaces platform. Eaton’s electrical division posted 9% organic growth in early 2025, confirming sustained project backlog despite construction volatility.
Strategically, vendors chase vertical integration through joint ventures: Signify allied with Dixon Technologies to manufacture in India and with Gila Al Tawakol Electric in Egypt, cutting logistics cost and satisfying “Make in Country” tenders. Intellectual-property enforcement tightens; Signify’s lawsuit against Nanoleaf underlines a monetization push via its EnabLED licensing program. Regional specialists counter by focusing on application niches-horticultural lighting, UV-C disinfection, or heritage-grade façade fixtures-to sidestep broad patent estates. Software differentiation grows as cloud dashboards leverage real-time luminaire telemetry to optimize asset health and energy spend, turning hardware sales into subscription feeds.
Investors assess warranty risk and ESG metrics as procurement officers demand cradle-to-grave recycling pathways. Several OEMs now publicize circularity targets, offering buy-back schemes for LED boards. Private-equity moves are reshaping residential segments, exemplified by Kingswood’s merger of Kichler and Progress under Coleto Brands to form a USD 256 million platform. The competitive field thus balances consolidation in mainstream channels with innovation sprints in specialized domains, sustaining healthy rivalry within the lighting market.
Lighting Industry Leaders
Signify N.V.
Wipro Ltd.
Havells India Limited
OSRAM GmbH
Heliospectra AB.
- *Disclaimer: Major Players sorted in no particular order

Recent Industry Developments
- June 2025: Dixon Technologies and Signify unveil a 50:50 Indian manufacturing JV aimed at high-volume LED fixtures.
- May 2025: Eaton posts record Q1 EPS of USD 2.45, up 20% year-on-year, driven by 9% organic growth in electrical segments housing lighting solutions.
- April 2025: Signify reports EUR 1.4 billion Q1 revenue and raises its connected-points base to 153 million.
- April 2025: Signify sues Nanoleaf over six color-mixing patents, accentuating IP tensions in smart lighting.
- January 2025: Acuity Brands completes USD 1.215 billion QSC acquisition to deepen smart-building integration.


Global Lighting Market Report Scope
Lighting, or illumination, refers to the intentional application of light for practical or aesthetic purposes. It encompasses both artificial sources, such as lamps and fixtures, and the natural capture of daylight.
The study tracks the revenue accrued through the sale of lighting products by various players across the globe. The study also tracks the key market parameters, underlying growth influencers, and major vendors operating in the industry, which supports the market estimations and growth rates over the forecast period. The study further analyses the overall impact of COVID-19 aftereffects and other macroeconomic factors on the market. The report’s scope encompasses market sizing and forecasts for the various market segments.
The lighting market is segmented by product type (luminaires/fixtures, and lamps), light source(LED and conventional), application(commercial, industrial, and residential), and geography (North America, Europe, Asia Pacific, Middle East & Africa, and Latin America). The market sizes and forecasts regarding value (USD) for all the above segments are provided.
| Luminaires/Fixtures | Ceiling and Pendant |
| Downlights | |
| Troffers and Panels | |
| High-bay and Low-bay | |
| Flood and Street Lights | |
| Decorative Lighting | |
| Lamps | LED Bulbs |
| CFL | |
| Fluorescent Tubes | |
| HID | |
| Halogen |
| LED |
| Fluorescent (CFL/LFL) |
| HID |
| Halogen |
| Incandescent |
| Residential | Indoor |
| Outdoor | |
| Commercial | Offices and Workspaces |
| Retail and Hospitality | |
| Healthcare Facilities | |
| Education and Institutions | |
| Industrial | Manufacturing Facilities |
| Warehouses and Logistics | |
| Oil, Gas and Mining (Hazardous) | |
| Outdoor and Infrastructure | Roadway and Street Lighting |
| Architectural and Monuments | |
| Sports and Arenas | |
| Horticulture and Agricultural | Greenhouses |
| Vertical Farms | |
| Automotive | Exterior Lighting |
| Interior/Ambient Lighting |
| New Installations |
| Retrofit and Replacement |
| Direct/Project (B2B) |
| Retail (Offline) |
| E-commerce (Online) |
| North America | United States | |
| Canada | ||
| Mexico | ||
| Europe | Germany | |
| United Kingdom | ||
| France | ||
| Nordics | ||
| Rest of Europe | ||
| South America | Brazil | |
| Rest of South America | ||
| Asia-Pacific | China | |
| Japan | ||
| India | ||
| South-East Asia | ||
| Rest of Asia-Pacific | ||
| Middle East and Africa | Middle East | Gulf Cooperation Council Countries |
| Turkey | ||
| Rest of Middle East | ||
| Africa | South Africa | |
| Rest of Africa | ||
| By Product Type | Luminaires/Fixtures | Ceiling and Pendant | |
| Downlights | |||
| Troffers and Panels | |||
| High-bay and Low-bay | |||
| Flood and Street Lights | |||
| Decorative Lighting | |||
| Lamps | LED Bulbs | ||
| CFL | |||
| Fluorescent Tubes | |||
| HID | |||
| Halogen | |||
| By Light Source | LED | ||
| Fluorescent (CFL/LFL) | |||
| HID | |||
| Halogen | |||
| Incandescent | |||
| By Application | Residential | Indoor | |
| Outdoor | |||
| Commercial | Offices and Workspaces | ||
| Retail and Hospitality | |||
| Healthcare Facilities | |||
| Education and Institutions | |||
| Industrial | Manufacturing Facilities | ||
| Warehouses and Logistics | |||
| Oil, Gas and Mining (Hazardous) | |||
| Outdoor and Infrastructure | Roadway and Street Lighting | ||
| Architectural and Monuments | |||
| Sports and Arenas | |||
| Horticulture and Agricultural | Greenhouses | ||
| Vertical Farms | |||
| Automotive | Exterior Lighting | ||
| Interior/Ambient Lighting | |||
| By Installation Type | New Installations | ||
| Retrofit and Replacement | |||
| By Sales Channel | Direct/Project (B2B) | ||
| Retail (Offline) | |||
| E-commerce (Online) | |||
| By Geography | North America | United States | |
| Canada | |||
| Mexico | |||
| Europe | Germany | ||
| United Kingdom | |||
| France | |||
| Nordics | |||
| Rest of Europe | |||
| South America | Brazil | ||
| Rest of South America | |||
| Asia-Pacific | China | ||
| Japan | |||
| India | |||
| South-East Asia | |||
| Rest of Asia-Pacific | |||
| Middle East and Africa | Middle East | Gulf Cooperation Council Countries | |
| Turkey | |||
| Rest of Middle East | |||
| Africa | South Africa | ||
| Rest of Africa | |||


Key Questions Answered in the Report
What is the current size of the global lighting market?
The lighting market reached USD 148.31 billion in 2026 and is projected to climb to USD 201.26 billion by 2031.
How fast is LED technology growing relative to other light sources?
LED solutions held 68.95% revenue share in 2025 and are forecast to grow at a 6.25% CAGR through 2031, displacing fluorescent and HID options.
Which region leads the lighting market, and why?
Asia-Pacific commands 46.55% share because of large government programs like India’s UJALA and China’s manufacturing scale, making it both the largest producer and consumer region.
What application segment is expanding the quickest?
Horticultural and agricultural lighting shows the highest growth, advancing at an 7.98% CAGR as controlled-environment farms adopt spectrum-tunable LED systems.
How significant is retrofit demand compared with new construction?
Retrofits account for 63.95% of current revenue thanks to aging fluorescent installations, but new-build lighting still grows faster at 6.92% CAGR as emerging-market infrastructure accelerates.
Why are battery prices a concern for African smart-lighting projects?
Lithium-ion price swings raise capital costs for solar-hybrid street-lighting poles, forcing municipalities to delay tenders or explore refurbished-battery supply chains to stabilize budgets.
Page last updated on:


