
Street And Roadway Lighting Market Size and Share
Market Overview
| Study Period | 2020 - 2031 |
|---|---|
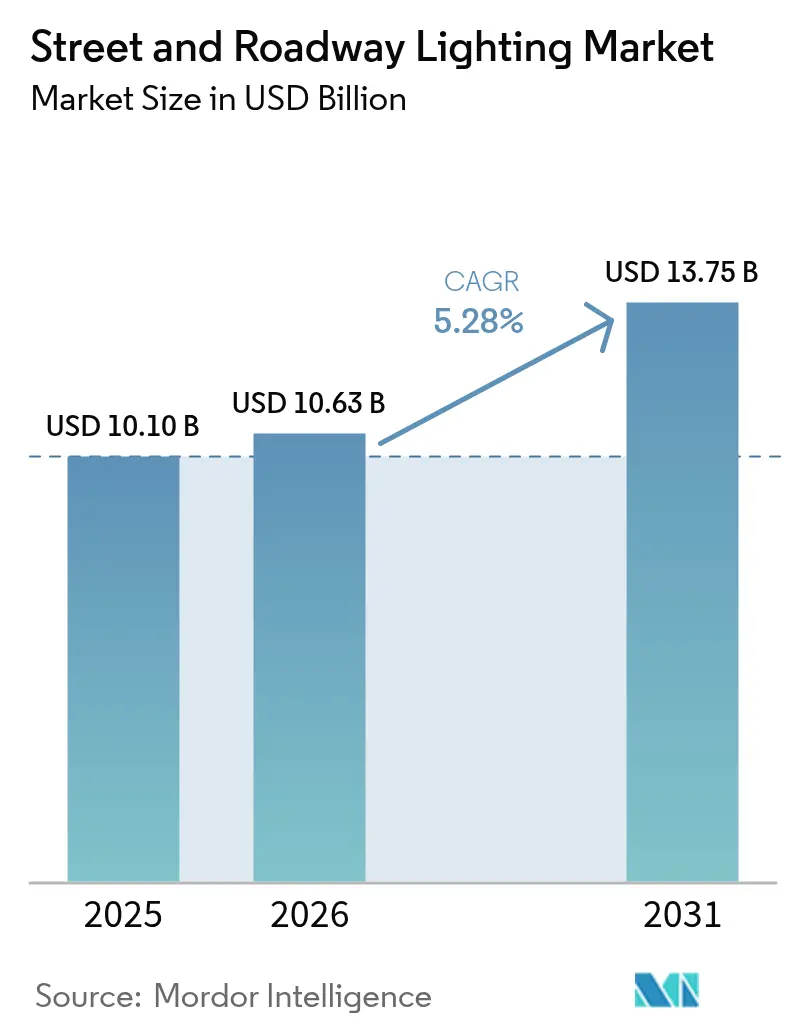
| Market Size (2026) | USD 10.63 Billion |
| Market Size (2031) | USD 13.75 Billion |
| Growth Rate (2026 - 2031) | 5.28 % |
| Fastest Growing Market | Asia Pacific |
| Largest Market | Asia Pacific |
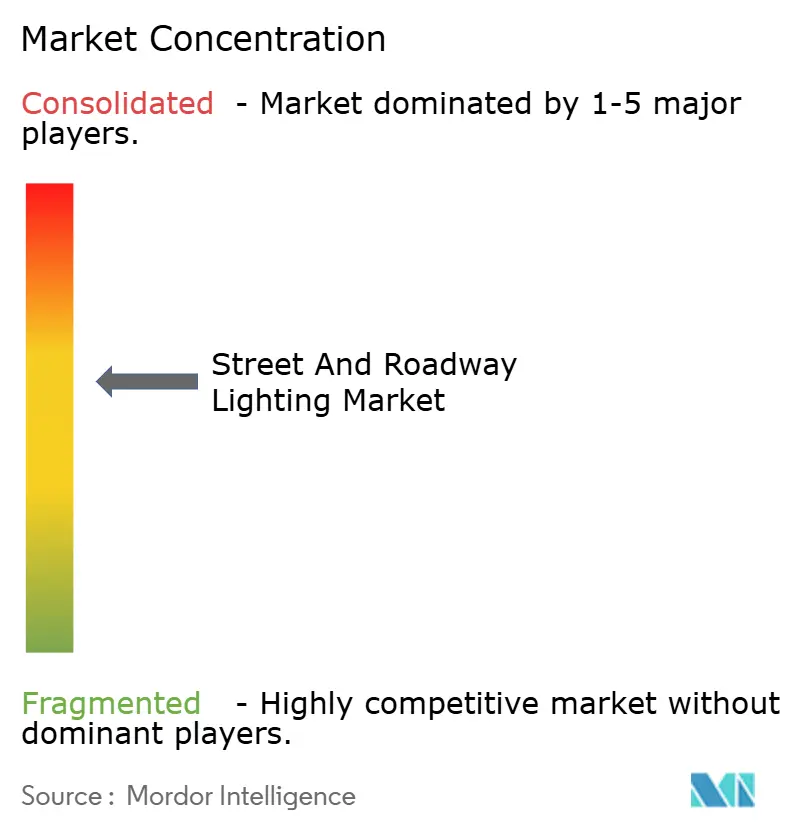
| Market Concentration | Medium |
Major Players *Disclaimer: Major Players sorted in no particular order Image © Mordor Intelligence. Reuse requires attribution under CC BY 4.0. | |
Street And Roadway Lighting Market Analysis by Mordor Intelligence
The street and roadway lighting market size in 2026 is estimated at USD 10.63 billion, growing from 2025 value of USD 10.10 billion with 2031 projections showing USD 13.75 billion, growing at 5.28% CAGR over 2026-2031. Accelerated LED retrofit programs, expanding smart-city infrastructure, and government carbon-reduction mandates underpin this trajectory as municipalities pivot from energy-intensive legacy systems toward connected platforms with adaptive dimming and vehicle-to-infrastructure capabilities. Hardware remains the revenue backbone, yet software and services are scaling quickly as cities seek operational intelligence. Supply-chain volatility in LED driver ICs and persistent cybersecurity concerns temper near-term momentum but are not expected to derail long-term growth. Asia-Pacific dominates current demand, while North America and Europe leverage policy incentives that privilege measurable safety and carbon outcomes.
Key Report Takeaways
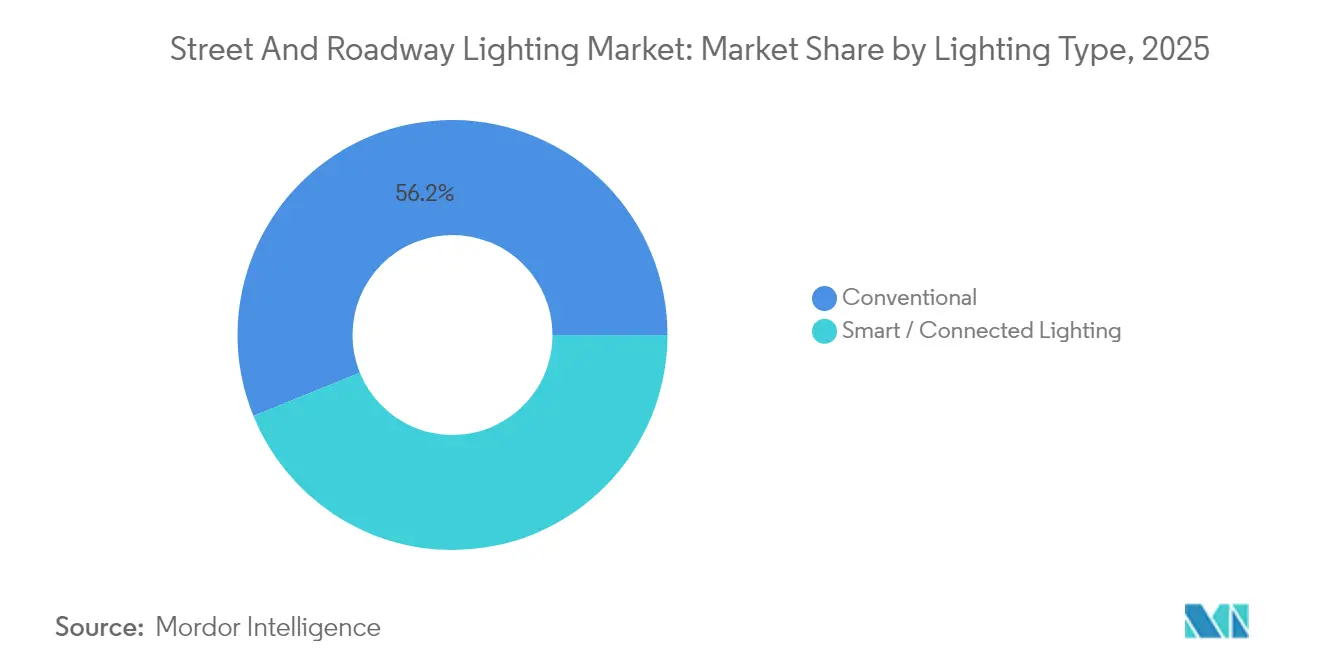
- By lighting type, conventional systems held 56.15% of the street and roadway lighting market share in 2025; smart/connected lighting is forecast to expand at a 6.82% CAGR through 2031.
- By light source, LEDs accounted for an 83.55% share of the street and roadway lighting market size in 2025 and are advancing at a 6.52% CAGR through 2031.
- By offering, hardware captured 60.95% share of the street and roadway lighting market in 2025; software and services are projected to grow at a 6.95% CAGR between 2026-2031.
- By power range, the 50-150 W segment commanded 53.15% share of the street and roadway lighting market in 2025, while also leading growth at a 7.05% CAGR to 2031.
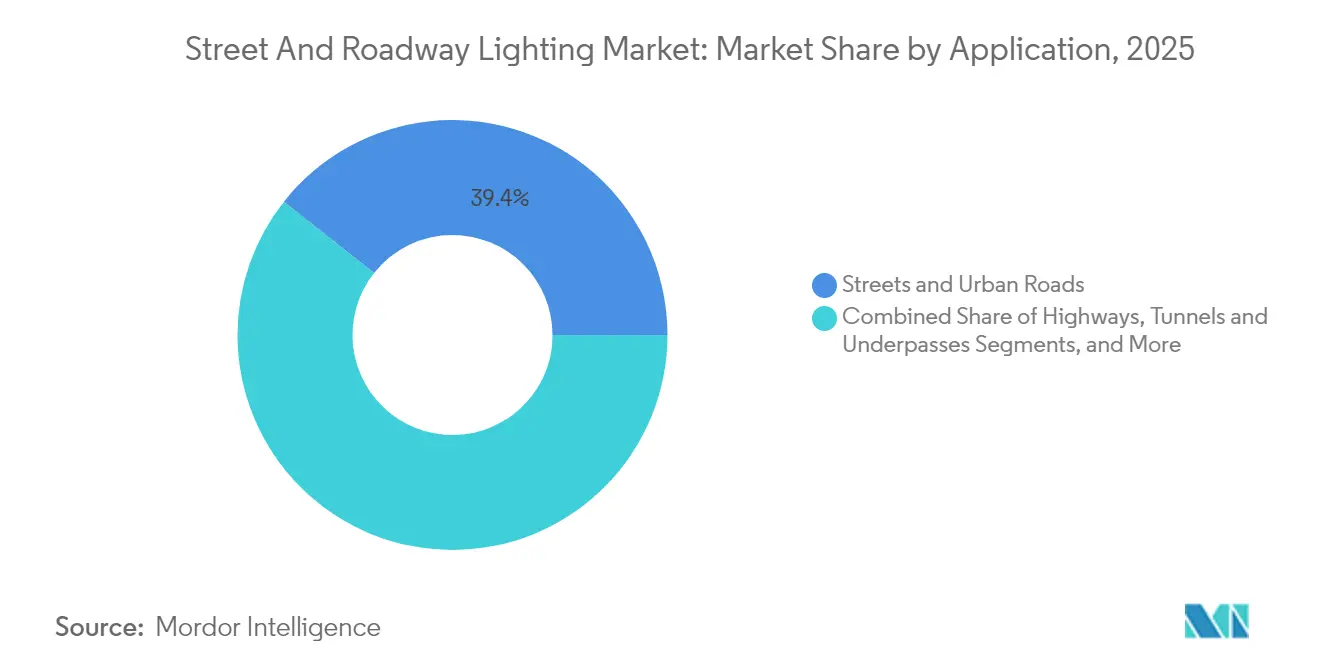
- By application, streets and urban roads led with a 39.35% share of the street and roadway lighting market in 2025; tunnels and underpasses are expected to post a 6.38% CAGR through 2031.
- By connectivity, wired solutions held 61.75% of the street and roadway lighting market size in 2025; wireless platforms are pacing at a 6.49% CAGR to 2031.
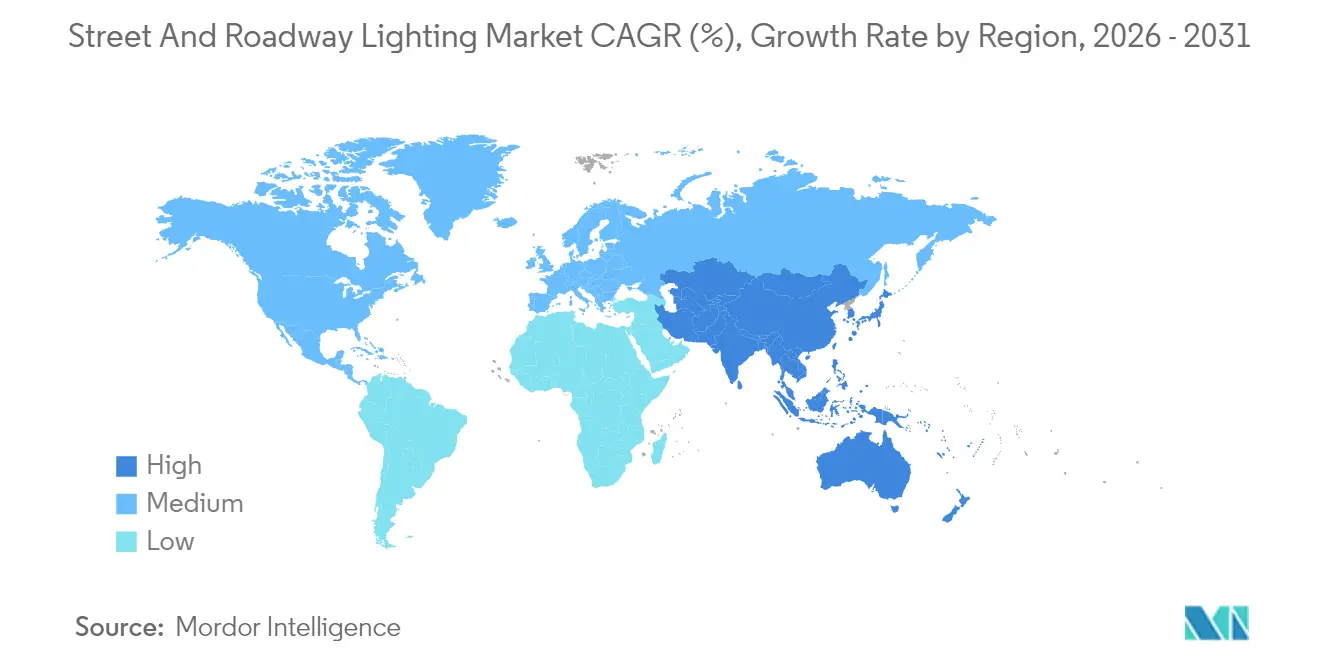
- By geography, Asia-Pacific controlled 36.85% share of the street and roadway lighting market in 2025 and represents the fastest-growing regional avenue at 6.12% CAGR to 2031.
Note: Market size and forecast figures in this report are generated using Mordor Intelligence’s proprietary estimation framework, updated with the latest available data and insights as of 2026.
Market Trends and Insights
Drivers Impact Analysis of Street And Roadway Lighting Market*
| Driver | (~) % Impact on CAGR Forecast | Geographic Relevance | Impact Timeline |
|---|---|---|---|
| Accelerated LED retrofit programs | +1.8% | Global; strong in North America and EU | Medium term (2-4 years) |
| Rising deployment of connected/IoT lighting | +1.2% | APAC core; spill-over to North America | Long term (≥ 4 years) |
| Government carbon-reduction mandates and funds | +1.5% | Global; led by EU and North America | Short term (≤ 2 years) |
| Rapid smart-city roll-outs in emerging economies | +0.9% | APAC core; expanding to MEA | Long term (≥ 4 years) |
| Edge-AI adaptive dimming for wildlife safety | +0.3% | North America and EU coastal regions | Long term (≥ 4 years) |
| Vehicle-to-Infrastructure integration | +0.4% | North America, EU, select APAC markets | Long term (≥ 4 years) |
| Source: Mordor Intelligence | |||
Accelerated LED Retrofit Programs
Municipal LED initiatives now bundle sensor networks, adaptive controls, and grid modernization objectives to unlock deeper carbon and O&M savings. New York Power Authority’s Smart Street Lighting NY illustrates the model by folding demand-response and spectral tuning into LED upgrades.[1]New York Power Authority, “Smart Street Lighting NY Progress Update,” ny.gov Ireland’s EUR 17.5 million rural conversion plan likewise favors fixtures capable of future V2I communication, indicating that cities increasingly write “upgrade-ready” specifications. Financing tools, energy-service contracts, green bonds, and infrastructure funds are widening access and lowering lifecycle costs, expanding the addressable street and roadway lighting market.[2]Energy Communities, “Low Carbon Transportation Materials Grant Program,” energycommunities.gov
Rising Deployment of Connected/IoT-Enabled Street Lights
Cities are moving from pilots to fleet-scale connected lighting roll-outs as the value of granular asset data becomes clear. Signify reported 144 million managed connected light points in 2024, demonstrating platform scalability.[3]Signify, “Signify reports first quarter 2024 results,” signify.com Low-power wide-area technologies like NB-IoT and LoRaWAN have cut connectivity costs, enabling secondary cities to embrace smart lighting. Copenhagen’s 44,000-node network folds air-quality sensing into luminaires, creating new municipal revenue streams from environmental compliance analytics. This pivot from energy savings to data monetization raises switching barriers and lengthens vendor contracts, reinforcing long-term growth.
Government Carbon-Reduction Mandates and Funding
Regulatory urgency is translating into earmarked budgets. The U.S. Infrastructure Investment and Jobs Act assigned USD 982 million to Safe Streets and Roads for All in 2025, with lighting upgrades explicitly eligible.[4]Missouri Department of Transportation, “FY25 Safe Streets and Roads for All Notice,” modot.org Similar EU Green Deal instruments reward projects that quantify CO₂ avoidance and safety benefits, realigning procurement criteria toward adaptive systems with verifiable outcomes. Bundling lighting with EV charging and smart traffic management further inflates contract values, allowing providers to cross-sell services and deepen relationships.
Restraints Impact Analysis of Street And Roadway Lighting Market*
| Restraint | (~) % Impact on CAGR Forecast | Geographic Relevance | Impact Timeline |
|---|---|---|---|
| High upfront capex for large-scale conversions | -0.8% | Global; acute in emerging markets | Short term (≤ 2 years) |
| Cyber-security and data-privacy vulnerabilities | -0.4% | Global; heightened in North America and EU | Medium term (2-4 years) |
| Utility-ownership misalignment | -0.3% | North America; select EU markets | Medium term (2-4 years) |
| Supply-chain volatility in LED driver ICs | -0.5% | Global; APAC manufacturing concentration | Short term (≤ 2 years) |
| Source: Mordor Intelligence | |||
High Upfront Capex for Large-Scale Conversions
Total cost of ownership for connected systems can surpass USD 500 per fixture, triple a basic LED swap, forcing municipalities to seek ESCO financing or PPP structures that prolong procurement cycles by up to 18 months. Smaller cities without capital-improvement budgets face the sharpest squeeze, constraining immediate conversion volumes despite compelling long-term savings. Grant programs partially bridge the gap but often require detailed M&V documentation, adding an administrative burden that delays deployment.
Cyber-Security and Data-Privacy Vulnerabilities
IoT lighting networks introduce fresh attack vectors into municipal IT domains. Pen-tests have shown that compromised gateways can expose traffic-management servers, intensifying risk mitigation scrutiny. Compliance with NIST frameworks and evolving EU Cyber Resilience Act requirements obliges vendors to layer encryption, authentication, and over-the-air patching, costs that inflate bid prices. Procurement teams lacking cyber expertise may defer projects or restrict functionality, capping near-term penetration of full-featured platforms.
*Our forecasts treat driver/restraint impacts as directional, not additive. The impact forecasts reflect baseline growth, mix effects, and variable interactions.
Street And Roadway Lighting Market Segment Analysis
By Lighting Type:
Connected Systems Drive Future GrowthSmart/connected solutions recorded a 6.82% CAGR outlook, yet conventional fixtures still comprised 56.15% of 2025 revenue. This coexistence underscores staggered asset-replacement cycles that keep legacy options viable for basic illumination. Metropolitan agencies deploy connected systems along priority corridors where data analytics can justify premium pricing, whereas smaller jurisdictions favor passive LED swaps with upgrade-ready nodes. The street and roadway lighting market benefits as both pathways steadily erode outdated high-intensity discharge stock. Signify’s 144 million light-point footprint validates platform scalability while reinforcing vendor lock-in.
Momentum continues as standards bodies embed connectivity in future efficiency codes, redirecting capex toward digital luminaires. Vendor roadmaps show edge-AI vision sensors migrating onboard fixtures, promising adaptive dimming and situational awareness that elevate public-safety value propositions. Over the forecast horizon, smart platforms are expected to outpace conventional growth threefold, redefining service models in the wider street and roadway lighting industry.



By Light Source:
LED Dominance with Efficiency EvolutionLEDs captured 83.55% share in 2025 and will retain hegemony through 2031 as efficacy inches past 200 lm/W. Niche fluorescent and HID replacements linger primarily in industrial yards, awaiting budget cycles. Amber 590 nm packages are gaining coastal traction to safeguard nocturnal wildlife, while circadian-friendly warm whites appeal to residential precincts. The street and roadway lighting market size for LED-based systems is projected to compound at a 6.52% CAGR, supported by falling per-lumen costs and higher spectral customization.
Driver IC integration and improved thermal paths now push rated lifetimes toward 100,000 hours, reducing relamping truck rolls. Supply tightness in specialty ICs remains a bottleneck, with delivery times extending up to 52 weeks for advanced dimming controllers. Nevertheless, multiyear framework contracts and localized inventory hubs are helping global vendors buffer shocks, sustaining LED’s centrality.
By Offering:
Hardware Foundation with Software GrowthHardware dominated 60.95% of 2025 revenue, anchoring the physical footprint that unlocks future software monetization. Cities increasingly stipulate open APIs and edge compute, compelling luminaire makers to bundle gateways and nodes even in base models. Software and services, led by SaaS lighting-management platforms, are tracking a 6.95% CAGR as municipalities seek predictive maintenance and cross-domain data fusion. This transition lifts recurring revenue visibility, enticing incumbents to acquire analytics specialists and cloud-native startups.
The street and roadway lighting market, therefore, evolves from product sales toward lifecycle value, mirroring trends in adjacent building-automation sectors. Vendor differentiation now pivots on cybersecurity certifications, AI toolchains, and integration ease rather than form-factor aesthetics, elevating entry barriers for commodity players.

By Power Range:
Mid-Range Optimization for Urban ApplicationsFixtures rated 50-150 W represented 53.15% of 2025 installations and headline a 7.05% CAGR outlook to 2031. They replace legacy 250-400 W HPS heads along arterials, delivering 50-70% energy cuts while meeting Illuminating Engineering Society uniformity norms. Adaptive dimming in this bracket yields incremental 30-50% savings based on traffic volume analytics, aligning with Vision Zero lighting guidelines. Below-50 W units domicile in residential lanes and greenways; above-150 W serve high-mast interchanges.
Market specifications increasingly require lumen-output tunability within this band, enabling municipalities to standardize across diverse roadway classes. As a result, the 50-150 W cohort anchors procurement catalogs, bolstering the street and roadway lighting market share for vendors mastering mid-range photometric design.
By Application:
Urban Roads Lead with Specialized GrowthStreets and urban roads held 39.35% of the 2025 spend, reflecting dense fixture grids across global metros. Integrated poles that combine lighting, EV chargers, and environmental sensors are redefining curbside infrastructure, expanding wallet share per pole. Tunnels and underpasses, while only a fraction of the current volume, are slated for a 6.38% CAGR given stricter visibility codes and modernization projects along freight corridors. Highway segments prioritize high-output optics and glare control, whereas parking estates adopt luminaires with embedded cameras for security revenue streams.
Diverse application needs push vendors to expand modular product lines, facilitating lumen and optic swaps without re-engineering housings, thereby shortening design-win cycles and elevating replacement velocity in the street and roadway lighting market.
By Connectivity Technology:
Wired Systems with Wireless MomentumPower-line communication, DALI, and PoE sustained a 61.75% foothold in 2025 due to reliability and sunk infrastructure. However, wireless paradigms, NB-IoT, LoRaWAN, and increasingly 5G, are catching up at a 6.49% CAGR on the back of lower deployment costs for distributed assets. Cities with fiber backbones often run hybrid networks, reserving wireless for remote districts or retrofit zones devoid of spare conduits. Cyber-hardened stacks featuring TLS 1.3 and hardware root-of-trust chips are easing security hesitations, accelerating wireless acceptance.
For suppliers, multiradio boards and software-defined networking enable SKU rationalization while satisfying heterogeneous municipal specs, protecting the addressable street and roadway lighting market size amid protocol flux.
Geography Analysis
APAC Street and Roadway Lighting Market
Asia-Pacific commanded 36.85% of 2025 revenue and is poised for a 6.12% CAGR through 2031 on the back of large-scale urbanization in China, India, and ASEAN. Beijing’s low-carbon districts embed air-quality sensors in new luminaires, while India’s Smart Cities Mission is standardizing LED nodes across 100 municipalities, propelling the regional street and roadway lighting market. Local manufacturing capacity shortens lead times and underpins aggressive subsidy programs that compress payback periods below four years.
North America Street and Roadway Lighting Market
North America ranks second by value, buoyed by federal funding enclaves like the USD 982 million SS4A mechanism that earmarks lighting for crash-reduction projects. Vision Zero action plans in New York, Portland, and Los Angeles are shifting specifications toward adaptive optics that boost pedestrian visibility. Utilities’ ownership of pole infrastructure, however, introduces alignment challenges that occasionally delay conversions. Still, rising electrical-safety standards and carbon accounting frameworks keep pressure on lagging jurisdictions.
Europe Street and Roadway Lighting Market
Europe exhibits mature LED penetration yet continues to upgrade via smart controls driven by the EU Green Deal and EN-13201 revisions. Municipal dark-sky ordinances are fueling demand for precision optics and ultra-warm CCTs to curb light pollution, sustaining premium ASPs in the street and roadway lighting market. Innovation grants in Scandinavia and DACH markets sponsor pilot projects exploring wildlife-friendly spectra and V2I corridor lighting, providing test beds for vendors targeting export opportunities.

Regulatory Landscape
Regulation is increasingly framed around minimum energy performance and product sustainability requirements, which is accelerating the shift from legacy road-lighting technologies to LED and connected control gear. In the European Union, Commission Regulation (EU) 2019/2020 sets ecodesign requirements for light sources and separate control gear sold in the bloc, influencing luminaire and driver specifications used in public tenders. In April 2025, the European Commission adopted the 2025-2030 working plan for the Ecodesign for Sustainable Products Regulation (ESPR), pointing to a compliance shift beyond efficacy toward durability, repairability, and resource efficiency that affects luminaire design, serviceability, and documentation.
Country and sub-national rules also reinforce efficiency thresholds and performance specifications for roadway applications. In the United States, Minnesota statutes require new or replacement highway, street, and parking lot lighting to meet at least 70 lumens per watt, embedding efficiency into procurement for public lighting assets. In Saudi Arabia, SASO-2927:2019 defines energy efficiency, functionality, and labeling requirements for street and road lighting across roadway classifications (M, C, and P). In China, GB/T 31832-2025 (implemented February 2026) and GB/T 24827-2026 (implemented November 2026, replacing the 2015 version) update technical requirements and performance specifications for LED road and street luminaires, which can be adopted by provinces and cities through tender specifications even where standards are not universally mandatory.
Value Chain Analysis
The value chain runs from upstream materials and components to assembly, integration, and lifecycle services. Upstream inputs include aluminum or steel housings, optics, and electronics, with core components such as LED packages or chips, driver ICs and power supplies, surge protection, sensors, and connectivity modules (PLC/DALI/PoE and wireless such as NB-IoT/LoRa/5G). Midstream players assemble luminaires and controls, then integrate them into centralized management software and city platforms. Downstream activities include electrical contractors, ESCOs or PPP operators, utilities and pole owners, and municipal procurement bodies that award framework contracts for installation, commissioning, and ongoing maintenance.
Asia-Pacific, particularly China, remains a major manufacturing hub for LED components and luminaire assembly, and regional assembly plus multi-sourcing strategies are used to manage tender local-content requirements and trade-risk exposure. As procurement shifts from one-time luminaire purchases toward performance-based contracts and concessions, the services layer expands, raising the importance of software, cybersecurity hardening, and monitoring and verification alongside hardware. Supply-chain volatility in LED driver ICs continues to affect lead times and vendor qualification strategies. Capability expansion through acquisitions is also visible in adjacent smart infrastructure segments, for example LEOTEK Corporation’s acquisition of Dialight plc’s traffic business in July 2026, which broadens connected outdoor infrastructure offerings where roadway lighting and traffic systems are increasingly procured together.
Competitive Landscape
The market remains moderately concentrated: the top five suppliers collectively hold an estimated 45-50% share. Signify, OSRAM, and Acuity Brands leverage vertical integration from LED engines to cloud software, enabling margin capture across the value stack. Signify’s open-API Interact platform manages 144 million light points, conferring data-network scale that smaller rivals struggle to match. Acuity’s acquisition of The Luminaires Group enhanced specification-grade breadth and added manufacturing synergies in North America.
Mid-tier challengers such as Telensa, DimOnOff, and Silver Spring Networks focus on niche software or connectivity layers, partnering with fixture OEMs to penetrate bids requiring open architectures. Private-equity roll-ups, e.g., Kingswood Capital’s formation of Coleto, aggregate residential and light-commercial brands to negotiate better component pricing and distribution efficiency. Frontier niches include solar hybrid poles, wildlife-tuned spectra, and energy-as-a-service contracts, where startups like Sol by Sunna Design test leasing models that shift capex off municipal books.
Cyber resilience is a new arena of differentiation; vendors are certifying to IEC 62443 and ISO 27001 to assuage procurement risk. Component scarcity in LED drivers has catalyzed multi-sourcing strategies and localized assembly lines, with firms like OSRAM hedging against Asian supply disruptions by re-shoring select SKUs to Eastern Europe. Overall, competitive intensity is tilting toward platforms and data services rather than pure-play luminaires, reshaping long-term margins in the street and roadway lighting market.
Street And Roadway Lighting Industry Leaders
Signify N.V.
OSRAM GmbH
Wolfspeed Inc. (Cree LED)
Acuity Brands Inc.
Current Lighting Solutions, LLC
- *Disclaimer: Major Players sorted in no particular order
Street And Roadway Lighting Market Companies Covered in this Report
- Signify N.V.
- OSRAM GmbH
- Current Lighting Solutions, LLC
- Wolfspeed Inc. (Cree LED)
- Acuity Brands Inc.
- Hubbell Inc.
- Zumtobel Group AG
- Schréder S.A.
- Eaton Corporation plc (Cooper Lighting Solutions)
- Valmont Industries Inc.
- Telensa Ltd.
- Silver Spring Networks Inc.
- Wipro Lighting (Wipro Enterprises)
- Nichia Corporation
- Dialight plc
- LED Roadway Lighting Ltd.
- Kingsun Optoelectronic Co.
- Syska LED Lights Pvt Ltd.
- DCD Technologies ME FZCO
- Itron Inc.

Market Opportunities and Future Outlook
Interoperability-led procurement is creating whitespace for vendors that can align luminaires, controls, and management software to common interfaces rather than proprietary stacks. In February 2026, the TALQ Consortium published Smart City Protocol Version 2.7.0 with mandatory joint profiles tied to DALI D4i and Zhaga, supporting multi-vendor deployments in outdoor lighting and helping simplify tender compliance for connected nodes, controllers, and CMS platforms. ISO also published ISO/TR 19482:2026 in February 2026, documenting a smart streetlighting management platform case study for traffic safety, which reinforces centralized management and data-driven operations as part of roadway-safety programs.
Large municipal modernization programs and tenders provide near-term scale across mature and emerging markets, while also increasing demand for software and services beyond hardware swaps. In April 2026 reporting, the City of Toronto committed CAD 577 million to convert 173,100 streetlights to LED and deploy smart controls through 2035. In May 2026, the City of Cali opened a tender to modernize 186,000 streetlights to smart LED within 24 months, both pointing to sustained appetite for citywide conversions that bundle controls and asset management. In emerging markets, PPP and energy-efficiency agency models support upgrades, including Kenya’s National Treasury approval of a Sh3.45 billion PPP for an Eldoret solar power plant and street lighting upgrade in April 2026, and the Andhra Pradesh government partnership with Energy Efficiency Services Limited (EESL) to upgrade 10.5 lakh streetlights with integrated lighting management systems in June 2026. These programs support opportunities around connected lighting platforms, cybersecurity and compliance services, and hybrid infrastructure packages that combine lighting with communications and renewable integration.
Recent Industry Developments in Street And Roadway Lighting Market
- April 2026: Acuity Brands, through its Luminis brand, launched the Bellevue Slim family of exterior luminaires with multiple IES roadway distributions (Type II, III, IV, and V) and output up to 16,000 lumens. The launch broadens specification options for streets, urban roads, and public-area applications where photometric flexibility and consistent form factors support standardized municipal catalogs.
- September 2025: Current Lighting Solutions and Itron entered a joint marketing agreement to integrate Current’s Evolve Roadway LED luminaires (ERLx and ERNx families) with Itron’s CityEdge smart lighting control and management technology. The pairing advances end-to-end bids that combine luminaires, connectivity, and a CMS layer, aligning with municipal procurement that is moving from LED swaps toward managed, data-capable infrastructure.
- July 2024: Acuity Brands introduced the Cell Connect solution for outdoor lighting, using D4i-certified photocontrols from Ubicquia embedded in AEL luminaires to enable cellular LTE communication and cloud-based asset management. Embedding standardized, cellular-connected controls lowers deployment friction in retrofit zones without existing communications backhaul and strengthens recurring software and services pull-through.


Street And Roadway Lighting Market Report Scope and Research Methodology
Market Definition and Coverage
This market is defined as the revenue earned from supplying and deploying lighting solutions used to illuminate public streets and roadways, including luminaires, lamps, poles where bundled, and connected control components used to operate these systems.
Scope exclusions: indoor lighting, decorative architectural facade lighting, and sports stadium floodlighting are excluded from the market totals.
Segments Covered in This Report
- By Lighting Type
- Conventional Lighting
- Smart / Connected Lighting
- By Light Source
- LEDs
- Fluorescent Lamps
- High-Intensity Discharge Lamps
- By Offering
- Hardware
- Lights and Bulbs
- Luminaires
- Control Systems
- Software and Services
- Hardware
- By Power Range (Wattage)
- Below 50 W
- 50 - 150 W
- Above 150 W
- By Application
- Highways
- Streets and Urban Roads
- Tunnels and Underpasses
- Parking and Public Areas
- By Connectivity Technology
- Wired (PLC, DALI, PoE)
- Wireless (Zigbee, NB-IoT, LoRa, 5G)
- By Geography
- North America
- United States
- Canada
- Mexico
- South America
- Brazil
- Argentina
- Rest of South America
- Europe
- Germany
- United Kingdom
- France
- Italy
- Rest of Europe
- Asia-Pacific
- China
- Japan
- South Korea
- India
- Rest of Asia-Pacific
- Middle East
- Saudi Arabia
- United Arab Emirates
- Rest of Middle East
- Africa
- South Africa
- Rest of Africa
- North America
Data Sources, Market Sizing, and Validation
Desk Research
Desk work was used to build the base demand pool for roadway assets and to ground the pricing and technology mix assumptions. We referred to public sources such as IEA lighting and electricity indicators, U.S. DOE and ENERGY STAR efficiency references, UN Comtrade trade statistics for lighting products, World Bank and UN urbanization and infrastructure indicators, and standards guidance published by bodies such as IES.
To make the model usable in real conditions, secondary inputs were also pulled from company annual reports, investor presentations, municipal procurement pages, and reputable press coverage on LED retrofits and smart-city rollouts. In a few places, paid subscriptions were used for company financials and intelligence, patent landscaping, and shipment-level import and export checks to spot outliers in unit economics. This list is indicative only, and other sources were reviewed for collection, validation, and clarification.
Primary Interviews and Surveys
Primary discussions were run with fixture and component suppliers, system integrators, distributors, and public-sector buyers to confirm what is being purchased, how projects are packaged, and how pricing changes with controls and connectivity. We also tested assumptions on replacement cycles, retrofit versus new-build shares, and the rollout pace by region across APAC, EMEA, and the Americas, so gaps from desk findings could be closed with practical inputs.
Distribution of primary research fieldwork respondents
| Company type | Respondent position | Region |
|---|---|---|
| Top tier: 29% | CXOs: 18% | APAC: 40% |
| Mid tier: 49% | Functional/Unit leaders: 23% | EMEA: 33% |
| Smaller Players: 22% | Managers: 59% | Americas: 27% |
Market-Sizing & Forecasting
Sizing starts with a top-down rebuild of addressable roadway lighting demand using public infrastructure and urban development signals, then translating that into annual spend through adoption and replacement patterns. For this market, key inputs typically include installed base and street length proxies, retrofit program intensity, LED penetration in public lighting, smart-control attach rates, and average project pricing by wattage class and application (for example, highways versus tunnels).
Once the high-level totals are formed, they are checked with selective bottom-up approximations, such as sampled average selling price multiplied by shipped volumes, channel checks on project bill-of-material splits, and supplier revenue exposure to street and roadway programs. Where the bottom-up view is incomplete, gaps are handled by using conservative ranges from interviews and then validating them against known procurement volumes and trade flow direction.
For forecasts, a mix of scenario analysis and multivariate regression is used so growth is linked to drivers like energy-efficiency mandates, municipal capex cycles, electricity price pressure, and connected lighting rollout plans. Assumptions are kept explicit so a new analyst can reproduce the logic and adjust it when a driver shifts.
Data Validation & Update Cycle
Outputs are validated through step-by-step cross-checks that compare totals against independent signals, such as public tender activity, trade intensity for key lighting categories, and the implied replacement rate versus typical asset life. When a large variance shows up, we revisit the input series, re-check currency timing, and re-contact select respondents to confirm whether the change is real or driven by model structure.
Before sign-off, the model and narrative go through multiple analyst reviews, with quick tests run on pricing, mix, and region shares to ensure the story matches the numbers. Reports are refreshed annually, and interim updates are triggered when material events occur, such as policy shifts, major retrofit funding announcements, or sudden component supply constraints. Right before delivery, a final data pass is completed so clients receive the latest updated view.
Mordor Intelligence's Street and Roadway Lighting Market Size Versus Other Published Estimates
Published market sizes for street and roadway lighting often do not match because each publisher counts a slightly different project bundle and uses different timing for prices and currency. The year used for the base, how retrofit cycles are treated, and whether controls and services are counted as part of the system can also shift the total noticeably.
Installation and maintenance services are a common swing factor. In Mordor Intelligence's scope, they are counted only when they are packaged and invoiced as part of street and roadway lighting offerings, rather than as broader civic works. Differences also come from how smart lighting is defined, since some estimates treat connected sensors and adjacent smart-city hardware as automatically included. Finally, refresh cadence matters, since LED and controls pricing can change quickly and older assumptions can drift away from current procurement reality.
Benchmark comparison
| Source | Market Size | Gaps in Research Methodology |
|---|---|---|
| Mordor Intelligence | USD 10.63 B (2026) | |
| Industry Research Publisher A | USD 10.27 B (2024) | Uses an earlier base year, and its scope language suggests broader inclusion of design, installation, and ongoing support services across civic projects, which can shift value away from pure lighting system spend. |
| Industry Research Publisher B | USD 10.70 B (2025) | Runs on a different forecast window and base assumptions, and provides limited visibility on how smart controls, connectivity, and retrofit pricing progression are normalized across regions and currency timings. |
Taken together, the spread is mainly explained by what gets counted inside a lighting project bundle, the year chosen for pricing, and how smart add-ons are treated. By keeping the input drivers tied to observable infrastructure signals and then checking them against real-world buying patterns from interviews, the resulting estimate stays traceable and practical to update.


Key Questions Answered in the Report
What is the current value of the street and roadway lighting market?
The street and roadway lighting market size stood at USD 10.63 billion in 2026.
How fast is the market expected to grow over the next five years?
It is forecast to expand at a 5.28% CAGR, reaching USD 13.75 billion by 2031.
Why are cities prioritizing smart or connected streetlights now?
Beyond energy savings, connected lights provide traffic, environmental, and safety data that support broader smart-city objectives.
Which region is growing the quickest in adopting modern street lighting?
Asia-Pacific leads with a projected 6.12% CAGR through 2031 thanks to rapid urbanization and government-backed smart-city programs.
What is the biggest technical risk municipalities face when adopting IoT lighting?
Cyber-security vulnerabilities can expose municipal networks, necessitating robust encryption and compliance with evolving standards.
Which power range dominates new LED street-light installations?
Fixtures rated between 50-150 W account for more than half of new deployments because they balance coverage and efficiency.
Page last updated on:





