Retail Digital Signage Market Size and Share
Market Overview
| Study Period | 2020 - 2031 |
|---|---|
| Market Size (2026) | USD 6.24 Billion |
| Market Size (2031) | USD 8.29 Billion |
| Growth Rate (2026 - 2031) | 5.86% CAGR |
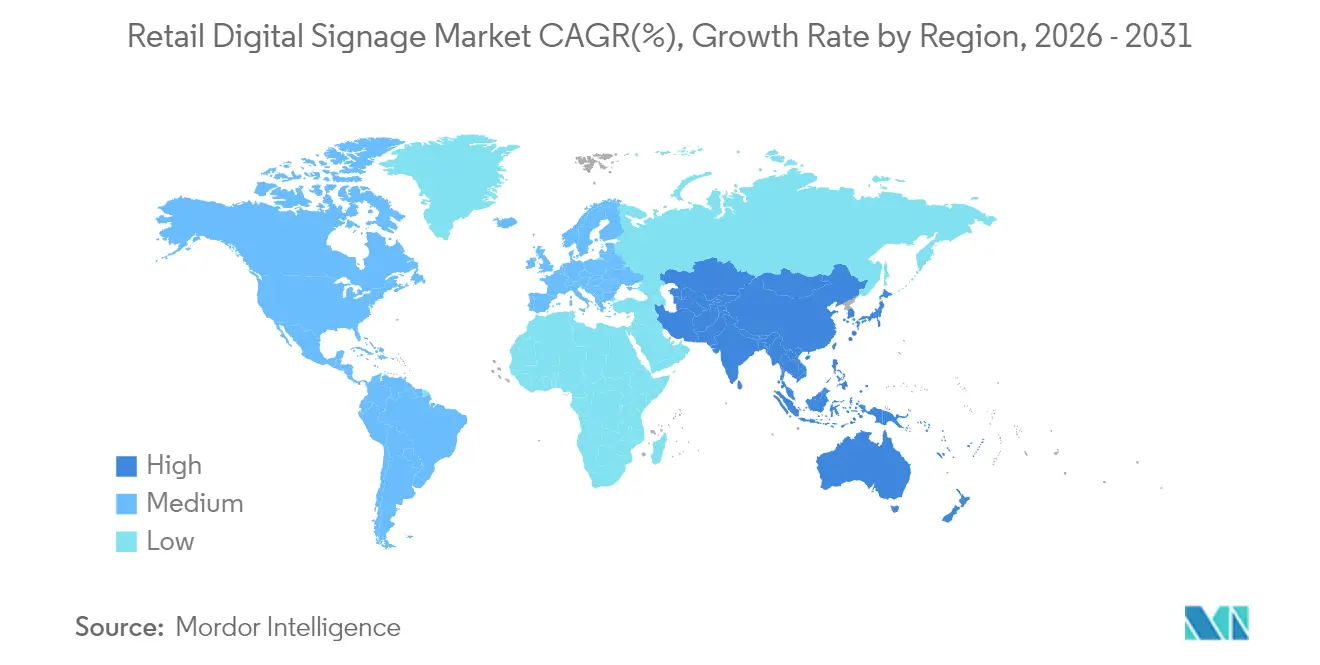
| Fastest Growing Market | Asia Pacific |
| Largest Market | North America |
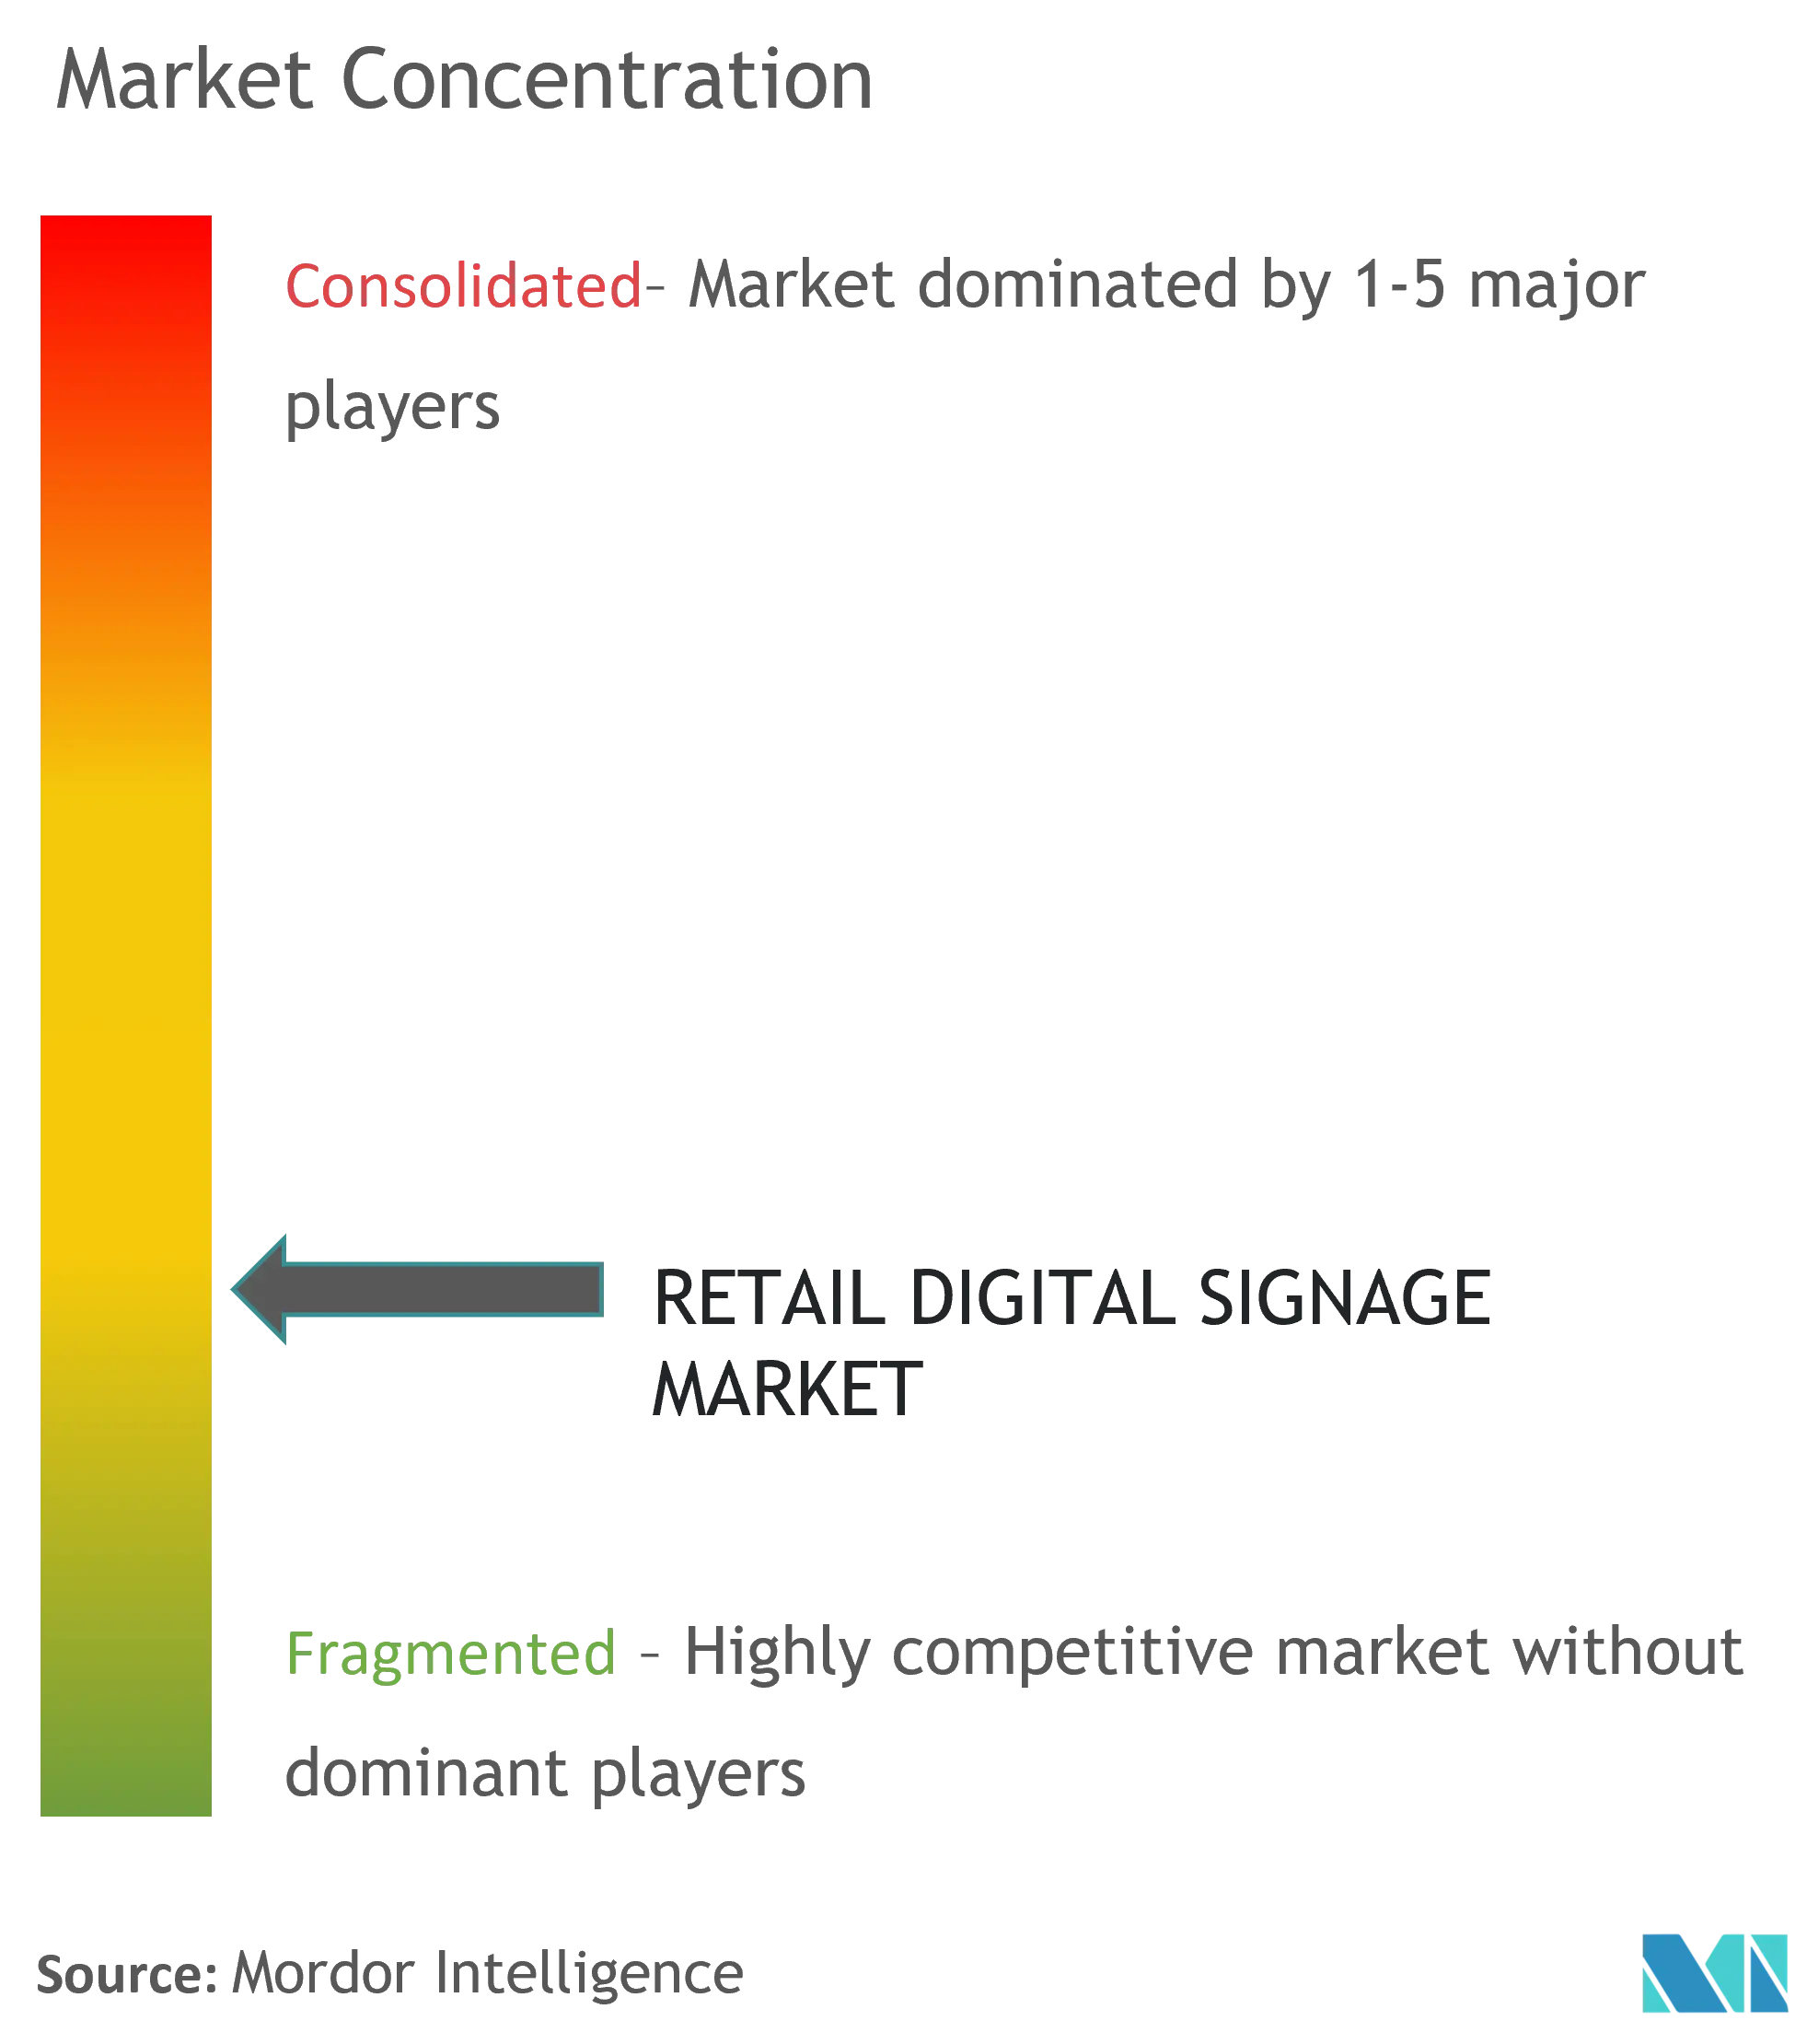
| Market Concentration | Medium |
Major Players *Disclaimer: Major Players sorted in no particular order Image © Mordor Intelligence. Reuse requires attribution under CC BY 4.0. | |
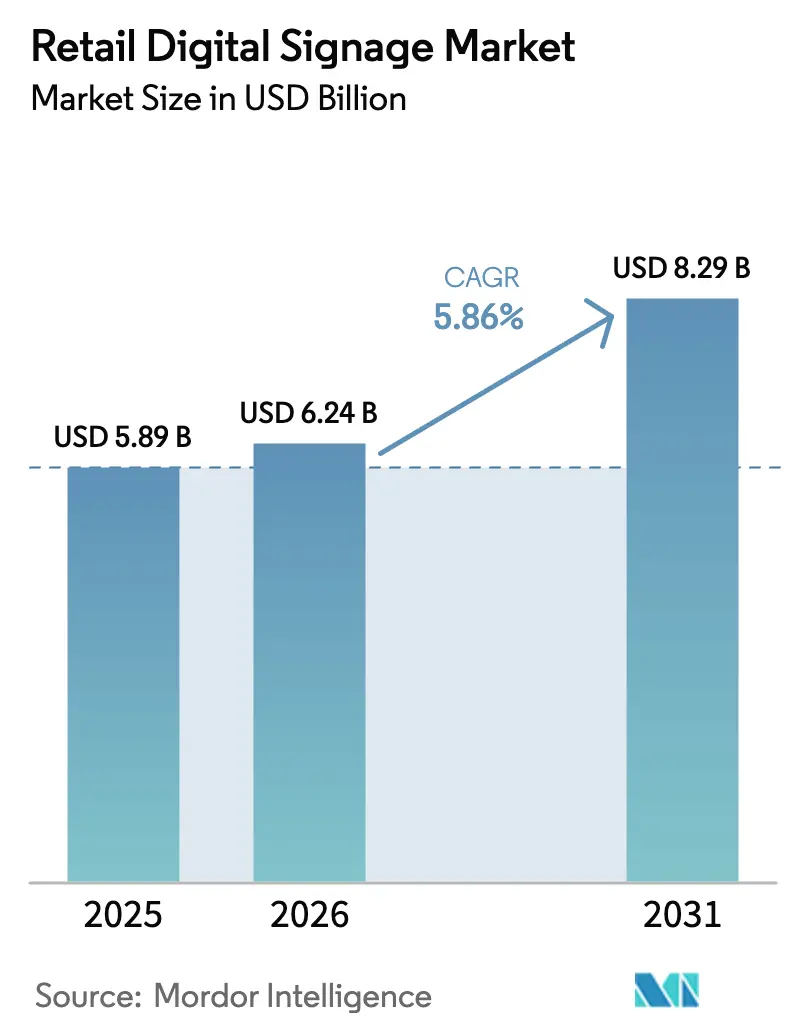
Retail Digital Signage Market Analysis by Mordor Intelligence
The retail digital signage market size in 2026 is estimated at USD 6.24 billion, growing from 2025 value of USD 5.89 billion with 2031 projections showing USD 8.29 billion, growing at 5.86% CAGR over 2026-2031. Growth is tied to falling LED video-wall prices, 5G private-network roll-outs, and cloud software that lets retailers update thousands of screens from a single dashboard. AI-driven shopper analytics now power real-time content that reacts to demographic signals, inventory levels, and even weather, while IoT shelf-edge displays bring dynamic pricing to every aisle. Hardware costs continue to decline, yet richer functionality - anonymous video analytics, programmatic ad trading, and headless CMS architectures - pushes the industry toward service-centric revenue models. North America remains the largest regional buyer, but legislated paper-label bans and dense 5G coverage give Asia Pacific the fastest expansion runway. Long-term opportunity rests on integrating content automation with loyalty data so messages stay fresh without ballooning creative budgets.
Key Report Takeaways
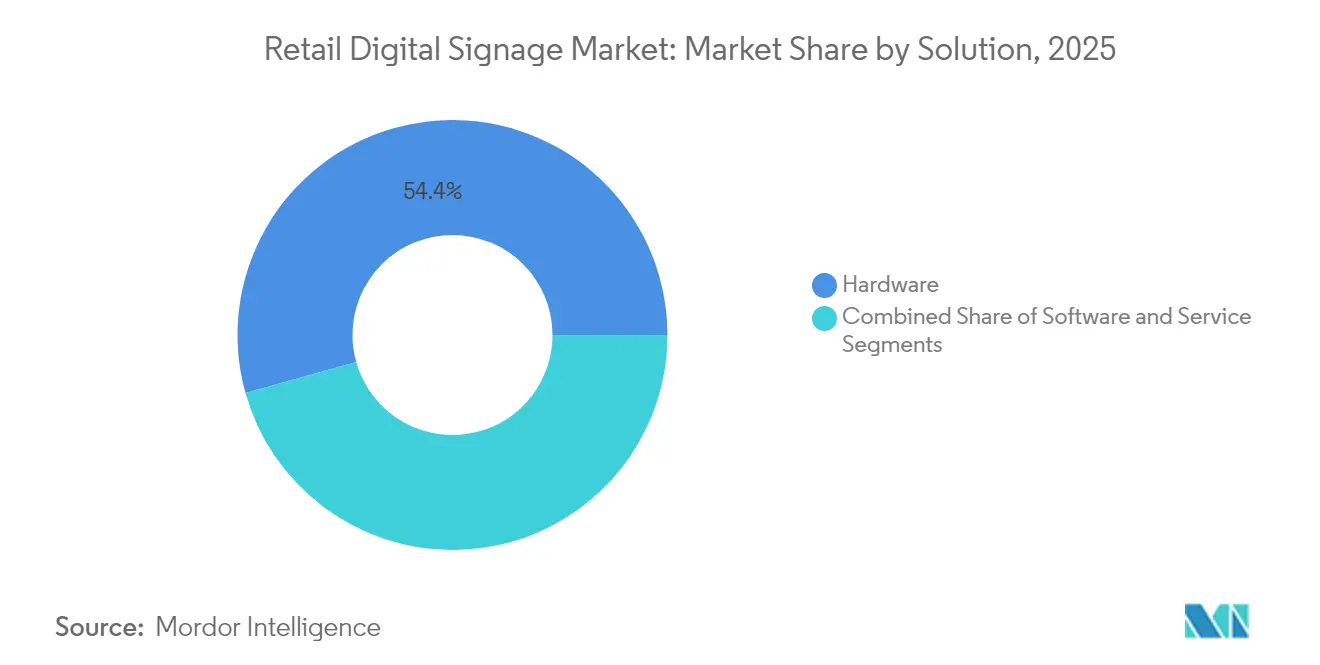
- By solution, hardware commanded 54.35% of the retail digital signage market share in 2025, while cloud software recorded the fastest CAGR at 6.66% through 2031.
- By retail format, hypermarkets and supermarkets led with 33.62% revenue share in 2025; QSR and restaurants are forecast to expand at a 7.09% CAGR to 2031.
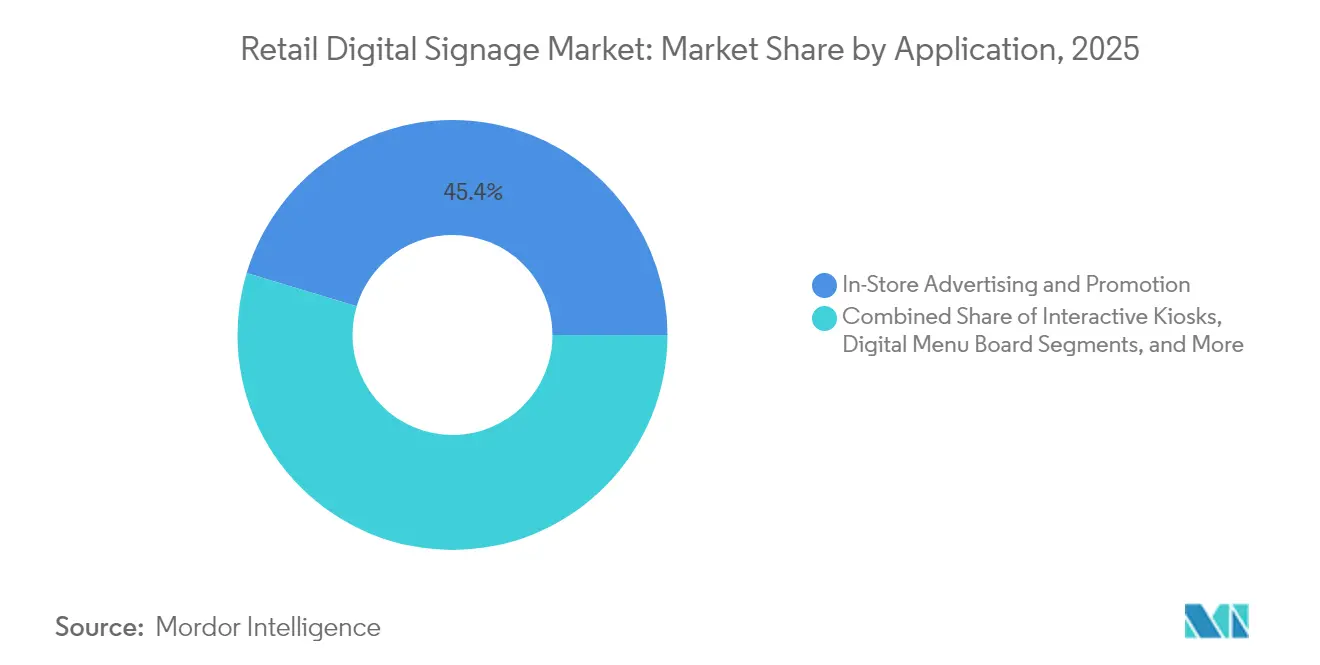
- By application, interactive and self-service kiosks accounted for 56.40% of the retail digital signage market size increase and are advancing at an 7.95% CAGR to 2031.
- By screen location, indoor placements held 70.25% of the retail digital signage market size in 2025; window and semi-outdoor displays are growing at a 9.22% CAGR through 2031.
- By geography, North America captured 37.45% of the retail digital signage market share in 2025, while Asia Pacific is set to grow at a 7.18% CAGR between 2026-2031.
Note: Market size and forecast figures in this report are generated using Mordor Intelligence’s proprietary estimation framework, updated with the latest available data and insights as of 2026.
Global Retail Digital Signage Market Trends and Insights
Drivers Impact Analysis*
| Driver | (~) % Impact on CAGR Forecast | Geographic Relevance | Impact Timeline |
|---|---|---|---|
| Growing adoption of IoT shelf-edge displays | +1.2% | Europe, spillover to North America | Medium term (2-4 years) |
| AI shopper analytics in department stores | +1.5% | North America, Western Europe | Medium term (2-4 years) |
| 5G private networks for UHD streaming | +0.8% | Asia Pacific | Short term (≤ 2 years) |
| LED video-wall cost decline | +0.6% | Middle East, Europe, North America | Short term (≤ 2 years) |
| Legislated phase-out of paper price labels in South Korean supermarkets boosting electronic shelf displays | +0.9% | South Korea, early spillover to Japan and Singapore | Short to medium term (1–3 years) |
| Revenue-share ad-network models in U.S. malls incentivising landlords to install programmatic signage | +1.1% | United States, gradual spillover to Canada | Medium term (2–4 years) |
| Source: Mordor Intelligence | |||
Growing adoption of IoT-enabled shelf-edge displays in European grocery chains
IoT shelf-edge displays now represent the single largest line item in many European grocers’ digital budgets. Networked tags sync with ERP systems to correct pricing errors in seconds, an efficiency gain that cuts manual ticketing labor by 85% and supports new transparency rules on nutritional data.[1]Telit, “IoT for Digital Signage in Retail,” telit.comLinking the displays to loyalty apps drives personalized promotions at the exact moment of choice; pilots show conversion lifts of 23% when offers flash beside the item. Return on investment accelerates as stores phase out paper, trim printing contracts, and repurpose staff for customer-facing tasks. Success in France and Germany is prompting U.S. big-box chains to test the same architecture in 2025, further scaling the retail digital signage market.
AI-driven shopper analytics fueling interactive signage roll-outs
Seventy-one percent of major U.S. retailers now pair cameras with edge AI to tailor content by age group, attention span, or engagement intensity.[2]Hughes Network Systems, “Digital Signage 2025 Trends,” hughes.com Personalization boosts dwell time by 40% and feeds data to merchandising teams that re-order in near real time. Compliance with GDPR and CPRA steers vendors toward anonymous vision processing that discards raw images after extracting metadata, a practice that keeps regulators satisfied while preserving insight depth. Department stores report daily sales lifts of 30% after deploying the technology chain-wide. As costs drop, mid-tier apparel chains are next in line, pushing the retail digital signage market toward experience-centric differentiation rather than price-led competition.
Rapid deployment of 5G private networks enabling real-time UHD content
Malls in China, Japan, and South Korea are installing private 5G slices that guarantee 20 Gbps downlink and sub-10 ms latency.[3]T-Mobile US, “Digital Signage with 5G,” t-mobile.com Retailers stream 8K video, trigger holographic overlays, and update pricing bundles every few minutes without taxing public bandwidth. Early adopters register 400% more screen views versus static posters and lift featured-product conversion by 27%. Dedicated spectrum also lets IT teams cordon off mission-critical POS traffic, tightening security. With operators offering managed-service pricing, even mid-sized centers can future-proof their networks, propelling Asia Pacific to the steepest CAGR in the retail digital signage market.
LED video-wall cost decline triggering luxury-retail window installations
Falling LED costs - now under USD 800 per m² - have unlocked digital façades for labels that once favored hand-dressed vitrines. Stores swap seasonal print campaigns for programmable canvases refreshed three times daily, a cadence that keeps passers-by curious and lifts footfall by 17%. High-brightness modules withstand direct sun, enabling prime street locations in Dubai and New York to run vivid motion graphics year-round. The shift reallocates budget from recurring print to a one-time capital outlay, shortening payback periods and enlarging the addressable slice of the retail digital signage market.
Restraints Impact Analysis*
| Restraint | (~) % Impact on CAGR Forecast | Geographic Relevance | Impact Timeline |
|---|---|---|---|
| High retrofit CAPEX for legacy convenience-store chains in Latin America | -0.7% | Latin America, parts of Southeast Asia | Medium term (2-4 years) |
| Content-refresh cost fatigue among mid-sized European retailers | -0.5% | Europe, North America | Short term (≤ 2 years) |
| GDPR / CPRA compliance limiting depth of in-store audience analytics | -0.3% | Europe, North America, global chains with presence in these regions | Medium term (2-4 years) |
| Semiconductor media-player supply shocks raising lead-times post-Taiwan quake | -0.2% | Global, with heightened impact in Asia Pacific | Short term (≤ 2 years) |
| Source: Mordor Intelligence | |||
High retrofit CAPEX for legacy convenience-store chains
Full-screen roll-outs can run USD 15,000–25,000 per outlet, a hurdle for fragmented C-store owners with thin margins. Financing is scarce, and economic volatility magnifies risk. Subscription models that shift spending from CAPEX to OPEX offer relief, yet operators worry about lock-in if local currencies fluctuate. The result is a digital divide: large chains wield dynamic pricing while independents stay static, slowing penetration in Latin America even as larger formats flourish.
Content-refresh cost fatigue among mid-sized European retailers
Once hardware is live, the bigger line item becomes creative. Agencies charge EUR 1,500–3,000 per campaign to localize spots for multi-country networks, straining budgets that underestimated ongoing needs. Some retailers stretch refresh cycles from weekly to monthly, dulling the very advantage of digital. AI template-generators promise 60% savings by remixing core assets into new iterations, but adoption hinges on proof that brand style guides stay intact. Until that tipping point, refresh fatigue remains a drag on the retail digital signage market.
*Our forecasts treat driver/restraint impacts as directional, not additive. The impact forecasts reflect baseline growth, mix effects, and variable interactions.
Segment Analysis
By Solution: Software gains momentum as hardware matures
The hardware stack retained a 54.35% share of the retail digital signage market in 2025, buoyed by lower LCD prices and OLED’s move into premium flagships. Media players increasingly ship as system-on-chip modules, trimming power draw and cabinet clutter. Samsung’s 2024 e-paper launch drew fresh interest in energy-stingy tags for shelf edges.
Cloud software, however, is advancing at a 6.66% CAGR to 2031 and is on track to overtake boxes in lifetime value. Retailers cherish dashboards that orchestrate content to thousands of endpoints in minutes and overlay anonymous analytics for proof of performance. Headless CMS designs decouple creative from device, funneling the retail digital signage market size toward recurring SaaS revenue rather than one-off installs. Expect mergers that fuse CMS, ad trading, and AI personalization into single platforms.


By Retail Format: QSRs accelerate digital menu-board adoption
Hypermarkets and supermarkets maintained the largest slice at 33.62%, using networked screens for wayfinding, impulse-buy promos, and dynamic markdowns tied to inventory buffers. Linking signage to ERP forces draws down overstock and spotlights substitutes when favorites sell out, a capability that lifts basket size.
QSRs lead growth at a 7.09% CAGR. Chains such as Wendy’s earmarked USD 35 million for AI-enhanced menu boards that upsell combos and tweak pricing by daypart, swelling average checks by 38%. Mall landlords, meanwhile, turn corridors into pDOOH ad networks on revenue-share terms, smoothing deployment risk and nudging more landlords into the retail digital signage market.
By Application: Interactive kiosks redefine customer engagement
In-store advertising still drove 45.35% of spending in 2025, but sophistication is rising: screens now call up weather-based content or redirect shoppers when SKUs go out of stock. Anonymous attention metrics feed A/B testing loops that optimize dwell time and choice architecture.
Interactive kiosks post the steepest gain at an 7.95% CAGR. Gen Z and millennial buyers - 57% prefer self-service - use kiosks for customizing sneakers, paying via digital wallets, and scheduling pickups. Retailers cut queue times and reassign labor to consultation roles, a twin benefit that expands the retail digital signage market.
By Screen Location: Window displays convert passers-by to customers
Indoor screens held 70.25% of deployments in 2025 and now sync with lighting and audio to craft multi-sensory vignettes. Placement near high-margin aisles lengthens dwell by up to 40%, directly boosting category sales.
Window and semi-outdoor units grow at a 9.22% CAGR, powered by 4,000-nit panels that remain legible at noon. Correctly executed façades raise store-entry rates by 24%; drive-thru displays extend the thesis outdoors, thriving on weather-proof enclosures and high refresh frequencies. The value proposition is strong enough that even mid-market apparel chains are joining the retail digital signage market wave.
By Screen Size: Mid-range displays offer optimal visibility-to-cost ratio
Screens between 32" and 55" dominate, balancing sightline effectiveness with acquisition cost. Commercial-grade panels last longer and justify 30–40% premiums via lower failure rates.
Sub-32" units proliferate at shelf edges for SKU-level messaging, while ≥55" canvases capture attention in atria. Large-format prices dropped 15% year-on-year in 2024, opening the door for experiential storytelling in mid-tier department stores. Ultra-wide 21:9 models create panoramic runways that anchor luxury flagship aesthetics, pushing creative teams to rethink aspect ratios and keep the retail digital signage market innovating.
Geography Analysis
North America commanded 37.45% of the retail digital signage market in 2025. Retailers view screens as omnichannel glue that ties mobile coupons, curbside pickup, and loyalty wallets into one journey. Programmatic DOOH lets malls auction impressions to ad buyers in real time, generating incremental revenue that offsets hardware costs. Privacy laws such as CPRA restrict face-level analytics, steering operators toward aggregated metadata or on-device anonymization. Despite the guardrails, AI adoption remains brisk, and cloud CMS penetration exceeds 75% among Fortune-500 chains, reinforcing the region’s lead.
Asia Pacific is the fastest climber at a 7.18% CAGR to 2031, propelled by dense 5G coverage and state mandates such as South Korea’s paper-label sunset. Chinese retailers fuse QR-based mobile payment with signage so shoppers can scan and buy without leaving the aisle, compressing funnel stages into seconds. Semiconductor shortages after Taiwan’s quake have eased, yet the episode convinced buyers to dual-source media players and panels, embedding resilience into future roll-outs. As domestic OEMs shorten lead times, local retailers gain a cost advantage that fuels further penetration and enlarges the retail digital signage market size.
Europe sits between the two poles, distinguished by stringent GDPR rules that force privacy-safe analytics architectures. IoT shelf-edge displays are ubiquitous in French hypermarkets, where they help satisfy nutritional labeling requirements and automate markdowns near best-by dates. High-resolution LED walls in Milan and Paris luxury districts translate couture storylines into moving art, resetting consumer expectations for storefront theatricality. The Middle East, though smaller, mirrors European luxury trends: Dubai and Riyadh malls increasingly specify digital façades in new-build standards, underscoring marquee status and injecting fresh volume into the regional retail digital signage market.

Competitive Landscape
The field is moderately fragmented. Samsung, LG, and Panasonic bundle panels, media players, and CMS frameworks, a vertical stack that secures roughly 30% of global display revenue for Samsung alone. BrightSign, Broadsign, and Scala lead pure-play software, capturing spend as value migrates from hardware margins to analytics subscriptions. Strategic tie-ups multiply: LG’s alliance with BrightSign ships screens pre-flashed with CMS, trimming deployment labor and accelerating time-to-content.
Differentiation now hinges on AI content automation that slashes creative spend and on ad-exchange connectors that monetize unused lobby screens during off-hours. Vendors positioning for growth layer augmented reality and gesture recognition atop traditional signage, targeting premium fashion and automotive showrooms. Components such as high-brightness LEDs and ruggedized media players are increasingly commoditized, so brand trust, service networks, and compliance readiness become deciding factors.
Emerging challengers pursue niche depth rather than breadth—focusing, for example, on QSR drive-thru logistics or grocery shelf analytics—while incumbents counter by acquiring specialized startups. With the top five firms holding around 45% of global revenue, buyer leverage remains healthy, encouraging multivendor strategies that keep pricing competitive and technology fresh within the expanding retail digital signage market.
Retail Digital Signage Industry Leaders
Samsung Electronics Co. Ltd
LG Display Co. Ltd
Panasonic Corporation
Planar Systems Inc.
Sharp Corporation
- *Disclaimer: Major Players sorted in no particular order

Recent Industry Developments
- May 2025: ScreenCom BV merged with Blue and Red BV, forming one of Europe’s largest end-to-end providers.
- March 2025: Poppulo added 600,000 licenses via acquisition, boosting reach into multi-location retail.
- March 2025: Samsung launched AI-enhanced interactive displays engineered for high-traffic stores.
- February 2025: LG debuted kinetic LED walls that transform portraits of passers-by into pop-art motifs.


Research Methodology Framework and Report Scope
Market Definitions and Key Coverage
Our study defines the retail digital signage market as all revenue generated from networked display hardware, software, and associated support services that are installed inside or immediately outside brick-and-mortar retail formats to stream promotional, informational, or interactive content. Screens deployed only for outdoor billboard advertising, printed signage, or corporate back-office communication are outside the scope.
Scope Exclusion: Freelance content-creation fees and generic out-of-home media buys fall beyond the market boundary.
Segmentation Overview
- By Solution
- Hardware
- Display Technology (LCD,LED, OLED, Projection, E-Paper)
- Media Players (Standalone, Networked, System-on-Chip)
- Projectors and Video Walls
- Other Hardware (Mounts, Enclosures)
- Software
- Deployment Model (On-premise, Cloud)
- Function (Content- and Device-Management, Audience Analytics, Scheduling and Distribution)
- Services
- Installation and Integration
- Managed Services
- Maintenance and Support
- Content Creation and Creative Services
- Hardware
- By Retail Format
- Hypermarkets and Supermarkets
- Department Stores
- Convenience and Forecourt Stores
- Specialty Stores
- Shopping Malls and Duty-Free
- QSR and Restaurants
- By Application
- In-Store Advertising and Promotion
- Interactive/Self-Service Kiosks
- Digital Menu Boards
- Product Information and Shelf-Edge Labels
- Wayfinding and Navigation Displays
- Queue-Management/Checkout Screens
- By Screen Location
- Indoor
- Window/Semi-Outdoor
- Outdoor (High-Brightness)
- By Screen Size
- Below 32 inch
- 32 inch - 55 inch
- Above 55 inch
- By Geography
- North America
- United States
- Canada
- Mexico
- Europe
- Germany
- United Kingdom
- France
- Italy
- Spain
- Russia
- Nordics
- Benelux
- Rest of Europe
- Asia-Pacific
- China
- Japan
- South Korea
- India
- Australia and New Zealand
- ASEAN
- Rest of Asia-Pacific
- South America
- Brazil
- Argentina
- Rest of South America
- Middle East and Africa
- Saudi Arabia
- United Arab Emirates
- Turkey
- South Africa
- Nigeria
- Kenya
- Egypt
- Rest of Middle East and Africa
- North America
Detailed Research Methodology and Data Validation
Primary Research
We interviewed display OEM product heads, retail IT managers in North America, Europe, and APAC, and service integrators that run multisite networks. Dialogues validated refurbishment cycles, service-contract penetration, and the typical payback retailers now target.
Desk Research
Mordor analysts first mined open datasets such as the US Census Bureau's Quarterly Retail E-Commerce Sales, Eurostat's retail trade series, and customs shipment records for LCD and LED display panels. Trade group white papers from the Digital Signage Federation, Interactive Customer Experience Association, and the Consumer Technology Association helped benchmark store-level screen densities. Company 10-Ks and investor decks for display vendors and major retailers provided ASP trends and roll-out cadence. Paid feeds from D&B Hoovers and Dow Jones Factiva enriched revenue splits and recent M&A signals. This roster is illustrative; a wider range of sources underpinned every datapoint used.
A follow-up scan of patent abstracts on Questel and tender notices on Tenders Info clarified emerging tech adoption and public-sector retail projects, sharpening our forward assumptions.
Market-Sizing & Forecasting
A top-down build began with national retail floor space and store counts, which are then multiplied by weighted screen density benchmarks to estimate installed units. Unit totals are valued using blended hardware plus first-year service ASPs. Select bottom-up checks, such as supplier roll-ups and sampled media-player shipments, are overlaid to tune totals. Key variables include display price index movements, store expansion rates by format, average contract length for managed services, refresh intervals, and regional electricity tariffs that influence TCO decisions. Five-year forecasts apply exponential smoothing on each variable and scenario analysis for macro retail sales swings, with coefficient tweaks vetted by our interview panel. Data gaps on boutique formats were bridged through proxy metrics (e.g. kiosk permits).
Data Validation & Update Cycle
Before release, another analyst cross-checks outputs against import volumes, listed-vendor revenues, and public pilot counts. Variances beyond 5 percent trigger re-runs. Reports refresh annually, with interim adjustments when sizable regulatory, pricing, or supply-chain events surface.
Why Mordor's Retail Digital Signage Baseline Commands Reliability
Published estimates often diverge because publishers choose different retail formats, component mixes, and currency bases.
Key gap drivers include whether refurbished screens are counted, if service revenue is annualized or booked up front, and how aggressively declining panel prices are baked into forecasts. Mordor reports a mid-case, current-year snapshot and updates variables every twelve months, whereas some providers lock in multi-year currency assumptions or combine retail with broader DOOH totals.
Benchmark comparison
| Market Size | Anonymized source | Primary gap driver |
|---|---|---|
| USD 5.89 B (2025) | Mordor Intelligence | - |
| USD 6.40 B (2024) | Global Consultancy A | Includes refurbished hardware and promotional giveaways, uses static 2024 FX rates |
| USD 22.38 B (2024) | Research Group B | Aggregates retail with mall DOOH and kiosk advertising, applies vendor list prices without ASP erosion |
The comparison shows that when scope and price erosion are carefully controlled, our figures remain the balanced middle ground that decision-makers can track year after year.


Key Questions Answered in the Report
What is the current value of the retail digital signage market?
The market stands at USD 6.24 billion in 2026 and is forecast to hit USD 8.29 billion by 2031.
Which region accounts for the largest share?
North America leads with 37.45% of 2025 revenue thanks to mature omnichannel strategies and programmatic DOOH adoption.
Which application is growing the fastest?
Interactive and self-service kiosks expand at an 7.95% CAGR as shoppers embrace contactless customization and payment.
How quickly are QSR digital menu boards expanding?
QSR deployments are advancing at a 7.09% CAGR, with AI-driven boards raising attachment rates by up to 38%.
What technology trend most influences future growth?
Private 5G networks enabling low-latency UHD streaming are pivotal, especially in dense Asian malls.
Are content costs falling?
AI template-generation tools promise up to 60% savings on creative production, but mainstream adoption is still unfolding.
Page last updated on:


