Used Cooking Oil Market Size and Share
Market Overview
| Study Period | 2021 - 2031 |
|---|---|
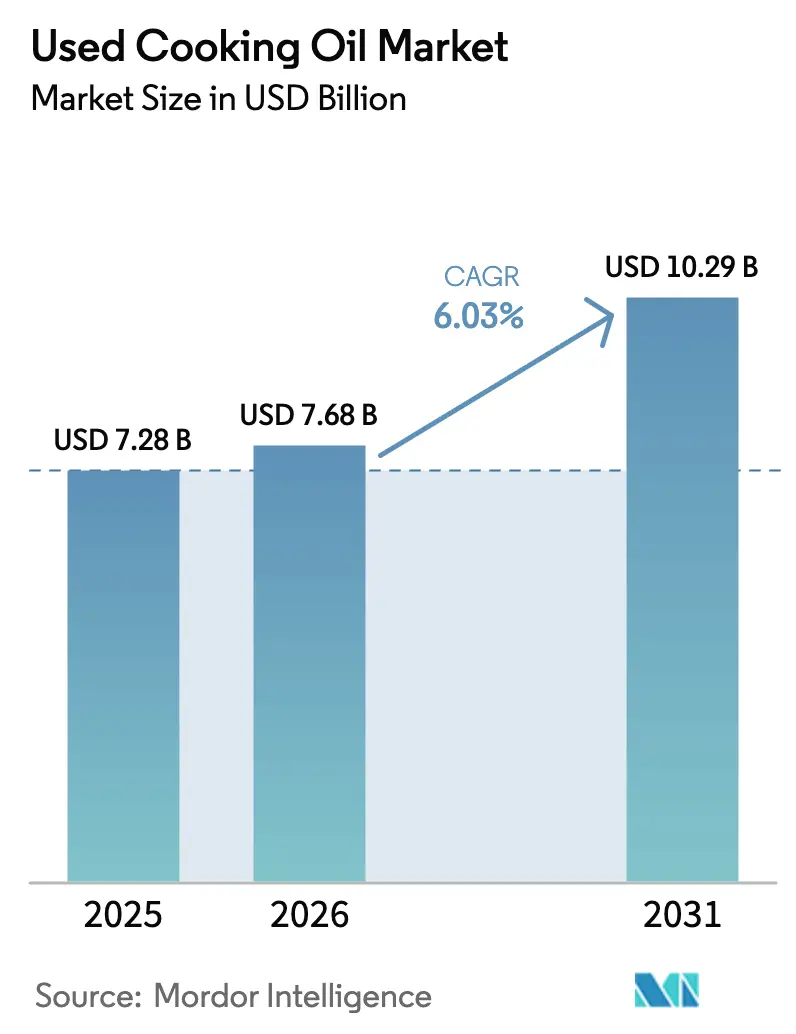
| Market Size (2026) | USD 7.68 Billion |
| Market Size (2031) | USD 10.29 Billion |
| Growth Rate (2026 - 2031) | 6.03% CAGR |
| Fastest Growing Market | Asia Pacific |
| Largest Market | Europe |
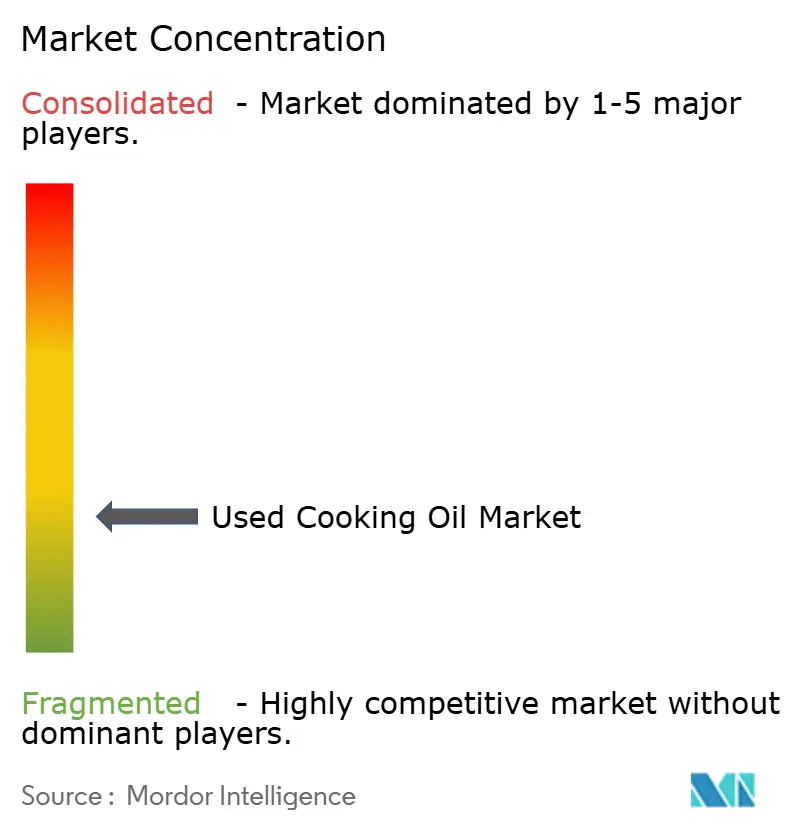
| Market Concentration | Low |
Major Players
*Disclaimer: Major Players sorted in no particular order Image © Mordor Intelligence. Reuse requires attribution under CC BY 4.0. |
|
Used Cooking Oil Market Analysis by Mordor Intelligence
The Used Cooking Oil Market size was valued at USD 7.28 billion in 2025 and is estimated to grow from USD 7.68 billion in 2026 to reach USD 10.29 billion by 2031, at a CAGR of 6.03% during the forecast period (2026-2031). Increasing mandates for sustainable aviation fuel (SAF), rising biodiesel quotas in road transport, and circular-economy regulations are shifting waste oils from being a disposal cost to becoming a valuable strategic feedstock. Airlines and refiners are entering multi-year offtake agreements in preparation for the 2030 blending deadlines. This trend is tightening supply and benefiting collectors who implement digital traceability solutions. While HoReCa chains remain the primary source of volume, municipalities are expanding curbside household collections to address the 30-40% recovery gap. Technology-driven aggregators, employing IoT sensors, blockchain for custody, and advanced multi-stage filtration, are improving yields and audit readiness, thereby capturing higher margins. Furthermore, refiners are drawn to the used cooking oil market due to feedstock arbitrage opportunities against volatile palm and soy oil prices, helping them maintain margins under credit schemes such as RFS, LCFS, and RED II.
Key Report Takeaways
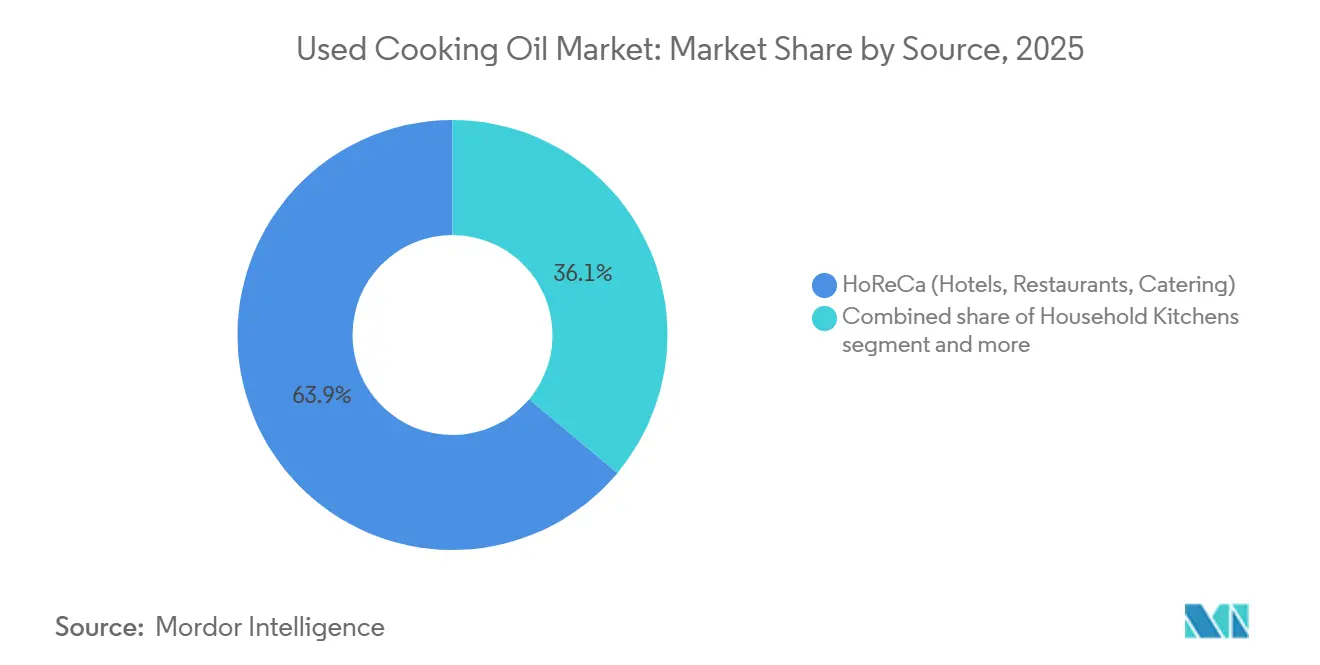
- By source, HoReCa commanded 63.92% of the used cooking oil market share in 2025, while household kitchens are projected to expand at a 6.89% CAGR through 2031.
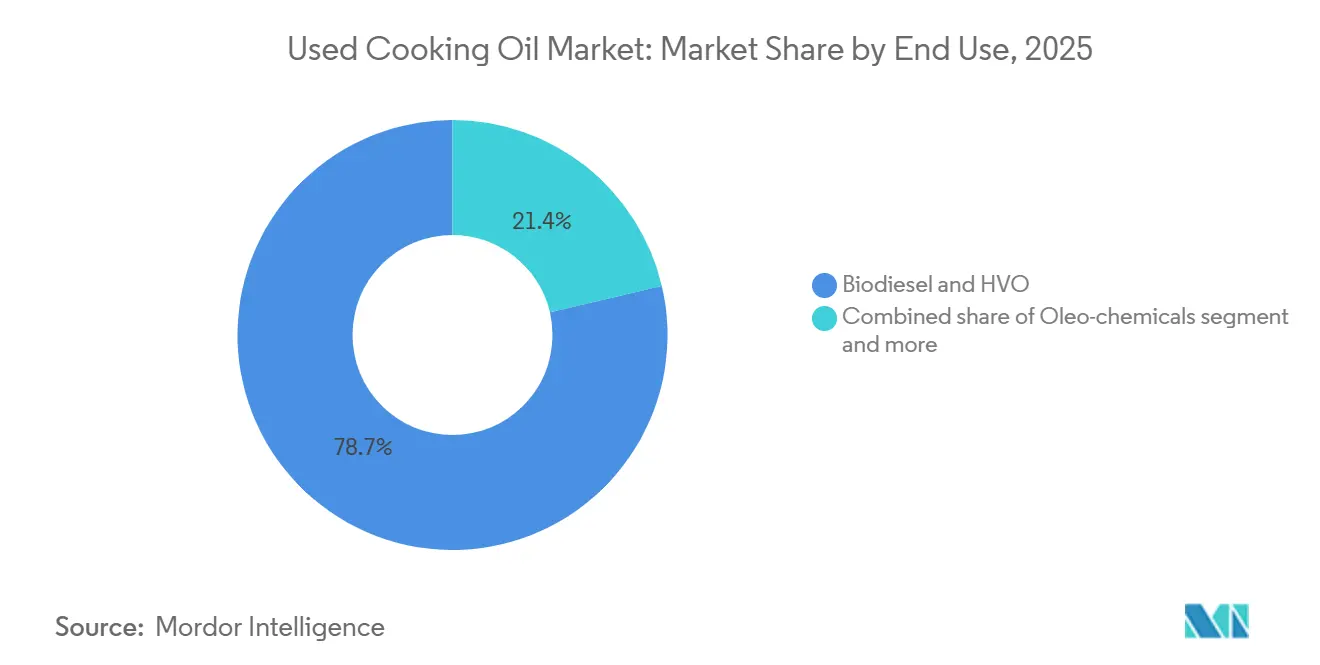
- By end use, biodiesel and HVO held 78.65% of the used cooking oil market size in 2025, whereas oleo-chemicals are forecast to grow at a 6.96% CAGR between 2026 and 2031.
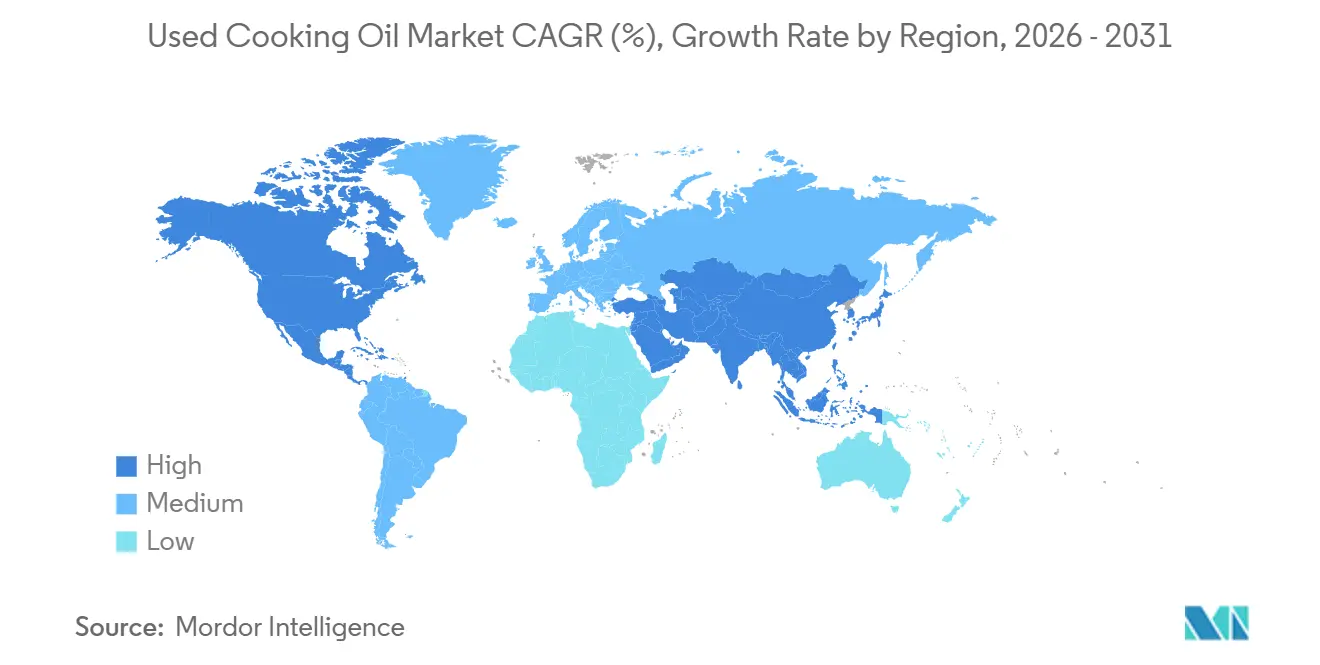
- By geography, Europe led with a 38.09% revenue share in 2025, and Asia-Pacific is poised to register a 7.13% CAGR to 2031.
Note: Market size and forecast figures in this report are generated using Mordor Intelligence’s proprietary estimation framework, updated with the latest available data and insights as of January 2026.
Global Used Cooking Oil Market Trends and Insights
Drivers Impact Analysis*
| Driver | (~) % Impact on CAGR Forecast | Geographic Relevance | Impact Timeline |
|---|---|---|---|
| Rising demand for biodiesel and other biofuels | +1.8% | Global, with concentration in North America, Europe, Brazil | Medium term (2-4 years) |
| Growing aviation-sector demand for sustainable aviation fuel | +2.1% | Global, led by Europe, Singapore, Thailand, UAE; spillover to North America and MEA | Long term (≥ 4 years) |
| Price competitiveness compared to virgin vegetable oils | +0.9% | Global, particularly Asia-Pacific and South America where palm and soy price volatility is acute | Short term (≤ 2 years) |
| Circular-economy and zero-waste regulations | +1.0% | Europe, North America, Japan, South Korea; emerging in China and India | Medium term (2-4 years) |
| Technological advancements in collection, filtration, and refining | +0.7% | Global, with early adoption in North America and Europe; diffusion to Asia-Pacific | Long term (≥ 4 years) |
| Digitalization of collection and logistics | +0.5% | North America, Europe, select Asia-Pacific cities (Singapore, Tokyo, Seoul) | Medium term (2-4 years) |
| Source: Mordor Intelligence | |||
Growing aviation-sector demand for sustainable aviation fuel
Regulatory changes in aviation are transforming the demand for Used Cooking Oil (UCO), influencing the entire waste-fat value chain. The ReFuelEU Aviation initiative mandates a 6% blending of Sustainable Aviation Fuel (SAF) by 2030, increasing to 70% by 2050. Singapore's SAF requirements will begin at 1% in January 2026 and rise to 3-5% by 2030, while Thailand has introduced a similar 1% mandate for 2026. These strict timelines are narrowing the feedstock sourcing windows, prompting airlines and fuel producers to finalize multi-year UCO offtake agreements, often ahead of the development of adequate collection infrastructure. According to the World Economic Forum, global production capacity for HEFA sustainable aviation fuels (SAF) reached 4.2 million metric tons in 2025[1]Source: World Economic Forum, "Sustainable Aviation Fuel and its Impact", weforum.org. In Thailand, PTTGC plans to expand its SAF capacity from 6 million liters to 24 million liters annually by 2027. Emirates and Etihad have signed offtake agreements with MENA Biofuels' Fujairah plant, which aims to produce 125 million liters of SAF annually using UCO and other waste fats. Japan's Cosmo Energy began supplying 30,000 kiloliters of UCO-derived SAF to Japan Airlines and All Nippon Airways in 2025, highlighting how markets with limited domestic UCO production are increasingly relying on imports to meet airline commitments. On the regulatory side, the European Union Aviation Safety Agency (EASA) and the International Civil Aviation Organization (ICAO), under the CORSIA framework, are standardizing sustainability criteria. This alignment has established ISCC PLUS certification as the leading standard for international UCO trade, while penalizing suppliers unable to verify waste-origin traceability.
Circular-economy and zero-waste regulations
Regulatory mandates are redefining Used Cooking Oil (UCO) from a disposal issue to a regulated and valuable commodity. The EU's Waste Framework Directive prioritizes reuse and recycling over incineration. Reflecting this, countries such as the UK and Germany have introduced extended producer-responsibility schemes. These initiatives require food-service operators to document UCO collection and recycling processes. In 2024, Japan's Ministry of the Environment updated its waste-management guidelines to incentivize municipal UCO collection. Similarly, South Korea incorporated cooking oils into its Extended Producer Responsibility (EPR) framework, aligning them with packaging-waste targets and supporting household-collection programs. In India, the Ministry of New and Renewable Energy (MNRE) launched the Repurpose Used Cooking Oil (RUCO) program to formalize UCO collection from hotels, restaurants, and households, directing it to biodiesel producers under the National Biofuel Policy's 5% blending target. In 2023, China's National Energy Administration (NEA) identified UCO as a priority feedstock in its biodiesel pilot notice, marking a shift from export-driven collection to domestic consumption. These regulatory frameworks are driving food processors and quick-service restaurant chains to establish reverse-logistics networks. While this increases collection costs, it also creates entry barriers for informal aggregators lacking certification infrastructure.
Price competitiveness compared to virgin vegetable oils
UCO's discount to virgin oils fluctuates with commodity cycles. In 2025, rising palm and soybean oil prices due to supply constraints caused feedstock arbitrage for UCO to tighten. Indonesia's B40 biodiesel mandate, requiring a 40% palm-oil blend in diesel, significantly reduced domestic palm supply available for export. This indirectly tightened UCO markets as European refiners competed for alternative feedstocks. The U.S. Department of Agriculture (USDA) reported a sharp increase in soybean-oil demand for renewable diesel during 2024-2025, which boosted crush margins and made UCO a more attractive option for producers aiming to sustain profitability under RIN and LCFS credit systems. This dynamic creates a countercyclical opportunity: when virgin-oil prices rise, UCO collection becomes more economically viable, but as prices stabilize, collectors face margin pressures unless they secure premium contracts tied to SAF mandates or circular-economy credits. This volatility highlights the need for long-term offtake agreements to shield UCO pricing from spot vegetable-oil market fluctuations.
Technological advancements in collection, filtration, and refining
Refinery economics are increasingly shifting in favor of used cooking oil (UCO) over first-generation feedstocks, driven by advancements in hydrotreating and co-processing technologies. Eni's biorefineries in Priolo and Gela, Italy, co-process UCO with animal fats and other waste oils. This approach ensures compliance with RED II while producing hydrotreated vegetable oil (HVO) that meets EN 15940 diesel specifications. Pertamina, Indonesia's state-owned oil and gas company, operates a biorefinery in Cilacap with a capacity of 1,400 kiloliters per day. They blend 2-3% UCO into their feedstock, targeting the production of 1 million kiloliters of bioaviation fuel by 2030. Verbio has commercialized nonanoic acid dimethyl ester (9-DAME), derived from UCO. This product acts as a direct replacement for fossil-based plasticizers and lubricants, offering a high-margin opportunity for oleo-chemical producers capable of managing UCO's variable free-fatty-acid (FFA) content. Filtration advancements are minimizing purification losses. According to ISCC guidance, UCO typically contains 10-30% impurities. However, multi-stage centrifugation combined with enzymatic pre-treatment can recover an additional 5-8% of usable oil, improving collector economics. The U.S. Energy Information Administration (EIA) reported that biodiesel production in the U.S. reached 0.1 million barrels per day in December 2025[2]Source: U.S. Energy Information Administration, "Short-Term Energy Outlook", eia.gov.
Restraints Impact Analysis*
| Restraint | (~) % Impact on CAGR Forecast | Geographic Relevance | Impact Timeline |
|---|---|---|---|
| Collection and consumption gaps across supply chain | -1.2% | Global, acute in Asia-Pacific, South America, and MEA where informal disposal persists | Medium term (2-4 years) |
| Quality variability and certification challenges | -0.8% | Global, particularly in regions with fragmented collection networks (Asia-Pacific, MEA) | Short term (≤ 2 years) |
| Export-tariff hikes amid SAF feedstock competition | -0.6% | China, select EU member states; spillover to North America and Asia-Pacific import markets | Short term (≤ 2 years) |
| Dependence of UCO economics on policy incentives | -0.9% | Global, with highest exposure in North America (RFS/LCFS), Europe (RED II), and Brazil (RenovaBio) | Long term (≥ 4 years) |
| Source: Mordor Intelligence | |||
Collection and consumption gaps across supply chain
In emerging markets, approximately 30-40% of used cooking oil (UCO) remains uncollected due to informal disposal practices and inadequate aggregation infrastructure. This limits feedstock availability despite the rising demand for sustainable aviation fuel (SAF) driven by increasing mandates. In India, the RUCO program highlighted collection gaps in tier-2 and tier-3 cities, where restaurants and households lack access to certified collectors. To address this, the Ministry of New and Renewable Energy is piloting municipal partnerships to establish drop-off points. In China, the collection system is fragmented, with small-scale aggregators dominating the landscape. These aggregators often sell to informal biodiesel producers or animal-feed mills, making traceability challenging. The 2024 export tariff increase was partially introduced to promote domestic formalization. In Southeast Asia, household UCO generation remains largely untapped. While Japan and South Korea have launched curbside collection trials, participation rates remain below 20% due to consumer inconvenience and limited awareness. In Europe, mature HoReCa networks often obscure household-collection deficiencies. For example, the UK's Department for Environment, Food and Rural Affairs (Defra) estimates that only 15-20% of household UCO is formally collected, with the rest disposed of through sewers or municipal waste. Bridging these collection gaps requires substantial investments in logistics, including dedicated collection vehicles, storage tanks, and digital tracking systems. However, many municipalities and small collectors cannot afford these investments without subsidies or extended producer-responsibility mandates.
Quality variability and certification challenges
UCO's heterogeneous composition, FFA content ranging from 2% to over 30%, along with moisture, particulates, and residual food solids, creates challenges in refining and certification. The ISCC PLUS version 3.4.2 requires chain-of-custody documentation from the point of generation to final conversion. Additionally, auditors increasingly demand laboratory analyses to verify the waste's origin and ensure it is not adulterated with virgin oils. Collectors sourcing from multiple small suppliers face higher audit costs and risk rejection if any batch fails to meet FFA or contamination thresholds. The European Commission's RED II sustainability criteria mandate that UCO must be classified as waste under Annex IX, Part B, but enforcement varies across member states. Some refiners have encountered customs disputes when importing UCO from non-EU countries with less stringent waste definitions. In Brazil, the ANP implemented fraud-detection protocols under RenovaBio after identifying cases of virgin soybean oil being mislabeled as UCO to claim higher carbon-intensity credits. This measure tightened certification requirements but also raised compliance costs for legitimate collectors. Quality variability further limits end-use flexibility: while HVO refineries can handle higher FFA levels through hydrotreating, first-generation biodiesel (FAME) producers require pre-treatment. Oleo-chemical applications demand even stricter specifications, fragmenting the market and reducing liquidity for lower-grade UCO.
*Our forecasts treat driver/restraint impacts as directional, not additive. The impact forecasts reflect baseline growth, mix effects, and variable interactions.
Segment Analysis
By Source: HoReCa Anchors Volume, Household Gains Momentum
In 2025, centralized kitchens and predictable volumes allowed HoReCa sites to lead the used cooking oil market, contributing 63.92% of the market size. These sites also proved to be the most cost-efficient feedstock for collectors. Quick-service restaurant chains have implemented standardized disposal procedures. By entering into multi-year contracts, they have effectively restricted auditor access to the supply chain, ensuring consistent certification. Additionally, industrial caterers at airports and hospitals support baseline flows, while food processors are incorporating oil recovery lines to reduce waste. Despite these developments, HoReCa networks in the Asia-Pacific region remain fragmented. However, state pilot programs in China and India are working to consolidate these volumes into formalized systems.
Household kitchens, expected to grow at a CAGR of 6.89% from 2026 to 2031, are set to become the next significant area for volume growth. Municipalities in Japan, South Korea, and the UK are actively engaging residents by providing sealable containers for used cooking oil and scheduling curbside pickups alongside glass and paper collections. Although this dispersed feedstock has lower FFA, making it suitable for oleo-chemical intermediates, its collection cost per liter is 2-3 times higher than that of HoReCa. Blockchain applications now enable residents to scan QR codes to log their deposits, offering collectors a verifiable chain of custody essential for ISCC PLUS eligibility. Food-processing plants, occupying a stable middle ground, sometimes direct their used cooking oil to their own biodiesel units, helping to stabilize seasonal variations in collector volumes.


By End Use: Biodiesel and HVO Dominate, Oleo-Chemicals Diversify
In 2025, biodiesel and HVO emerged as the dominant segments in the used cooking oil market, accounting for 78.65% of the market share. This significant growth was driven by regulatory incentives, including the U.S. Renewable Fuel Standard (RFS), California's Low Carbon Fuel Standard (LCFS), and Europe's double-counting credits, which encourage the use of renewable feedstocks. The higher profitability of UCO compared to soybean oil pathways, supported by D4 RIN premiums, further bolstered its adoption. Additionally, HVO's compliance with EN 15940 standards eliminates the 7% FAME blend cap, enhancing its compatibility and market potential. Companies like Neste and Eni are strategically shifting their supply chains toward sustainable aviation fuel (SAF) to align with ReFuelEU targets. This transition has resulted in a substantial reallocation of UCO tonnage, moving away from road diesel applications and into the aviation sector.
The oleo-chemicals segment is forecast to grow at a compound annual growth rate (CAGR) of 6.96% through 2031, driven by the monetization of UCO's fatty-acid profile in high-value applications. These include products such as nonanoic acid dimethyl ester and bio-based lubricants, which command higher margins. Specialty refiners are increasingly accepting wider free fatty acid (FFA) ranges, providing an outlet for lower-grade UCO batches, particularly during periods of reduced demand in fuel markets. In the cosmetics industry, brands are leveraging UCO-derived glycerin to enhance the renewable content in personal-care products. This diversification of demand not only expands the market for UCO but also helps stabilize prices, which are often influenced by fluctuations in policy-driven credits.
Geography Analysis
In 2025, Europe accounted for 38.09% of global revenue, driven by key regulatory frameworks and infrastructure. The UK's Renewable Transport Fuel Obligation (RTFO), Germany's Greenhouse Gas (GHG) quota, and the Netherlands' role as a trans-shipment hub were significant contributors to this performance. In 2024, the RTFO's double crediting mechanism incentivized the production of 1 billion liters of fuels derived from used cooking oil (UCO). Additionally, the ReFuelEU Aviation initiative redirected future UCO supplies towards jet fuel applications, thereby reducing the availability of UCO for road-diesel blending. Efforts to improve residential UCO recovery rates, currently at 15-20%, are underway through household pilot programs in Sweden, Denmark, and the UK. However, the scalability of these initiatives depends heavily on the availability of municipal funding.
Asia-Pacific is positioned as the primary growth driver in the market, with a compound annual growth rate (CAGR) of 7.13% projected through 2031. Singapore's introduction of a 1% Sustainable Aviation Fuel (SAF) mandate starting in 2026, Thailand's significant capacity expansion, and China's strategic shift towards domestic blending are reshaping the region's market dynamics. In India, the Repurpose Used Cooking Oil (RUCO) initiative is formalizing contracts with the HoReCa (Hotels, Restaurants, and Catering) sector to streamline UCO collection. Japan's Cosmo Energy is demonstrating a model for import-driven SAF supply. RUCO agencies in Karnataka, India, reported the collection of 32,68,990 liters of used cooking oil during the financial years 2024-25 and 2025-26[3]Source: RUCO: Repurpose Used Cooking Oil, "Karnataka collects 32.68 lakh litres of used oil", eatrightindia.gov.in. Meanwhile, Indonesia and Australia are leveraging the growing regional demand for SAF by establishing partnerships with Southeast Asian UCO collectors.
North America continues to rely on the Renewable Fuel Standard (RFS) and Low Carbon Fuel Standard (LCFS) incentives, which reward low-carbon fuel pathways. In Canada, the Clean Fuel Regulations add an additional layer of provincial credits to support the adoption of sustainable fuels. In Brazil, the B14 biodiesel mandate, combined with stringent fraud-control protocols, has resulted in a reduced export supply of UCO to Europe. In the Middle East, the UAE and Saudi Arabia are developing SAF production hubs, with a collective target of producing 475 million liters by 2029. These hubs depend on the import of UCO from regions such as Africa and South Asia. In South Africa, municipal UCO collection pilot programs are being tested, but the lack of robust policy support remains a significant challenge to their success.

Competitive Landscape
The used cooking oil market is fragmented, characterized by the presence of both large integrated players and numerous smaller collectors and processors. Prominent companies operating in this market include Darling Ingredients Inc., Baker Commodities Inc., Veolia Environnement SA, Olleco (a subsidiary of ABP Food Group), and Restaurant Technologies Inc. Leading players such as Darling Ingredients, Neste, and Veolia implement vertical integration strategies that encompass the entire supply chain, from collection to processing and distribution. This approach enables them to maximize value capture, maintain stringent quality control, and ensure compliance with regulatory standards.
Adopting advanced technologies has emerged as a critical factor in differentiating market leaders. For example, Darling Ingredients' DarLinQ system provides real-time monitoring and traceability for used cooking oil (UCO), addressing key challenges such as fraud prevention and quality assurance. The competitive landscape is increasingly shaped by consolidation trends, particularly affecting independent collectors. These smaller entities face mounting challenges, including higher regulatory compliance costs and operational complexities, which create a competitive advantage for larger, well-capitalized players.
Significant opportunities remain in optimizing collection networks, particularly for households and small commercial generators, where current systems often fail to achieve optimal capture rates. Emerging disruptors, including technology-driven companies, are introducing innovative solutions such as blockchain-based traceability systems and IoT-enabled collection technologies. These advancements have the potential to democratize market access, allowing smaller participants to compete more effectively. Additionally, ongoing patent activity in advanced processing technologies highlights a strong focus on innovation. Techniques such as integrated catalytic cracking and hydrotreating methods, which achieve over 90% oxygen removal while reducing hydrogen consumption, demonstrate a continued emphasis on improving conversion efficiency and lowering operational costs.
Used Cooking Oil Industry Leaders
-
Darling Ingredients Inc.
-
Baker Commodities Inc.
-
Veolia Environnement SA
-
Olleco (ABP Food Group)
-
Restaurant Technologies Inc.
- *Disclaimer: Major Players sorted in no particular order

Recent Industry Developments
- March 2026: Al Mana Holding, a Qatar-based company, has increased its biodiesel production by recycling used cooking oil through a newly established processing facility. Located in the integrated waste management zone of Tenth of Ramadan City, the facility can process up to 100 tonnes of waste cooking oil daily. The collected oil will be converted into renewable fuel.
- February 2025: Olleco inaugurated a new state-of-the-art used cooking oil processing plant in Liverpool, UK. The advanced facility refines UCO collected from multiple sources and efficiently transports it via pipeline to Olleco's dedicated biodiesel plant. The high-quality biodiesel produced achieves an impressive 89% carbon reduction compared to conventional fossil diesel and effectively serves transport fleets and fuel forecourts. This innovative facility demonstrates Olleco's strong commitment to environmental sustainability through systematic waste-to-resource conversion in the circular economy.
- December 2024: Spanish company Moeve (formerly Cepsa) is constructing a large-scale second-generation biofuels plant in Huelva, Andalusia. The advanced facility will process 600,000 tonnes of used fats, oils, and other waste materials annually into premium HVO biodiesel and sustainable aviation fuel, representing approximately 1% of Europe's total aviation fuel consumption.


Global Used Cooking Oil Market Report Scope
Used cooking oil (UCO) refers to edible plant or animal-based oils and fats that have been used for frying or cooking, becoming unsuitable for consumption. The used cooking oil market report is segmented by source, end use, and geography. By source, the market is segmented into HoReCa, household kitchens, and food processing plants. By end use, the market is segmented into biodiesel and HVO, oleo-chemicals, animal feed, and others. By geography, the market is segmented into North America, South America, Europe, Asia-Pacific, the Middle East, and Africa. For each segment, the market forecasts are provided in terms of value (USD) and volume (units).
| HoReCa (Hotels, Restaurants, Catering) |
| Household Kitchens |
| Food Processing Plants |
| Biodiesel and HVO |
| Oleo-chemicals |
| Animal Feed |
| Others (Cosmetics, etc.) |
| North America | United States |
| Canada | |
| Mexico | |
| Rest of North America | |
| South America | Brazil |
| Argentina | |
| Colombia | |
| Chile | |
| Rest of South America | |
| Europe | United Kingdom |
| Germany | |
| France | |
| Italy | |
| Spain | |
| Russia | |
| Sweden | |
| Belgium | |
| Poland | |
| Netherlands | |
| Rest of Europe | |
| Asia-Pacific | China |
| Japan | |
| India | |
| Thailand | |
| Singapore | |
| Indonesia | |
| South Korea | |
| Australia | |
| New Zealand | |
| Rest of Asia-Pacific | |
| Middle East and Africa | United Arab Emirates |
| South Africa | |
| Saudi Arabia | |
| Nigeria | |
| Egypt | |
| Morocco | |
| Turkey | |
| Rest of Middle East and Africa |
| By Source | HoReCa (Hotels, Restaurants, Catering) | |
| Household Kitchens | ||
| Food Processing Plants | ||
| By End Use | Biodiesel and HVO | |
| Oleo-chemicals | ||
| Animal Feed | ||
| Others (Cosmetics, etc.) | ||
| By Geography | North America | United States |
| Canada | ||
| Mexico | ||
| Rest of North America | ||
| South America | Brazil | |
| Argentina | ||
| Colombia | ||
| Chile | ||
| Rest of South America | ||
| Europe | United Kingdom | |
| Germany | ||
| France | ||
| Italy | ||
| Spain | ||
| Russia | ||
| Sweden | ||
| Belgium | ||
| Poland | ||
| Netherlands | ||
| Rest of Europe | ||
| Asia-Pacific | China | |
| Japan | ||
| India | ||
| Thailand | ||
| Singapore | ||
| Indonesia | ||
| South Korea | ||
| Australia | ||
| New Zealand | ||
| Rest of Asia-Pacific | ||
| Middle East and Africa | United Arab Emirates | |
| South Africa | ||
| Saudi Arabia | ||
| Nigeria | ||
| Egypt | ||
| Morocco | ||
| Turkey | ||
| Rest of Middle East and Africa | ||


Key Questions Answered in the Report
How large will the used cooking oil market be by 2031?
It is projected to reach USD 10.29 billion by 2031, expanding at a 6.03% CAGR from 2026.
Which source segment grows fastest over 2026-2031?
Household kitchens lead with a forecast 6.89% CAGR as municipalities roll out curbside programs.
Why does aviation influence used cooking oil demand?
SAF mandates such as ReFuelEU Aviation and Singapore’s 1% blending rule redirect UCO toward jet fuel, tightening supply for other sectors.
What share do biodiesel and HVO occupy today?
They captured 78.65% of 2025 revenue and remain the dominant outlet for certified UCO volumes.
Page last updated on:


