Market Overview
| Study Period | 2020 - 2031 |
|---|---|
| Forecast Data Period | 2026 - 2031 |
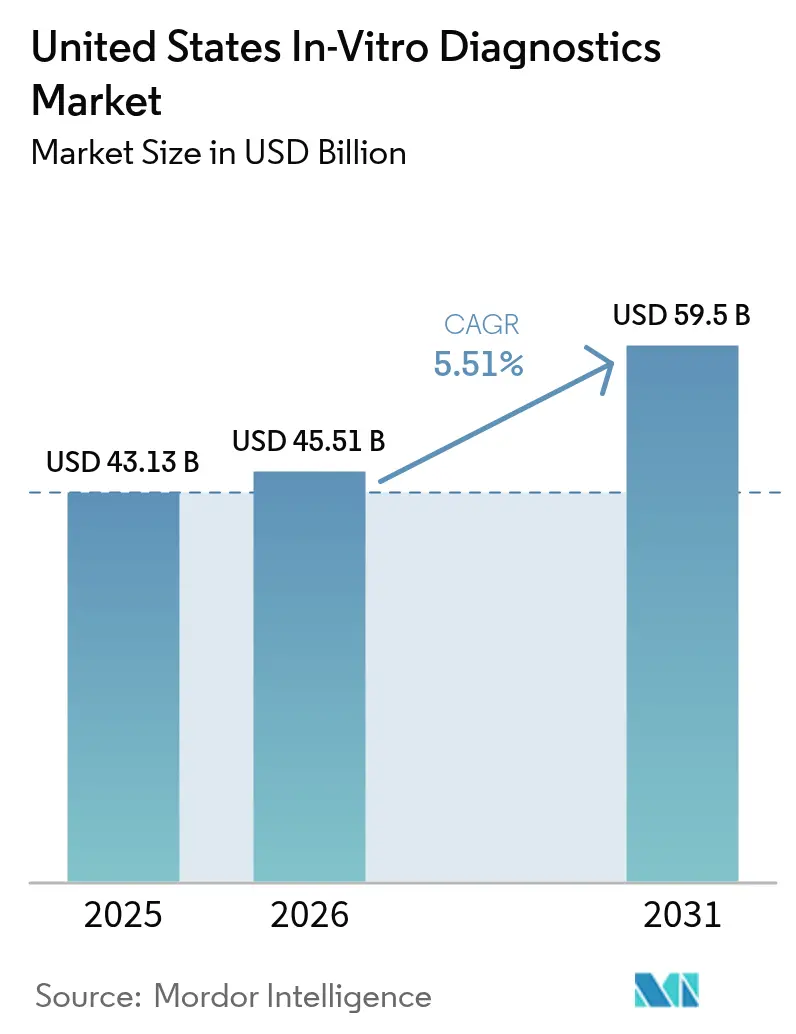
| Base Year Market Size (2025) | USD 43.13 Billion |
| Market Size (2026) | USD 45.51 Billion |
| Market Size (2031) | USD 59.5 Billion |
| Growth Rate (2026 - 2031) | 5.51% CAGR |
| Market Concentration | Medium |
Major Players *Disclaimer: Major Players sorted in no particular order Image © Mordor Intelligence. Reuse requires attribution under CC BY 4.0. | |
United States In-Vitro Diagnostics Market Analysis by Mordor Intelligence
The United States In-Vitro Diagnostics Market size was valued at USD 43.13 billion in 2025 and is estimated to grow from USD 45.51 billion in 2026 to reach USD 59.5 billion by 2031, at a CAGR of 5.51% during the forecast period (2026-2031).
Regulatory changes, CMS's reimbursement for next-generation sequencing panels, and AI adoption in healthcare are driving market shifts. The FDA's May 2024 rule on laboratory-developed tests (LDTs) mandates pre-market reviews for high-risk assays, pushing smaller labs to invest in compliance or reduce offerings. CMS's reimbursement of USD 2,989.55 for Illumina's TruSight Oncology Comprehensive panel in January 2026 underscores payer support for genomic profiling, boosting demand for molecular, digital, and point-of-care technologies that enhance efficiency and integrate with electronic health records.
Testing is expanding to hospitals, retail pharmacies, and homes, driven by FDA approval of over-the-counter multiplex respiratory panels in October 2024 and Medicare Advantage coverage for direct-to-consumer genetic services. Manufacturers are combining reagent sales with subscription-based software for AI-driven auto-verification, cybersecurity, and predictive maintenance. Key players are investing heavily, with Thermo Fisher expanding its Massachusetts campus by USD 650 million and BD acquiring Edwards Lifesciences' Critical Care division for USD 4.2 billion. These moves reflect reshoring and vertical integration trends to secure supply chains and link diagnostics with therapeutics. Rising cybersecurity threats, such as the Change Healthcare ransomware attack in February 2024, are prompting labs to invest in network security, making these costs a standard part of new instrument purchases.
Key Report Takeaways
- By test type, molecular diagnostics held 26% of the United States in-vitro diagnostics market share in 2025 and is projected to grow at a 7.43% CAGR to 2031, the fastest among all modalities.
- By product category, reagents and kits accounted for 61.78% of the United States in-vitro diagnostics market size in 2025, while software and services are forecast to expand at 7.88% annually through 2031.
- By usability, reusable analyzers posted an 8.65% CAGR for 2026-2031, outpacing disposable cartridges that nevertheless retained 65.05% revenue share in 2025.
- By application, oncology diagnostics are advancing at an 8.43% CAGR to 2031, whereas infectious diseases commanded 35.12% revenue share in 2025.
- By end user, hospital-based laboratories accounted for 45.03% of 2025 revenue, yet home-care and self-testing channels are expected to grow by 6.43% each year through 2031.
Note: Market size and forecast figures in this report are generated using Mordor Intelligence’s proprietary estimation framework, updated with the latest available data and insights as of 2026.
United States In-Vitro Diagnostics Market Trends and Insights
Drivers Impact Analysis*
| Driver | (~) % Impact on CAGR Forecast | Geographic Relevance | Impact Timeline |
|---|---|---|---|
| Rising Burden of Chronic and Infectious Diseases | +1.2% | National, acute pressure in rapidly aging Sun Belt states | Medium term (2-4 years) |
| Growing Adoption of Point-of-Care and Home Testing | +1.5% | National, strongest in large metros and rural telehealth corridors | Short term (≤ 2 years) |
| Technological Advancements in Molecular and Companion Diagnostics | +1.8% | National, concentrated in academic medical centers and integrated delivery networks | Long term (≥ 4 years) |
| Government Screening Programs and Favorable Reimbursement | +0.9% | National, influenced by state-level Medicaid differences | Medium term (2-4 years) |
| Integration of Artificial Intelligence for Laboratory Automation | +1.1% | National, led by top reference labs and hospital systems | Medium term (2-4 years) |
| Domestic Manufacturing Shift for Supply-Chain Resilience | +0.6% | National, with clusters in Massachusetts, California, North Carolina | Long term (≥ 4 years) |
| Source: Mordor Intelligence | |||
Rising Burden of Chronic and Infectious Diseases
Diabetes cases grew to 38.4 million Americans in 2024, driving sustained demand for hemoglobin A1c, kidney function, and lipid assays. Respiratory syncytial virus and influenza spikes in 2024-2025 prompted emergency departments to adopt multiplex PCR panels that identify more than 20 pathogens within 90 minutes, reducing unnecessary antibiotic use by 18% in pilots. Broadening colorectal cancer screening to adults aged 45–49 added 19 million eligible lives and fueled the pipeline for non-invasive molecular screening[1]U.S. Preventive Services Task Force, “Colorectal Cancer Screening Recommendation 2024,” uspreventiveservicestaskforce.org. Public health labs processing sexually transmitted infections saw 7% higher volumes in 2025, prompting upgrades to automated nucleic-acid systems that run 500 samples per eight-hour shift. Point-of-care creatinine and urine-albumin meters increasingly guide chronic kidney disease referrals, showing 12% lower progression to dialysis in managed-care cohorts.
Growing Adoption of Point-of-Care and Home Testing
More than 400 over-the-counter diagnostics now carry FDA clearance, with the first dual influenza/COVID-19 home PCR test approved outside emergency provisions in October 2024. Retail chains installed hemoglobin A1c and lipid panel analyzers in 12,000 pharmacies by mid-2025, capturing 8% of diabetes monitoring previously routed to large reference labs. Medicare’s 2025 coverage of pharmacogenomic CYP450 panels trimmed antidepressant-related adverse events by 22% in early claims. Wearable biosensors cleared for sports in 2024 are being repurposed as clinical-grade devices for metabolic syndrome, and home INR monitoring for warfarin rose 14% in 2025 after Medicare Advantage plans removed copays.
Technological Advancements in Molecular and Companion Diagnostics
Guardant Health’s Shield liquid biopsy, FDA-approved in July 2024, achieved 83% sensitivity for advanced adenomas and offers a colonoscopy alternative for average-risk adults. CMS’s January 2026 price for Illumina’s 523-gene panel confirms payers will fund ultradeep sequencing. Companion diagnostics tied to antibody-drug conjugates expanded rapidly after 2024-2025 FDA approvals, creating a USD 1.2 billion testing niche directly linked to oncology drug launches. Circulating tumor-DNA minimal residual disease assays were included in colorectal and breast cancer guidelines in 2025, reducing unnecessary adjuvant chemotherapy by 68%. CRISPR-based diagnostics received a breakthrough designation for 30-minute antimicrobial resistance detection, compressing 48-hour culture windows.
Government Screening Programs and Favorable Reimbursement Policies
The Inflation Reduction Act now obliges Medicare to pay for annual low-dose CT lung scans in high-risk smokers, cascading into demand for biomarker reflex testing when nodules appear. California, New York, and Texas Medicaid plans aligned with 2024 CDC hepatitis C guidance, lifting nucleic-acid volumes 31%. FDA’s risk-based LDT framework clarified oversight for roughly 12,000 active assays, removing ambiguity that had discouraged investment. PAMA reauthorization left earlier 10% fee reductions in place despite laboratory lobbying, but labs adapted by optimizing assay menus. CDC’s Vaccines for Children program began point-of-care antibody verification in 2025, improving real-time immunization status in underserved areas.
Restraints Impact Analysis*
| Restraint | (~) % Impact on CAGR Forecast | Geographic Relevance |
|---|---|---|
| Stringent Regulatory Oversight and Compliance Costs | -0.8% | National, heavier burden on small and mid-sized labs |
| High Capital and Maintenance Costs of Advanced Analyzers | -0.5% | National, acute in rural and critical-access hospitals |
| Escalating Cybersecurity Threats to Connected Systems | -0.3% | National, concentrated in large hospital networks and reference labs |
| Volatility in Raw-Material Supply and Reagent Pricing | -0.4% | National, episodic shortages of specialty enzymes and antibodies |
| Source: Mordor Intelligence | ||
Stringent Regulatory Oversight and Compliance Costs
The April 2024 final rule phases out general enforcement discretion, requiring LDT makers to file pre-market submissions, maintain quality systems, and report adverse events. Compliance costs could reach USD 3.56 billion annually, hitting small specialty labs hardest. Stage 1 rules that take effect in May 2025 already force labs to formalize complaint files and device reports. Legal challenges by trade groups inject uncertainty, delaying investment decisions and slowing the roll-out of niche genetic panels that normally refresh market innovation cycles. Over the near term, registration bottlenecks trim the USA in-vitro diagnostics market CAGR.
High Capital and Maintenance Costs of Advanced Analyzers
High-throughput immunoassay systems, such as Roche cobas e 801, list at USD 250,000–450,000, with USD 35,000–60,000 yearly service, pushing five-year ownership above USD 500,000. Rural hospitals running <200 samples daily cannot justify the spend and default to send-outs that delay results 24-48 hours. NGS oncology platforms can exceed USD 1.2 million before bioinformatics, confining uptake to large academic centers. Reagent-rental deals reduce upfront cost but lock labs into three- to five-year contracts that limit technology switching.
*Our forecasts treat driver/restraint impacts as directional, not additive. The impact forecasts reflect baseline growth, mix effects, and variable interactions.
Segment Analysis
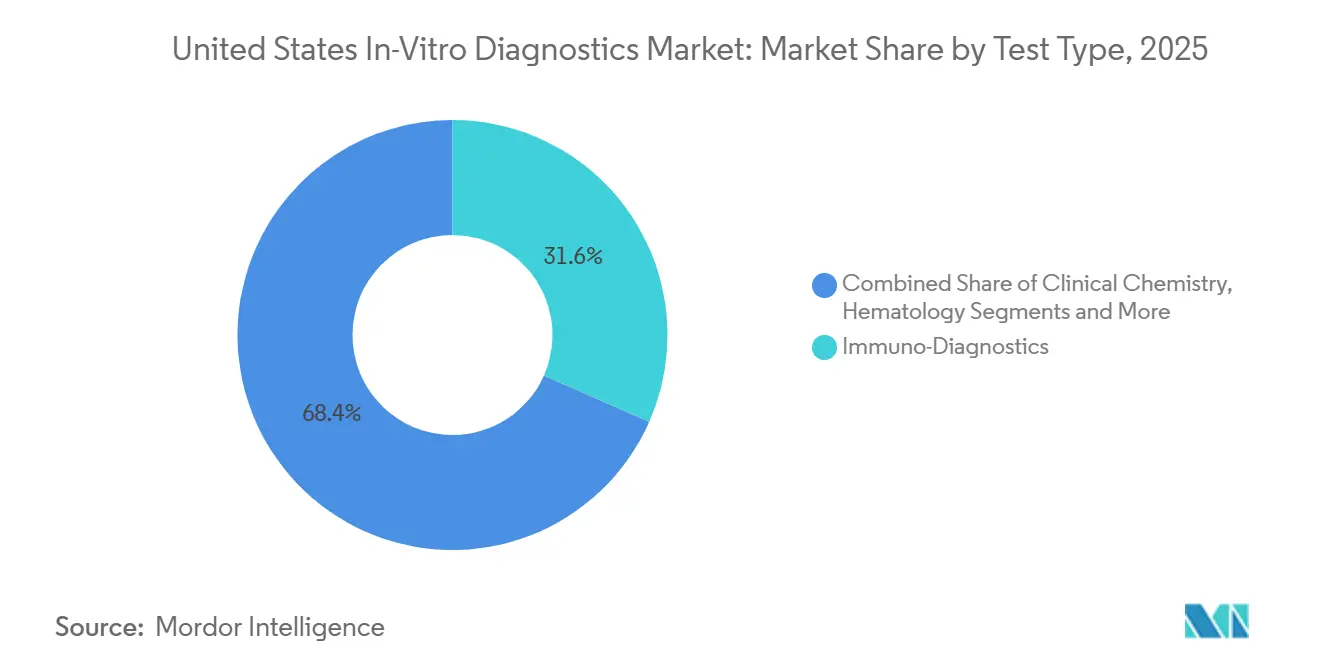
By Test Type: Molecular Diagnostics Outpaces Legacy Modalities
Molecular diagnostics accounted for USD 12.0 billion of the United States in-vitro diagnostics market in 2025 and is forecast to expand at a 7.43% CAGR to 2031, the fastest trajectory of any test category. The segment’s growth aligns with payer coverage for Illumina’s 523-gene oncology panel and with the FDA approval of Guardant Shield, the first blood-based average-risk colorectal screening test. Immuno-diagnostics retained 31.62% revenue share in 2025 owing to high-volume chemiluminescent assays, but price pressure from Medicare’s market-based fee schedule is slowing growth.
Multiplex PCR respiratory panels that identify 20 pathogens in 90 minutes underpin microbiology’s pivot from culture-based workflows, shaving up to 48 hours off result times. Hematology analyzers enjoy broad adoption, yet emergency-department point-of-care devices erode share for small-volume tests. CRISPR-based antimicrobial resistance assays under FDA breakthrough designation are expected to commercialize beyond 2027, adding incremental volume rather than displacing PCR outright. Clinical chemistry faces margin compression as commoditized metabolic panels intersect with PAMA-driven fee cuts.


By Product: Software and Services Capture Annuity Revenue
Reagents and kits dominated 61.78% of 2025 sales, but the software and services slice of the United States in-vitro diagnostics market is on track to expand 7.88% per year through 2031 as laboratories pay recurring fees for cybersecurity, AI analytics, and CLIA compliance dashboards. Siemens’ AI-Connect saved a median 34% in downtime across 200 sites, a dollar value universities leverage to justify subscription renewals.
Instruments face elongated replacement cycles, especially in cash-constrained rural hospitals, but reagent-rental deals keep unit placements steady. Cloud-based quality-control portals from Bio-Rad cut out-of-range events 18% and satisfy ISO 15189 digital audit trails. The United States in-vitro diagnostics market share for standalone middleware dipped as vendors bundle connectivity into instrument deals, yet high-volume reference labs still purchase third-party solutions to normalize multivendor fleets.
By Usability: Reusable Equipment Gains as Labs Consolidate
Reusable platforms captured 34.95% of 2025 revenue and are growing 8.65% annually as networks consolidate testing on high-throughput tracks capable of 2,100 samples per hour. Roche’s cobas pro enables one technologist to supervise workloads previously handled by three, mitigating staffing shortages.
Disposable cartridges dominate decentralized settings and retained 65.05% revenue share in 2025, but sustainability pressures have nudged manufacturers to pilot take-back programs. Cost economics also favor reusables for labs running >200 samples daily, where per-test prices fall to USD 2.50-4.00 compared with USD 12-18 for single-use cartridges. The United States in-vitro diagnostics market size advantage thus pivots on volume thresholds, reimbursement mix, and local labor availability rather than inherent technical superiority.
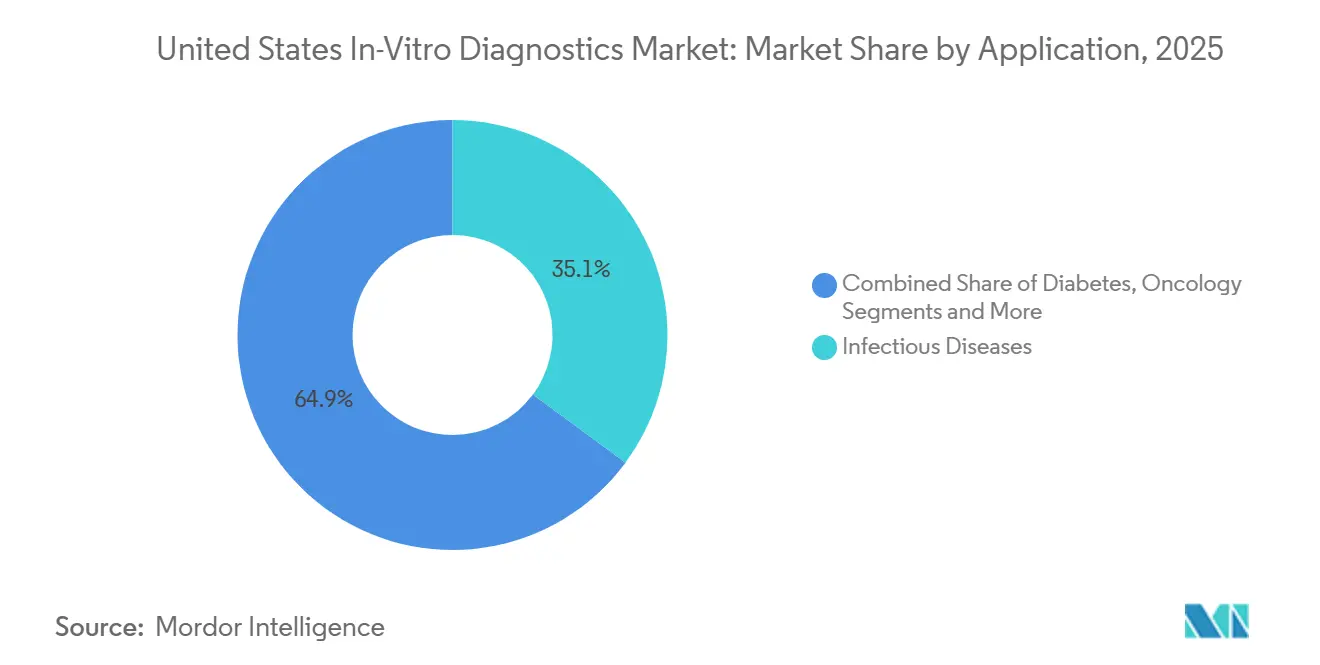
By Application: Oncology Diagnostics Lead Growth Trajectory
Oncology accounted for just under USD 8.0 billion in 2025 but is forecast to post an 8.43% CAGR, the swiftest of any application. Liquid biopsies for early detection, companion tests for antibody-drug conjugates, and tumor-DNA monitoring after surgery are becoming part of standard care pathways.
Infectious disease panels remain the single largest slice at 35.12% of 2025 revenue, yet the COVID-19 tapering moderates category growth. Diabetes monitoring, enriched by continuous glucose sensors and pharmacy testing, maintains mid-single-digit expansion, whereas cardiology assays suffer from a 3.2% Medicare fee dip in 2025. Minimal residual disease tests help clinicians withhold chemotherapy in MRD-negative patients, directly improving quality of life and trimming costs.
By End User: Home-Care Channels Disrupt Traditional Pathways
Hospital labs accounted for 45.03% of revenue in 2025, supported by EHR integration and complex assay menus, yet home-care and self-testing channels will grow 6.43% annually thanks to DTC genetic screens and OTC molecular assays.
Retail pharmacies leverage CLIA-waived analyzers to offer 15-minute results without appointments, pulling routine chronic-care tests out of reference labs. Physician-office labs expanded diabetic testing with hemoglobin A1c devices, capturing 8% of that market by mid-2025. Direct-to-consumer pharmacogenomics, now reimbursed for antidepressant starts, reduces drug-induced adverse events by 22%, validating at-home sample collection models. The United States in-vitro diagnostics market will, therefore, diversify across care settings more rapidly than it concentrates in any single channel.
Competitive Landscape
The United States in-vitro diagnostics market is moderately consolidated: the five largest vendors—Roche Diagnostics, Abbott, Danaher’s Beckman Coulter, Siemens Healthineers, and Thermo Fisher—collectively held roughly 40% revenue share in 2025. These incumbents are reinventing business models by coupling reagent streams with digital services that lock customers into multiyear agreements and satisfy looming LDT and cybersecurity regulations. Roche’s cobas pro platform, packaged with middleware auto-verification, typifies this shift, while Abbott cross-promotes point-of-care cartridges through its retail-pharmacy partnerships.
BD’s USD 4.2 billion purchase of Edwards Lifesciences’ Critical Care division in December 2024 broadened its analyzers into hemodynamic monitoring, a move aimed at offering bundled ICU diagnostics. Guardant Health’s Shield approval enabled the newcomer to capture 3% of average-risk colorectal screening volumes within 6 months, demonstrating how nimble molecular firms can penetrate large-volume markets traditionally dominated by legacy modalities. Exact Sciences, Illumina, and newcomers such as Sherlock Biosciences each defend moats through patents or breakthrough designations, yet CMS reimbursement remains the ultimate throttle on commercial adoption.
The supply-chain reshoring wave benefits U.S.-centric vendors able to guarantee rapid reagent replenishment, an increasingly decisive tender factor after COVID-era freight disruptions. Conversely, smaller specialty labs face consolidation pressure because LDT compliance costs tilt economics toward scale. Collectively, these forces suggest that market control will drift toward vertically integrated, software-enabled conglomerates, while still reserving white space for innovative molecular and wearable technologies that solve unmet clinical or workflow problems.
United States In-Vitro Diagnostics Industry Leaders
F Hoffmann-La Roche AG
Abbott Laboratories
Danaher Corp (Beckman Coulter)
Becton, Dickinson & Co.
bioMerieux SA
- *Disclaimer: Major Players sorted in no particular order

Recent Industry Developments
- January 2026: Cepheid received FDA clearance for the Xpert GI Panel, a multiplex PCR test that rapidly detects 11 GI pathogens from one sample using advanced 10-color multiplexing on GeneXpert systems. It aims to streamline GI testing and deliver quick, accurate results to clinicians.
- December 2025: F. Hoffmann-La Roche AG launched the cobas 6800/8800 systems version 2.0 and software 2.0.1, enhancing laboratory efficiency, resource optimization, and throughput. The update, FDA-cleared earlier this year, offers a more streamlined diagnostics experience for healthcare providers and patients.
- February 2025: Hologic, Inc. announced today that the U.S. Food and Drug Administration (FDA) has granted 510(k) clearance for the company’s Aptima® SARS-CoV-2 assay, which was first granted Emergency Use Authorization (EUA) status in May 2020.


Research Methodology Framework and Report Scope
Market Definitions and Key Coverage
Our study defines the United States in-vitro diagnostics (IVD) market as all reagents, consumables, instruments, and supporting software sold for clinical diagnostic use on human samples outside the body across centralized laboratories, hospital labs, physician office labs, and near-patient point-of-care settings, from test procurement through installed-base service contracts.
Scope exclusion: veterinary testing and research-only analyzers are not counted.
Segmentation Overview
- By Test Type
- Clinical Chemistry
- Molecular Diagnostics
- Immuno-Diagnostics
- Hematology
- Microbiology
- Other Test Types
- By Product
- Instruments
- Reagents & Kits
- Software & Services
- By Usability
- Disposable IVD
- Re-Usable IVD
- By Application
- Infectious Diseases
- Diabetes
- Oncology
- Cardiology
- Auto-Immune Disorders
- Nephrology
- Other Applications
- By End-User
- Diagnostic Laboratories
- Hospitals & Clinics
- Physician Office Labs
- Home-Care & Self-Testing
Detailed Research Methodology and Data Validation
Primary Research
Mordor analysts interviewed lab directors, IVD product managers, payor policy advisers, and clinicians across every U.S. census region. These conversations clarified real-world run-rates, reimbursement headwinds, and expected average selling price moves, letting us stress-test secondary findings and refine assumptions.
Desk Research
We drew baseline volumes and pricing corridors from tier-one sources such as the CDC's National Center for Health Statistics, CMS Clinical Laboratory Fee Schedule, FDA 510(k) and PMA databases, the CLIA laboratory registry, and trade groups like AACC and AdvaMed. Company SEC filings, investor days, and reputable news captured on Dow Jones Factiva and financial footprints from D&B Hoovers illuminated mix shifts and reagent margins. Customs shipment data and peer-reviewed journals offered further triangulation of test utilization trends. The sources noted are illustrative; many additional publicly available datasets were reviewed to validate numbers and narrative.
Market-Sizing & Forecasting
A top-down reconstruction of national test volumes begins with CMS billing counts, CDC procedure surveys, and CLIA lab throughput, which are then corroborated through selective bottom-up checks such as sampled reagent ASP multiplied by high-volume assay counts. Key model inputs include chronic disease incidence trends, CLIA lab footprint changes, average panel size per visit, FDA approval cadence for new assays, and molecular ASP erosion. A multivariate regression projects each driver to 2030, while scenario analysis captures COVID wind-down and accelerating POC adoption. Data gaps in niche test types are bridged using median ratios from adjacent categories confirmed in stakeholder interviews.
Data Validation & Update Cycle
Outputs pass anomaly screens against import statistics and SEC-reported segment revenues before senior review. Reports refresh annually, with interim updates triggered by major FDA rulings, reimbursement shifts, or material mergers, so clients receive the latest view.
Why Mordor's United States In Vitro Diagnostics Baseline Earns Decision-Maker Trust
Published estimates often diverge because other firms bundle POC retail kits, service revenues, or even Canadian sales differently. Our disciplined scoping, verified variables, and yearly refresh give stakeholders a dependable anchor.
Key gap drivers are scope breadth, price-index timing, and COVID normalization assumptions.
Benchmark comparison
| Market Size | Anonymized source | Primary gap driver |
|---|---|---|
| USD 43.13 B (2025) | Mordor Intelligence | - |
| USD 43.70 B (2025) | Global Consultancy A | Includes Canadian revenue and retail OTC self-test kits; smooths post-COVID demand curve |
| USD 34.98 B (2024) | Industry Insight Firm B | Counts only hospital and reference labs, applies two-year-old price indices, minimal POC coverage |
These contrasts show how scope alignment and timely price indices sway totals. Mordor's transparent driver set and multi-step validation deliver a balanced, reproducible baseline that decision-makers can trust.


Key Questions Answered in the Report
What CAGR is forecast for U.S. in-vitro testing between 2026 and 2031?
The United States in-vitro diagnostics market is projected to expand at 5.51% a year over 2026-2031.
Which test modality is growing fastest?
Molecular diagnostics leads with a 7.43% CAGR, propelled by liquid biopsy and comprehensive sequencing reimbursement.
How large will oncology diagnostics become by 2031?
Oncology assays are expected to advance at 8.43% annually, outpacing all other applications through 2031.
What share do the top five manufacturers hold?
Roche, Abbott, Danaher, Siemens Healthineers, and Thermo Fisher together represent about 40% of 2025 revenue.
How are cybersecurity regulations affecting laboratories?
New FDA and CISA rules require software bills of materials and stricter network protections, adding six-figure compliance costs for mid-size hospitals.
Why are reusable analyzers gaining traction?
Consolidated hospital networks need high-throughput platforms that cut labor hours and lower per-test costs compared with disposable cartridges.
How large is the United States in-vitro diagnostics market in 2026?
The United States in-vitro diagnostics market is estimated to reach from USD 45.51 billion in 2026 to reach USD 59.5 billion by 2031.
Page last updated on:


