USA Home Loan Market Size and Share
Market Overview
| Study Period | 2020 - 2031 |
|---|---|
| Forecast Data Period | 2026 - 2031 |
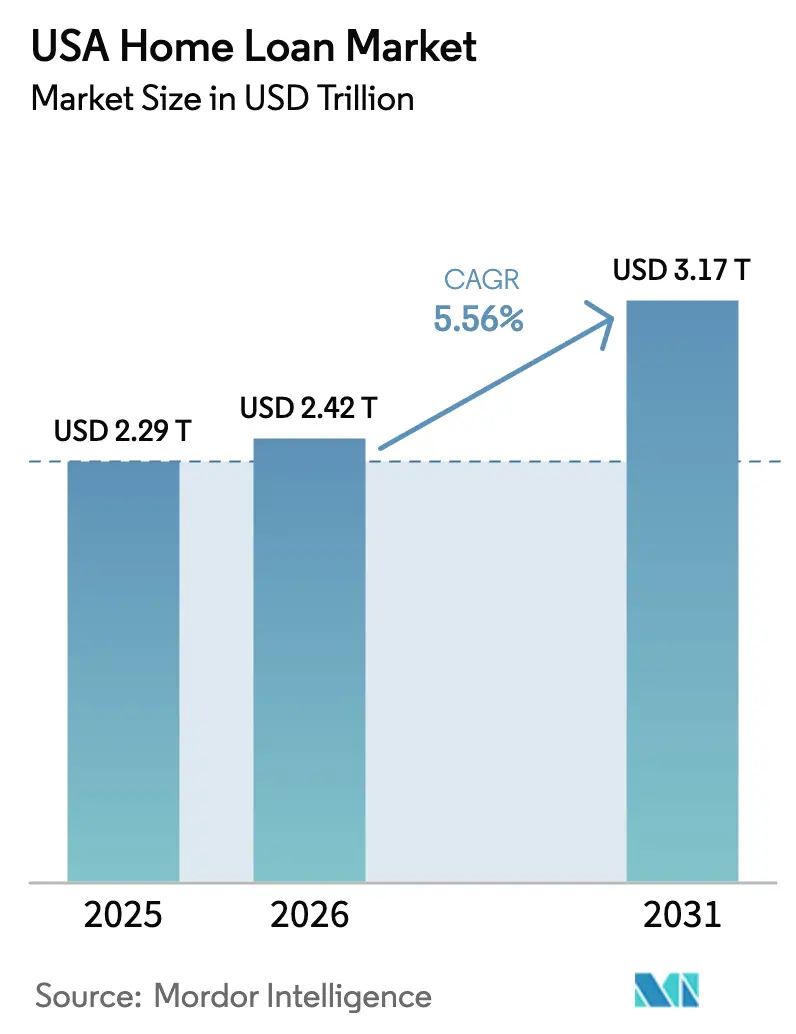
| Base Year Market Size (2025) | USD 2.29 Trillion |
| Market Size (2026) | USD 2.42 Trillion |
| Market Size (2031) | USD 3.17 Trillion |
| Growth Rate (2026 - 2031) | 5.56% CAGR |
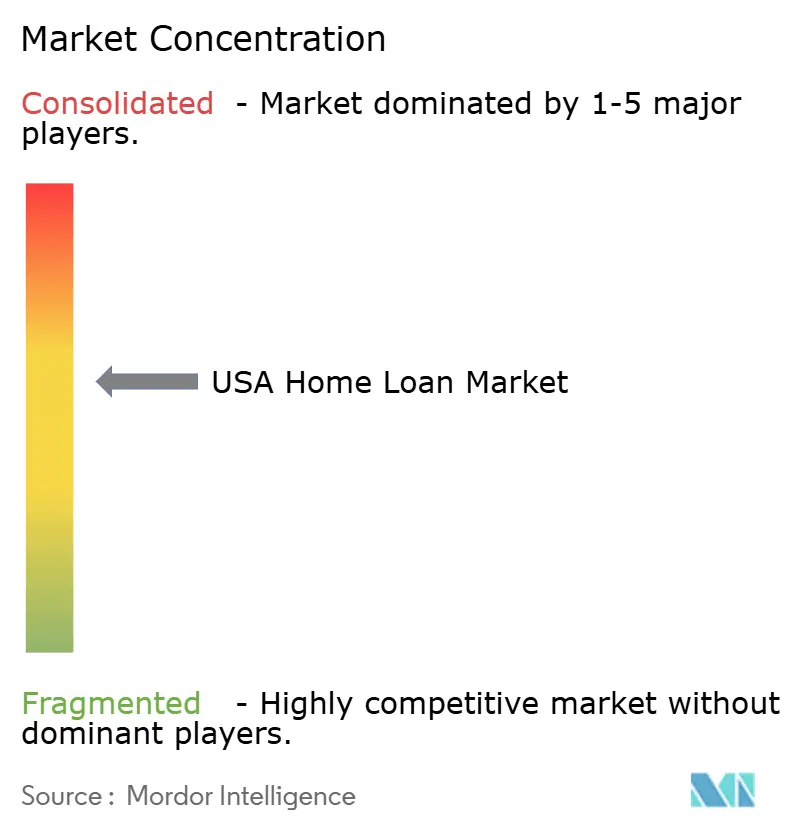
| Market Concentration | Medium |
Major Players *Disclaimer: Major Players sorted in no particular order Image © Mordor Intelligence. Reuse requires attribution under CC BY 4.0. | |
USA Home Loan Market Analysis by Mordor Intelligence
USA Home Loan market size in 2026 is estimated at USD 2.42 trillion, growing from 2025 value of USD 2.29 trillion with 2031 projections showing USD 3.17 trillion, growing at 5.56% CAGR over 2026-2031.
Robust purchase-loan demand, steady technology upgrades, and demographic shifts among millennials and Gen Z sustain forward momentum for the US home loan market despite elevated mortgage rates. Non-bank lenders’ digital-first strategies compress loan-cycle times, while government-backed low-down-payment programs widen borrower access. Fulfilment costs per loan climbed 35% in three years, but lenders counter cost pressure with process automation and AI-based underwriting. Housing inventory remains tight as owners with pandemic-era rates delay selling, yet price resilience continues to support origination values.
Key Report Takeaways
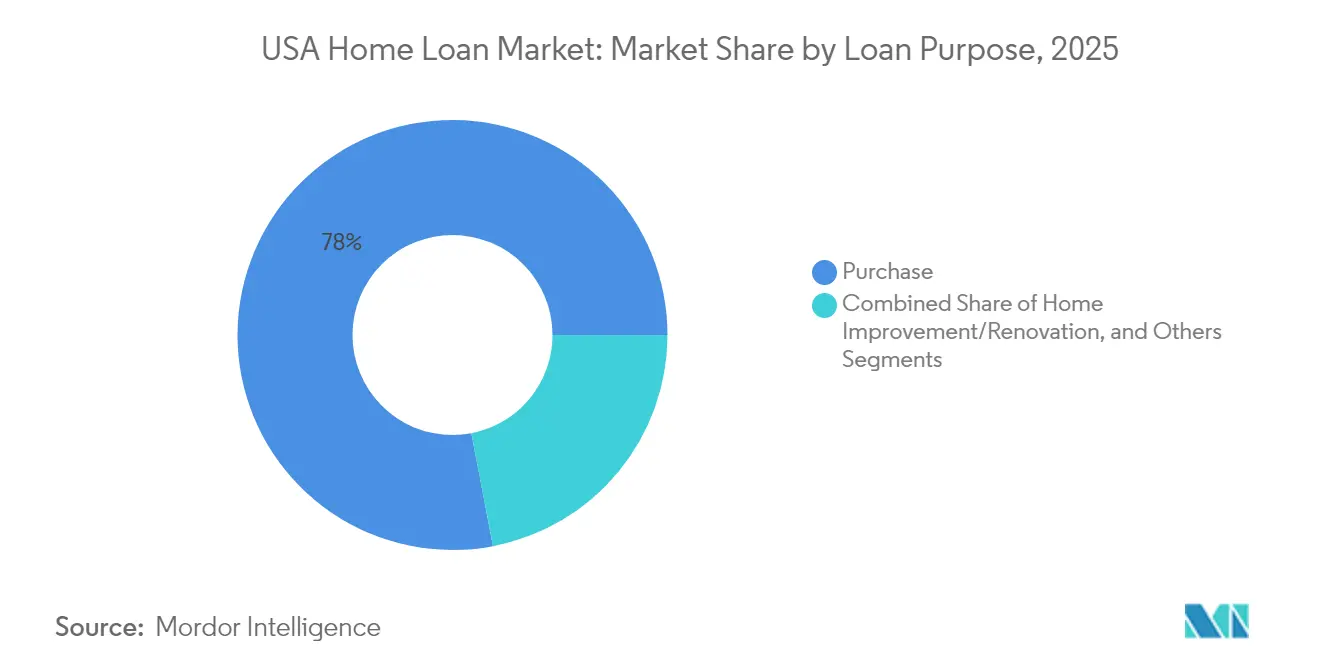
- By loan purpose, purchase financing led with 78.02% share of the US home loan market in 2025; the segment is projected to expand at a 6.05% CAGR through 2031.
- By provider, housing finance companies held 71.65% of the US home loan market share in 2025 and recorded the highest forecast CAGR at 5.83% to 2031.
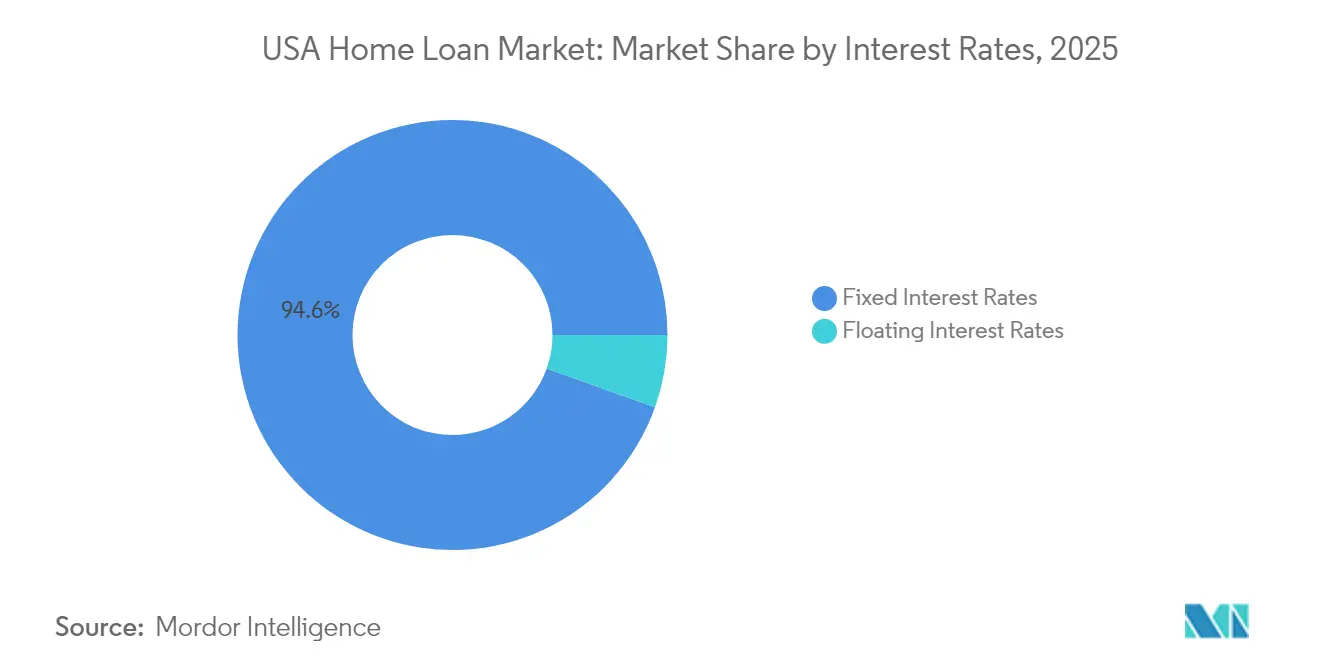
- By interest rate, fixed-rate products accounted for 94.55% of the US home loan market size in 2025; floating-rate offerings are set to post 6.84% CAGR through 2031.
- By loan tenure, terms longer than 20 years captured 87.05% share of the US home loan market size in 2025, while ≤10-year loans deliver the quickest growth at 7.49% CAGR.
Note: Market size and forecast figures in this report are generated using Mordor Intelligence’s proprietary estimation framework, updated with the latest available data and insights as of 2026.
Global valuation is built by aggregating outputs from multiple countries and regions, with United states being one of the contributors. Our global home loan market size represents that cumulative total.
USA Home Loan Market Trends and Insights
Drivers Impact Analysis*
| Driver | (~) % Impact on CAGR Forecast | Geographic Relevance | Impact Timeline |
|---|---|---|---|
| Digitization of loan origination and underwriting | +0.8% | National, highest in major metros | Medium term (2-4 years) |
| AI-driven underwriting cuts cycle-time and cost | +0.6% | National, strongest among tech-focused lenders | Short term (≤2 years) |
| Expansion of first-time-homebuyer demographic | +1.2% | National, pronounced in Sun Belt states | Long term (≥4 years) |
| Government-backed low-down-payment programs | +0.7% | National, bigger effect in rural and suburban areas | Medium term (2-4 years) |
| Alternative credit data inclusion | +0.5% | National, early traction in underserved communities | Long term (≥4 years) |
| Source: Mordor Intelligence | |||
Digitization of Loan Origination and Underwriting
Lenders now embed eClosings, eVaults, and automated verifications into standard workflows, cutting document errors by 80% and shaving nearly two days off average cycle times, as demonstrated by multiple Freddie Mac eMortgage pilots. Surveyed mortgage executives report that 79% are prioritizing loan-origination-system upgrades to sustain competitiveness in the US home loan market. Borrowers reinforce the push: 63% prefer an online mortgage path when available, driving banks and non-banks alike to modernize legacy processes[1]Ernst & Young, “Digital Consumer Mortgage Preferences 2024,” ey.com. Digital pipelines also bolster secondary-market execution by ensuring data integrity at the point of capture, which lowers repurchase risk for originators. As vendors deliver modular APIs, even small lenders can adopt piece-by-piece upgrades and maintain relevance without large upfront capital outlays.
AI-driven Underwriting Cuts Cycle-time & Cost
National Mortgage News notes that large non-bank platforms such as Rocket Mortgage dedicate multi-million-USD budgets to predictive models, whereas mid-sized players adopt vendor solutions priced from USD 20,000 upward [2]National Mortgage News, “Lenders Weigh AI Spending in 2025,” nationalmortgagenews.com. Early adopters already record 30% faster conditional approvals and double-digit basis-point savings in fraud-loss provisioning within the US home loan market. The Mortgage Bankers Association emphasizes that consistent regulatory guidance will unlock further scaling of AI credit-decision engines. Vendor ecosystems now supply explainability modules that meet emerging state-level AI-governance statutes, easing compliance hurdles. Wider deployment is expected to migrate from underwriting to servicing, where AI chatbots handle repayment-plan negotiations and early-stage loss mitigation.
Expansion of the First-Time Homebuyer Demographic
Millennials accounted for 38% of purchase closings in 2024, while Gen Z buyers represented 4.85%—often with down payments under 3% and average purchase values of USD 263,512 [3]Ginnie Mae, “Monthly MBS Issuance Report 2024,” ginnemae.gov. FHA loans underpinned 71.9% of first-time transactions, signaling durable demand and a major tailwind for the US home loan market. Household-formation momentum accelerates in Sun Belt metros where job growth and relative affordability intersect, reinforcing regional dispersion of loan volume. Family-gifted down payments support 25% of younger millennial buyers, showing that inter-generational wealth transfers play an increasing role in origination pipelines. Rising student-loan repayments remain a headwind, but lenders use income-driven repayment documentation to qualify more borrowers without relaxing credit standards.
Government-backed Low-down-payment Programs
Ginnie Mae securitizations surpassed USD 40 billion per month in 2024, eclipsing the larger GSEs as first-time buyers flocked to 3.5%-down FHA mortgages. Zero-down VA and USDA loans extend reach in rural counties and among service members, driving penetration gains in counties with otherwise tight credit access. The Consumer Financial Protection Bureau’s 2024 rule set demands transparent disclosures of automated credit decisions, yet the bureau affirms that streamlined underwriting still speeds approvals for eligible applicants. State housing-finance agencies layer forgivable second-mortgage assistance over federal programs, closing residual affordability gaps. Program volumes, therefore, act as a counter-cyclical stabilizer whenever conventional lending slows, cushioning overall US home loan market performance.
Restraints Impact Analysis*
| Restraint | (~) % Impact on CAGR Forecast | Geographic Relevance | Impact Timeline |
|---|---|---|---|
| Elevated mortgage rates and affordability squeeze | -1.8% | National, acute in coastal metros | Short term (≤2 years) |
| Housing “lock-in” suppresses existing-home turnover | -1.2% | National, highest in pandemic-purchase clusters | Medium term (2-4 years) |
| Non-bank liquidity risk in rising-rate cycles | -0.6% | National, heavier on smaller originators | Short term (≤2 years) |
| Record-high fulfilment costs per loan | -0.9% | National, a greater burden on small lenders | Medium term (2-4 years) |
| Source: Mordor Intelligence | |||
Elevated Mortgage Rates & Affordability Squeeze
The average 30-year fixed rate hovered near 7% in 2024, the steepest level since 2002, reducing purchase power by 15% and pushing the typical buyer age to 56. Payment shock forces many households to stretch debt-to-income ratios or pivot to smaller markets. The Home Price-to-Income ratio now sits 30% above its 20-year average in California’s coastal counties, showing the acute regional impact. Lenders, therefore, see a higher incidence of temporary buydown requests and adjustable-rate quotes, even if the ultimate ARM take-up remains modest. Analysts forecast incremental relief if the Federal Reserve cuts rates by late 2025, yet structural supply shortages imply affordability challenges will linger into the medium term.
Housing “Lock-in” Suppresses Existing-home Turnover
Roughly 1.5 million potential sales remain sidelined each year because owners financed at sub-3% rates during 2020-21 and refuse to reset higher. Months of supply remain below three in many metros—half historical equilibrium—propping prices while crimping origination pipelines. Builders expand new-home production, but construction cycles lag demand, so supply-side tightness persists. Lock-in especially hampers move-up buyers whose equity is trapped behind the prospect of a doubled mortgage payment. The resulting scarcity shifts lender marketing budgets toward renovation-loan products as a hedge against muted turnover.
*Our forecasts treat driver/restraint impacts as directional, not additive. The impact forecasts reflect baseline growth, mix effects, and variable interactions.
Segment Analysis
By Loan Purpose: Purchase Demand Anchors Growth
The purchase financing type captured 78.02% share of the US home loan market in 2025, and the segment is expected to grow at a 6.05% CAGR over the forecast period. This segment extends its dominance as pent-up household formation and rising incomes offset rate pressures. Millennials’ move-up activity, cash-rich Gen Z entrants, and lock-in-driven renovation trends converge to reinforce purchase volumes. Refinance share declined after historic highs in 2021; cash-out refinances still account for a significant portion of that smaller pool, injecting USD 60,214 in average equity per borrower for debt consolidation and remodel projects.
Momentum for renovation lending benefits building suppliers and contractors, but also draws underwriting scrutiny as collateral valuation risks rise. If rates fall meaningfully post-2025, analysts expect a moderate refinance rebound, yet purchase activity is widely viewed as the structural engine for the market.


By Provider: Housing Finance Companies Extend Lead
Housing finance companies possessed 71.65% of the US home loan market in 2025, widening their lead through leaner operating models and full-stack digital experiences. Their 5.83% CAGR projection through 2031 outpaces traditional banks, whose Basel III commitments constrain mortgage appetite. Independent Mortgage Banks absorb market-share transfers from community lenders challenged by fulfillment overhead, thereby stabilizing service levels even as pricing competition intensifies.
Technology also permits granular borrower segmentation and swift secondary-market execution, fortifying non-banks’ role in the US home loan market. Credit unions continue to serve local constituencies but face material catch-up investment needs for end-to-end digital closing.
By Interest Rates: Fixed-rate Preference Persists
Fixed products held a 94.55% share across the US home loan market in 2025, underscoring borrowers’ appetite for payment certainty. Floating-rate mortgages, primarily 5/1 and 7/1 hybrids, should grow 6.84% annually as seasoned buyers seek initial payment relief and anticipate future refinancing. Spread differentials averaging 80 basis points favor ARMs in high-price metros, though uptake remains below pre-2008 peaks due to tighter caps and disclosure rules enacted post-Dodd-Frank.
Should the Federal Reserve guide rates lower in 2026, ARM resets may deliver refinancing tailwinds, yet the embedded value of rate locks means fixed-rate dominance is unlikely to wane markedly in the market.
By Loan Tenure: Long Terms Dominate, Short Terms Accelerate
Loans exceeding 20 years represented 87.05% share of the US home loan market in 2025, reflecting the affordability imperative for younger cohorts. Conversely, ≤10-year products are poised for 7.49% CAGR through 2031 as affluent borrowers choose rapid amortization to build equity and limit lifetime interest expense. The US home loan market size for 15-year offerings typically aligns with rate-drop cycles when homeowners refinance into shorter maturities without monthly payment stress.
Tenure selection remains tightly linked to income stability, retirement horizons, and tax-planning preferences. Lenders tout flexible amortization schedules on non-QM platforms to capture higher-earning self-employed professionals seeking customized repayment patterns.
Geography Analysis
Regional divergence is stark. California and Texas together account for a considerable market share, yet their trajectories diverge. California’s high cost of living limits growth, whereas Texas benefits from in-migration and a diversified economy that drives faster expansion, a pace emblematic of the broader Sun Belt. Florida, Arizona, and North Carolina mirror Texas, with rising population inflows, comparatively lower land costs, and pro-business climates to outpace the national average.
Coastal metros such as New York and Massachusetts labor under median prices above USD 600,000, which requires household incomes north of USD 150,000 for conventional‐loan qualification. That affordability barrier channels outbound migration toward mid-continent and Southeast locales, redistributing potential to originate across the US home loan market. Mountain West states—Colorado, Utah, and Idaho—post 4-5% CAGR on the back of technology job gains and lifestyle migration.
Rural counties often depend on USDA financing, leveraging zero-down benefits to stabilize local ownership rates. Yet, limited housing stock and lower appraised values cap absolute volume. Government-backed share thus skews higher in these areas versus urban counterparts, reinforcing the regional mosaic of the market.
Coverage of the home loan market by Mordor Intelligence spans a wide geographic footprint, with detailed country-level intelligence for Brazil, China, and India, each shaped by local operating conditions.
Competitive Landscape
Competition is intense, and the structure tilts toward moderate fragmentation. Major players collectively account for a significant portion of new volume, while other lenders contribute to the remaining share. This leaves a substantial portion distributed among numerous regional banks, credit unions, community lenders, and emerging fintech platforms. Non-bank independents dominate purchase channels, but their combined share is dispersed across dozens of entities, each holding single-digit percentages. Technology investments widen performance gaps: scale players wield proprietary AI underwriting and direct-to-consumer funnels, whereas many small lenders rely on third-party LOS vendors that offer parity but not true differentiation.
Fragmentation is also evident in secondary-market execution strategies. Some lenders use Ginnie Mae pooling to target FHA production, others sell into Fannie-Freddie cash windows, and niche firms retain servicing to boost fee annuities. M&A activity remains episodic; distressed exits reduce the long-tail count, yet new fintech entrants offset attrition by specializing in non-QM or digital HELOC niches. Consequently, barriers to entry stay low at the point-of-sale, even if capital-rule changes raise hurdles for long-term survivability. Investors, therefore, assess the US home loan market as competitive but with pockets of consolidation risk should liquidity shocks intensify.
USA Home Loan Industry Leaders
Rocket Mortgage
United Wholesale Mortgage
Wells Fargo
PennyMac Financial
LoanDepot
- *Disclaimer: Major Players sorted in no particular order

Recent Industry Developments
- May 2025: The Mortgage Bankers Association issued guidance for state-level AI legislation affecting mortgage workflows.
- April 2025: Tidalwave highlighted agentic-AI voice bots as a fix for low lead-conversion rates among lenders.
- February 2025: Proof and KVS Title launched biometric ID verification to curb wire-fraud risk in closings.
- December 2024: National Mortgage News reported cautious but rising generative-AI adoption across originators.


USA Home Loan Market Report Scope
The home loan market refers to the financial sector that deals with the origination, servicing, and trading of loans used to finance residential properties. It is a specific segment of the broader mortgage industry. In the home loan market, lenders provide funds to individuals and families to purchase homes or refinance existing mortgages. The USA Home Loan Market is segmented By Loan Type (Home Purchase, Refinance, Home Improvement, Other Loan Types), By Source (Bank and Housing Finance Companies), By Interest Rate (Fixed Rate and Floating Rate), and By Tenure (Up to 5 Years, 6 - 10 Years, 11 - 24 Years, and 25 - 30 Years). The report offers market size and forecasts in value (USD) for all the above segments.
| Purchase (New/Existing) |
| Home Improvement/Renovation |
| Others (Construction, Refinance, etc.) |
| Banks |
| Housing Finance Companies |
| Others |
| Fixed Interest Rates |
| Floating Interest Rates |
| Less than or equal to 10 Years |
| 11 – 20 Years |
| Longer than 20 Years |
| By Loan Purpose | Purchase (New/Existing) |
| Home Improvement/Renovation | |
| Others (Construction, Refinance, etc.) | |
| By Provider | Banks |
| Housing Finance Companies | |
| Others | |
| By Interest Rates | Fixed Interest Rates |
| Floating Interest Rates | |
| By Loan Tenure | Less than or equal to 10 Years |
| 11 – 20 Years | |
| Longer than 20 Years |


Key Questions Answered in the Report
What is the current size of the US home loan market?
The US home loan market reached USD 2.42 trillion in 2026 and is forecasted to grow to USD 3.17 trillion by 2031.
Which loan purpose dominates new originations?
Purchase financing leads with 78.02% share as of 2025 and is projected to expand at a 6.05% CAGR through 2031.
How large is the fixed-rate segment within the US home loan market?
Fixed-rate mortgages accounted for 94.55% of the 2025 market size, reflecting borrower preference for payment stability.
Why are non-bank lenders gaining share?
Housing-finance companies leverage digital platforms and lower capital requirements, capturing 71.65% market share in 2025 while growing at a 5.83% CAGR.
Which regional markets show the fastest growth?
Sun Belt states such as Texas, Florida, Arizona, and North Carolina lead thanks to population inflows and relative housing affordability.
How are fulfilment costs affecting lender profitability?
Average fulfilment expenses climbed as high as USD 16,500 per loan in 2024, pressuring margins and driving accelerated adoption of automation technologies.
Page last updated on:


