Market Overview
| Study Period | 2020 - 2031 |
|---|---|
| Forecast Data Period | 2026 - 2031 |
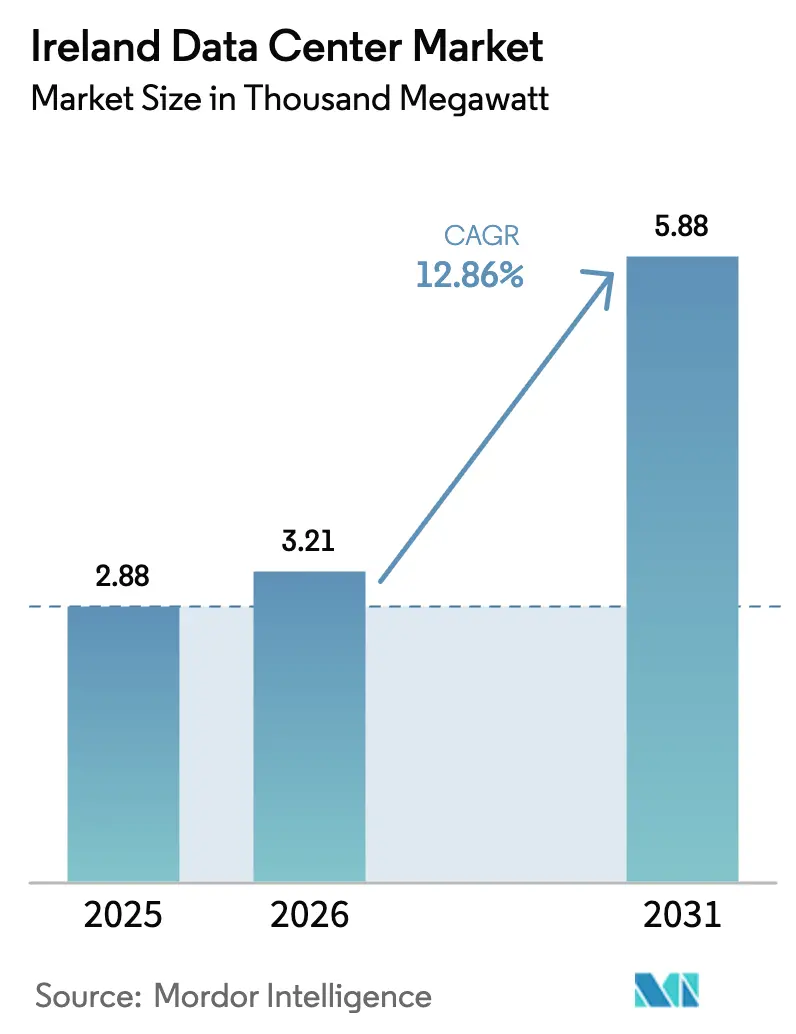
| Base Year Market Size (2025) | 2.88 Thousand megawatt |
| Market Volume (2026) | 3.21 Thousand megawatt |
| Market Volume (2031) | 5.88 Thousand megawatt |
| Growth Rate (2026 - 2031) | 12.86% CAGR |
| Market Concentration | High |
Major Players *Disclaimer: Major Players sorted in no particular order Image © Mordor Intelligence. Reuse requires attribution under CC BY 4.0. | |
Ireland Data Center Market Analysis by Mordor Intelligence
The Ireland Data Center Market size is expected to increase from 2.88 thousand megawatt in 2025 to 3.21 thousand megawatt in 2026 and reach 5.88 thousand megawatt by 2031, growing at a CAGR of 12.86% over 2026-2031. Solid tax incentives, a dense subsea-fiber network, and a pipeline that already exceeds 1 GW of planned capacity are amplifying investment momentum. Operators are shifting new builds outside the Dublin corridor to relieve grid congestion, while on-site generation and large-scale battery storage are emerging as prerequisites for new grid connections. Renewable-energy power-purchase agreements (PPAs) totaling more than 1,100 MW have become the preferred hedge against volatile wholesale power costs, and liquid-cooling adoption is accelerating as artificial-intelligence (AI) clusters push rack densities beyond 30 kW. Together, these dynamics reinforce Ireland’s status as a preferred European gateway for hyperscalers and a growing edge-computing theater for 5G-enabled applications.
Key Report Takeaways
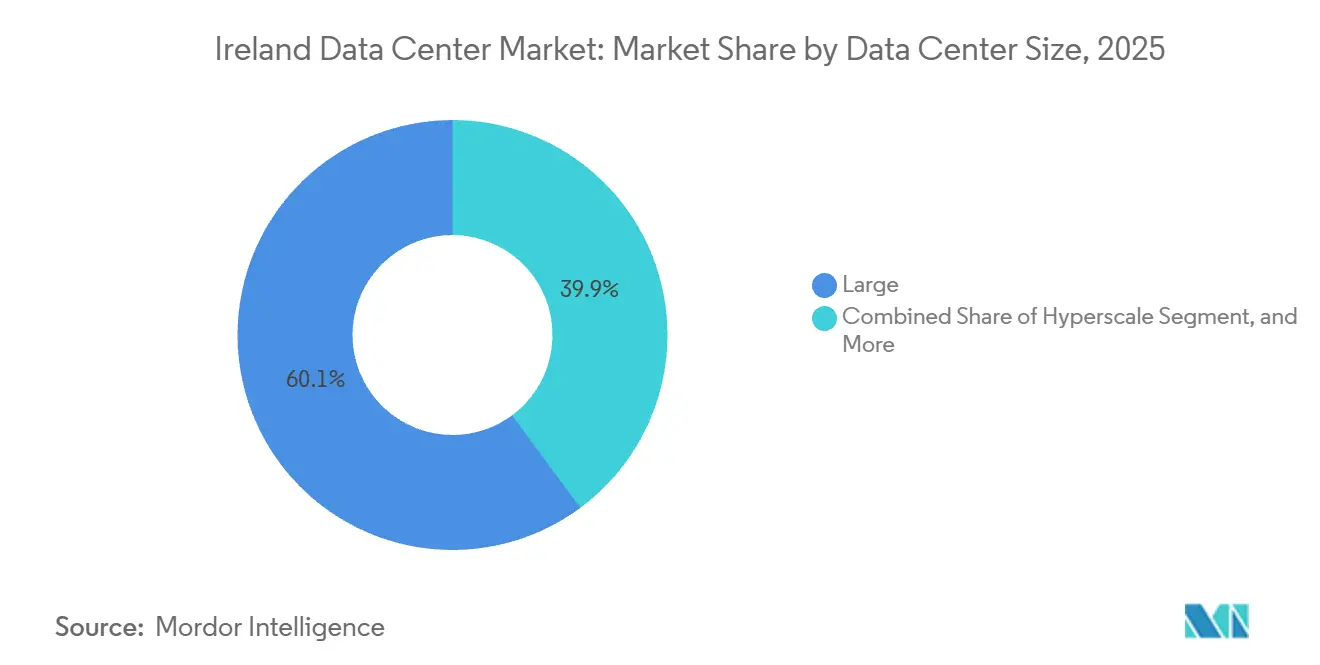
- By data center size, hyperscale campuses accounted for 60.14% of the Ireland data center market share in 2025 and are projected to grow at a 13.14% CAGR through 2031.
- By tier, tier 4 infrastructure accounted for 81.15% of the Ireland data center market size in 2025 and is expected to advance at a 13.32% CAGR between 2026-2031.
- By end user, IT and ITES led the Ireland data center market with 35.61% share in 2025, while BFSI workloads are poised to expand at a 14.66% CAGR through 2031.
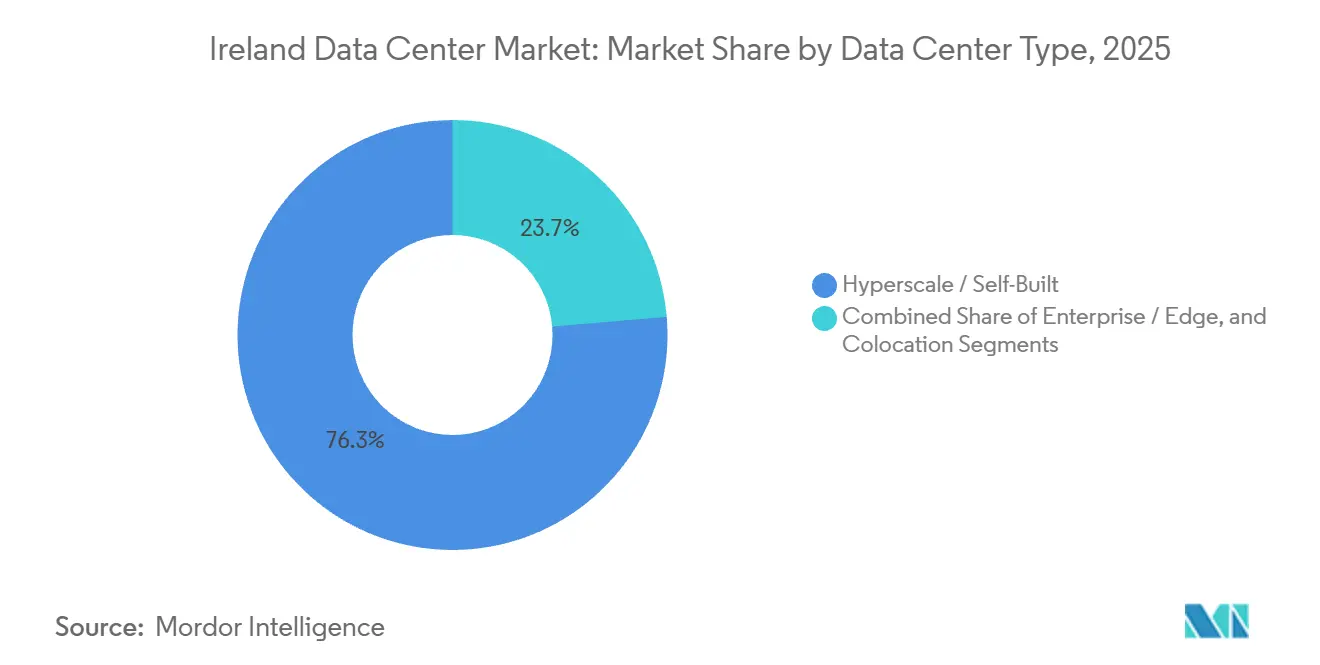
- By data center type, hyperscale and self-built facilities captured 76.35% of the Ireland data center market share in 2025, whereas enterprise and edge sites are set to grow at a 13.63% CAGR to 2031.
- By hotspot, Dublin commanded 89.29% of installed capacity in 2025, while the Rest of Ireland segment is forecast to expand at a 13.58% CAGR through 2031.
Note: Market size and forecast figures in this report are generated using Mordor Intelligence’s proprietary estimation framework, updated with the latest available data and insights as of January 2026.
Ireland Data Center Market Trends and Insights
Drivers Impact Analysis*
| Driver | (~) % Impact on CAGR Forecast | Geographic Relevance | Impact Timeline |
|---|---|---|---|
| Corporate-Tax Incentives Sustaining Hyperscaler Inflows | +2.80% | National, concentrated in Dublin | Long term (≥ 4 years) |
| Robust Subsea-Fiber Ecosystem Enabling Ultra-Low-Latency Routes | +2.10% | National, with Dublin as primary landing hub | Medium term (2-4 years) |
| Hyperscaler Campus Pipeline Exceeding 1 GW By 2030 | +3.20% | Dublin region, expanding to midlands | Medium term (2-4 years) |
| Renewable-Energy PPAs Enhancing Sustainability Credentials | +1.90% | National, with focus on wind-rich western regions | Long term (≥ 4 years) |
| 5G-Driven Edge Compute Demand Around Irish Metros | +1.40% | Dublin, Cork, Galway metropolitan areas | Short term (≤ 2 years) |
| Waste-Heat Reuse Mandates Unlocking District-Heating Revenues | +0.90% | Dublin urban areas, expanding nationally | Long term (≥ 4 years) |
| Source: Mordor Intelligence | |||


Corporate-Tax Incentives Sustaining Hyperscaler Inflows
Ireland’s long-standing 12.5% corporate tax rate, now transitioning to 15% for the largest multinationals, continues to underpin decisive capital commitments. Microsoft, Google, and Amazon Web Services have collectively deployed more than USD 19 billion since 2012, while Echelon’s EUR 3.5 billion Wicklow program illustrates how accelerated depreciation allowances reduce the total cost of ownership.[1]IDA Ireland, “Ireland for Finance,” idaireland.comStreamlined customs procedures for intra-EU hardware movements further compress deployment lead-times. Fiscal clarity is especially valuable as operators navigate the Commission for Regulation of Utilities’ dispatchable-capacity rule, which requires up to EUR 100 million in upfront capital for a typical 50 MW build.[2]Commission for Regulation of Utilities, “Large Energy User Connection Policy,” cru.ieConsequently, foreign direct investment remains robust despite a marginal rise in the headline tax rate.
Hyperscaler Campus Pipeline Exceeding 1 GW by 2030
The development queue now totals about 1,070 MW of future IT load, triple the 2025 base. Multi-phase projects from Vantage, Art Data Centres, GreenScale, and Red Admiral typify the move toward energy-independent campuses that rely on on-site generation or contracted renewables. Modular designs let operators commission halls only when anchor tenants sign, limiting stranded capital if demand moderates. With AI training, sovereign-data mandates, and stricter GDPR enforcement all pointing to larger in-region datasets, developers are betting that Ireland will capture a bigger slice of European repatriation workloads. Execution risk remains high, however, as grid-connection approvals in the Dublin region are effectively paused until 2028.[3]EirGrid, “Data Centre Connection Policy,” eirgrid.ie
Robust Subsea-Fiber Ecosystem Enabling Ultra-Low-Latency Routes
Roughly 75% of Northern Hemisphere trans-Atlantic capacity now lands on Irish shores. Systems such as Aqua Comms’ AEC-1, AEC-2, and the new Amitié route, plus AWS’s forthcoming 320 Tbps Fastnet cable, deliver millisecond-level latency to North America. Cork’s Hibernia Express landing offers the fastest New York round-trip time in Europe, giving Ireland a trading-latency advantage for capital-markets applications. As hyperscalers self-fund new cables like Microsoft’s Tuskar and SOBR routes, reliance on third-party carriers will diminish, lowering per-bit costs and reinforcing Dublin’s position as a pan-regional interconnection hub.
Renewable-Energy PPAs Enhancing Sustainability Credentials
More than 1,100 MW of renewable PPAs are already inked, led by Microsoft’s 900 MW onshore wind and solar portfolio, Amazon’s 229 MW of wind commitments, and Google’s 58 MW solar contract. These agreements provide long-term price certainty and help operators meet net-zero pledges. The CRU’s December 2025 rule requiring dispatchable generation or storage for new connections accelerates the deployment of on-site batteries and behind-the-meter power plants. Echelon’s Wicklow campus, for example, pairs a 220 kV substation with access to 800 MW of offshore wind, positioning it to fulfill the regulation without jeopardizing timelines.
Restraints Impact Analysis*
| Restraint | (~) % Impact on CAGR Forecast | Geographic Relevance | Impact Timeline |
|---|---|---|---|
| Electricity-Grid Capacity Moratorium in Dublin Corridor | -2.4% | Dublin, surrounding counties | Medium term (2-4 years) |
| Escalating Power Prices and Carbon-Tax Exposure | -1.8% | National | Short term (≤ 2 years) |
| Lengthy Local-Planning Appeals Delaying New Builds | -1.3% | National, acute in Dublin and Wicklow | Medium term (2-4 years) |
| Shortage Of Specialist Contractors Inflating Project CAPEX | -1.0% | National | Short term (≤ 2 years) |
| Source: Mordor Intelligence | |||
Electricity-Grid Capacity Moratorium in Dublin Corridor
EirGrid’s freeze on new connections in Dublin through 2028 diverts investment to Wicklow, Clare, Westmeath, and Mayo, regions that still have headroom and land availability. The grid constraint forces developers either to generate their own power or to negotiate grandfathered access to older substations. Compliance with the CRU’s dispatchable-capacity rule can add USD 56 million to USD 113 million in upfront costs for a typical 50 MW facility, dampening smaller entrants’ appetite. While hyperscalers can absorb the surcharge, colocation providers may postpone or resize projects, potentially tightening supply in the retail segment.
Escalating Power Prices and Carbon-Tax Exposure
Wholesale power prices surged in 2024, and Ireland’s carbon levy rose to EUR 48.50 per tonne with an escalation path to EUR 100 by 2030. A 50 MW data center operating at an 80% average load therefore faces an annual carbon bill of almost USD 1.9 million today, which doubles by decade’s end if decarbonization lags. Operators are countering with renewable PPAs and waste-heat reuse schemes such as Amazon’s proposed Tallaght district-heating network, which could monetize excess thermal energy. However, district-heating projects require municipal coordination and long-term offtake contracts, limiting near-term scalability for most campuses.
*Our forecasts treat driver/restraint impacts as directional, not additive. The impact forecasts reflect baseline growth, mix effects, and variable interactions.
Segment Analysis
By Data Center Size: Hyperscale Campuses Drive Capacity Additions
Large campuses accounted for 60.14% of installed load in 2025, and this share is growing as the hyperscale cohort accelerates expansion. The Ireland data center market share allocated to hyperscale sites is projected to expand at a 13.14% CAGR, driven by AI training clusters that require contiguous power blocks exceeding 30 MW. Economies of scale in cooling and renewable procurement enable these sites to achieve power usage effectiveness (PUE) below 1.2, compared with legacy facilities that hover around 1.5.
Medium-sized facilities between 5 MW and 10 MW continue to serve regional enterprises and latency-sensitive government workloads. Edge nodes under 5 MW cater to telecom use cases and regulated industries that cannot justify hyperscale footprints. Modular construction lets operators phase capital outlays, as seen at Art Data Centres’ six-hall Ennis campus and Vantage’s on-site generation-backed Dublin build, both of which can scale hall-by-hall. This flexibility protects return on invested capital if leasing momentum wanes.


By Tier Type: Tier 4 Dominance Reflects Financial-Services Demand
Tier 4 sites accounted for 81.15% of installed capacity in 2025, a share expected to edge higher as banking, insurance, and public-sector tenants enforce stringent uptime requirements. The Ireland data center market share for Tier 4 infrastructure is forecast to advance at a 13.32% CAGR, supported by Central Bank of Ireland operational-resilience mandates that require sub-four-hour recovery objectives. Construction costs run roughly 40% higher than Tier 3 equivalents, but the resilience premium is being accepted by risk-averse tenants.
Tier 3 remains relevant for IT and ITES workloads that can tolerate brief maintenance windows, while Tier 1 and Tier 2 footprints now skew toward test and development environments. Operators such as Equinix and Digital Realty are retrofitting aging Tier 3 halls with additional UPS strings to secure Tier 4 certification, a move that captures premium pricing without greenfield capital expenditure.
By Data Center Type: Enterprise and Edge Gain Share Amid 5G Rollouts
Hyperscale and self-built estates retained 76.35% of total capacity in 2025, but enterprise and edge facilities are on a faster 13.63% growth path through 2031. Cloudflare, EdgeConneX, and telecom operators are adding micro-sites around Cork, Galway, and Limerick to keep latency under 10 milliseconds for augmented-reality and autonomous-vehicle applications. These facilities often adopt liquid-cooled rear-door heat exchangers to support GPU-rich racks in the 30 kW to 40 kW range.
Retail colocation continues to thrive in Dublin, where Equinix’s DUB11 interconnection hub provides cross-connect access to more than 100 carriers and cloud on-ramps. Wholesale colocation is expanding as financial-services and software-as-a-service (SaaS) tenants look for dedicated 1 MW-plus suites, but grid uncertainty is prompting landlords to pre-wire halls while waiting for definitive power-allocation letters.
By End User: BFSI Leads Growth Amid Cloud-Migration Mandates
IT and ITES workloads drove 35.61% of 2025 demand, yet BFSI workloads are set to register the sharpest 14.66% CAGR through 2031. The Central Bank’s resilience framework compels banks to maintain geographically separated failover sites, benefiting Tier 4 colocation in both Dublin and Wicklow. Multinational insurers establishing European headquarters in the capital add incremental requirements for high-density secure cages.
Government agencies follow the Irish Cloud First policy, migrating legacy systems to hybrid cloud architectures that blend hyperscale compute bursts with in-country colocation for sensitive datasets. Manufacturing, pharmaceuticals, and media each contribute smaller but steady slices of incremental capacity, particularly in the Shannon and Galway corridors where industrial clusters overlap with edge-compute nodes.
Geography Analysis
Dublin delivered 89.29% of installed capacity in 2025 thanks to its established carrier hotels, subsea-cable nodes, and talent concentration. Despite the grid moratorium, the city’s incumbent footprint will remain indispensable for interconnection-heavy workloads. Even so, the Rest of Ireland is projected to expand at a 13.58% CAGR, fueled by large greenfield sites in Wicklow, Clare, Westmeath, and Mayo that sidestep connection quotas.
In the northwest, Derry and Letterkenny are drawing projects that serve both the Republic and the United Kingdom, helped by lower land prices and strengthening renewables interconnects. Regional governments often accelerate permitting compared with Dublin’s crowded planning docket, shaving months off construction schedules. Nonetheless, distance from the capital can introduce data-sovereignty and latency trade-offs for financial-services tenants that must maintain strict round-trip speed thresholds.
The Celtic Interconnector, due online by 2028, will link Ireland directly to the French grid, enabling renewable-energy imports during low-wind periods and exports during periods of surplus generation. This 700 MW subsea link also adds redundancy to the island’s electricity system, possibly enabling looser capacity quotas in future connection rounds. Taken together, geographic dispersion helps balance Ireland’s grid load while sustaining the Ireland data center market’s overall growth trajectory.
Competitive Landscape
The Ireland data center market exhibits concentration. Vertical integration is strengthening as operators secure renewable-energy assets and subsea cables to insulate against external shocks. Colocation specialists are emphasizing software-defined interconnection fabrics that create sticky ecosystems and justify premium pricing.
Edge-centric developers such as EdgeConneX and Cloudflare are carving niches with modular, sub-5-MW nodes near 5G aggregation points. Energy-independent entrants like Red Admiral, which pairs a 130 MW solar array with a 250 MW campus in Westmeath, represent a structural shift in project-funding models. Liquid-cooling innovation is gathering momentum, with Microsoft’s modular immersion-cooling design signaling next-generation density targets likely to reach Ireland within the planning horizon. Price competition could intensify from 2027 onward if the 1,070 MW pipeline comes online faster than demand, particularly in wholesale colocation suites.
Regional telecom carriers and dark-fiber providers are forming joint ventures with data-center landlords to pre-wire new halls for 400-Gbps wavelengths, shortening move-in times for latency-sensitive tenants. Several operators are also diversifying into managed services. Equinix Fabric already supports multi-cloud routing, while Digital Realty’s ServiceFabric platform adds zero-trust security overlays, blurring the line between pure colocation and hybrid-cloud orchestration. Finally, a handful of Irish developers are exploring real estate investment trust conversions that could unlock lower-cost capital and broaden the investor base, signaling that capital-market structures may become another axis of competition by the end of the decade.
Ireland Data Center Industry Leaders
Amazon Web Services Inc.
Microsoft Corporation
Google LLC
Meta Platforms Inc.
Digital Realty Trust Inc.
- *Disclaimer: Major Players sorted in no particular order

Recent Industry Developments
- January 2026: Microsoft converted backup generators at its Dublin facilities to hydrotreated vegetable oil, reducing carbon emissions by about 90% versus conventional diesel.
- December 2025: The Commission for Regulation of Utilities finalized its Large Energy User Connection Policy, requiring dispatchable generation or battery storage for new data-center grid ties.
- August 2025: EdgeConneX received planning approval for a modular edge facility targeting telecom and media tenants, with commissioning slated for 1H 2026.
- May 2025: Echelon Data Centres secured planning consent for its EUR 3.5 billion DUB20 and DUB30 campuses in Wicklow, delivering 180 MW of Tier 4 load.


Ireland Data Center Market Report Scope
The data center market encompasses the infrastructure, services, and technologies that support the storage, management, and processing of data. This market includes various data center sizes, tier classifications, types, end-user industries, and hotspots, reflecting the diverse needs of businesses and organizations operating in the country.
The Ireland Data Center Market Report is Segmented by Data Center Size (Small, Medium, Large, and Hyperscale), Tier Type (Tier 1 and 2, Tier 3, and Tier 4), Data Center Type (Hyperscale/Self-Built, Enterprise/Edge, and Colocation), End User (BFSI, IT and ITES, E-Commerce, Government, Manufacturing, Media and Entertainment, Telecom, and Other End Users), and Hotspot (Dublin, and Rest of Ireland). The Market Forecasts are Provided in Terms of IT Load Capacity (Megawatt).
By Data Center Size
| Small |
| Medium |
| Large |
| Hyperscale |
By Tier Type
| Tier 1 and 2 |
| Tier 3 |
| Tier 4 |
By Data Center Type
| Hyperscale / Self-Built | ||
| Enterprise / Edge | ||
| Colocation | Non-Utilized | |
| Utilized | Retail Colocation | |
| Wholesale Colocation | ||
By End User
| BFSI |
| IT and ITES |
| E-Commerce |
| Government |
| Manufacturing |
| Media and Entertainment |
| Telecom |
| Other End Users |
By Hotspot
| Dublin |
| Rest of Ireland |
| By Data Center Size | Small | ||
| Medium | |||
| Large | |||
| Hyperscale | |||
| By Tier Type | Tier 1 and 2 | ||
| Tier 3 | |||
| Tier 4 | |||
| By Data Center Type | Hyperscale / Self-Built | ||
| Enterprise / Edge | |||
| Colocation | Non-Utilized | ||
| Utilized | Retail Colocation | ||
| Wholesale Colocation | |||
| By End User | BFSI | ||
| IT and ITES | |||
| E-Commerce | |||
| Government | |||
| Manufacturing | |||
| Media and Entertainment | |||
| Telecom | |||
| Other End Users | |||
| By Hotspot | Dublin | ||
| Rest of Ireland | |||


Market Definition
- IT LOAD CAPACITY - The IT load capacity or installed capacity, refers to the amount of energy consumed by servers and network equipments placed in a rack installed. It is measured in megawatt (MW).
- ABSORPTION RATE - It denotes the extend to which the data center capacity has been leased out. For instance, a 100 MW DC has leased out 75 MW, then absorption rate would be 75%. It is also referred as utilization rate and leased-out capacity.
- RAISED FLOOR SPACE - It is an elevated space build over the floor. This gap between the original floor and the elevated floor is used to accommodate wiring, cooling, and other data center equipment. This arrangement assist in having proper wiring and cooling infrastructure. It is measured in square feet (ft^2).
- DATA CENTER SIZE - Data Center Size is segmented based on the raised floor space allocated to the data center facilities. Mega DC - # of Racks must be more than 9000 or RFS (raised floor space) must be more than 225001 Sq. ft; Massive DC - # of Racks must be in between 9000 and 3001 or RFS must be in between 225000 Sq. ft and 75001 Sq. ft; Large DC - # of Racks must be in between 3000 and 801 or RFS must be in between 75000 Sq. ft and 20001 Sq. ft; Medium DC # of Racks must be in between 800 and 201 or RFS must be in between 20000 Sq. ft and 5001 Sq. ft; Small DC - # of Racks must be less than 200 or RFS must be less than 5000 Sq. ft.
- TIER TYPE - According to Uptime Institute the data centers are classified into four tiers based on the proficiencies of redundant equipment of the data center infrastructure. In this segment the data center are segmented as Tier 1,Tier 2, Tier 3 and Tier 4.
- COLOCATION TYPE - The segment is segregated into 3 categories namely Retail, Wholesale and Hyperscale Colocation service. The categorization is done based on the amount of IT load leased out to potential customers. Retail colocation service has leased capacity less than 250 kW; Wholesale colocation services has leased capacity between 251 kW and 4 MW and Hyperscale colocation services has leased capacity more than 4 MW.
- END CONSUMERS - The Data Center Market operates on a B2B basis. BFSI, Government, Cloud Operators, Media and Entertainment, E-Commerce, Telecom and Manufacturing are the major end-consumers in the market studied. The scope only includes colocation service operators catering to the increasing digitalization of the end-user industries.
| Keyword | Definition |
|---|---|
| Rack Unit | Generally referred as U or RU, it is the unit of measurement for the server unit housed in the racks in the data center. 1U is equal to 1.75 inches. |
| Rack Density | It defines the amount of power consumed by the equipment and server housed in a rack. It is measured in kilowatt (kW). This factor plays a critical role in data center design and, cooling and power planning. |
| IT Load Capacity | The IT load capacity or installed capacity, refers to the amount of energy consumed by servers and network equipment placed in a rack installed. It is measured in megawatt (MW). |
| Absorption Rate | It denotes how much of the data center capacity has been leased out. For instance, if a 100 MW DC has leased out 75 MW, then the absorption rate would be 75%. It is also referred to as utilization rate and leased-out capacity. |
| Raised Floor Space | It is an elevated space built over the floor. This gap between the original floor and the elevated floor is used to accommodate wiring, cooling, and other data center equipment. This arrangement assists in having proper wiring and cooling infrastructure. It is measured in square feet/meter. |
| Computer Room Air Conditioner (CRAC) | It is a device used to monitor and maintain the temperature, air circulation, and humidity inside the server room in the data center. |
| Aisle | It is the open space between the rows of racks. This open space is critical for maintaining the optimal temperature (20-25 °C) in the server room. There are primarily two aisles inside the server room, a hot aisle and a cold aisle. |
| Cold Aisle | It is the aisle wherein the front of the rack faces the aisle. Here, chilled air is directed into the aisle so that it can enter the front of the racks and maintain the temperature. |
| Hot Aisle | It is the aisle where the back of the racks faces the aisle. Here, the heat dissipated from the equipment’s in the rack is directed to the outlet vent of the CRAC. |
| Critical Load | It includes the servers and other computer equipment whose uptime is critical for data center operation. |
| Power Usage Effectiveness (PUE) | It is a metric which defines the efficiency of a data center. It is calculated by: (𝑇𝑜𝑡𝑎𝑙 𝐷𝑎𝑡𝑎 𝐶𝑒𝑛𝑡𝑒𝑟 𝐸𝑛𝑒𝑟𝑔𝑦 𝐶𝑜𝑛𝑠𝑢𝑚𝑝𝑡𝑖𝑜𝑛)/(𝑇𝑜𝑡𝑎𝑙 𝐼𝑇 𝐸𝑞𝑢𝑖𝑝𝑚𝑒𝑛𝑡 𝐸𝑛𝑒𝑟𝑔𝑦 𝐶𝑜𝑛𝑠𝑢𝑚𝑝𝑡𝑖𝑜𝑛). Further, a data center with a PUE of 1.2-1.5 is considered highly efficient, whereas, a data center with a PUE >2 is considered highly inefficient. |
| Redundancy | It is defined as a system design wherein additional component (UPS, generators, CRAC) is added so that in case of power outage, equipment failure, the IT equipment should not be affected. |
| Uninterruptible Power Supply (UPS) | It is a device that is connected in series with the utility power supply, storing energy in batteries such that the supply from UPS is continuous to IT equipment even during utility power is snapped. The UPS primarily supports the IT equipment only. |
| Generators | Just like UPS, generators are placed in the data center to ensure an uninterrupted power supply, avoiding downtime. Data center facilities have diesel generators and commonly, 48-hour diesel is stored in the facility to prevent disruption. |
| N | It denotes the tools and equipment required for a data center to function at full load. Only "N" indicates that there is no backup to the equipment in the event of any failure. |
| N+1 | Referred to as 'Need plus one', it denotes the additional equipment setup available to avoid downtime in case of failure. A data center is considered N+1 when there is one additional unit for every 4 components. For instance, if a data center has 4 UPS systems, then for to achieve N+1, an additional UPS system would be required. |
| 2N | It refers to fully redundant design wherein two independent power distribution system is deployed. Therefore, in the event of a complete failure of one distribution system, the other system will still supply power to the data center. |
| In-Row Cooling | It is the cooling design system installed between racks in a row where it draws warm air from the hot aisle and supplies cool air to the cold aisle, thereby maintaining the temperature. |
| Tier 1 | Tier classification determines the preparedness of a data center facility to sustain data center operation. A data center is classified as Tier 1 data center when it has a non-redundant (N) power component (UPS, generators), cooling components, and power distribution system (from utility power grids). The Tier 1 data center has an uptime of 99.67% and an annual downtime of <28.8 hours. |
| Tier 2 | A data center is classified as Tier 2 data center when it has a redundant power and cooling components (N+1) and a single non-redundant distribution system. Redundant components include extra generators, UPS, chillers, heat rejection equipment, and fuel tanks. The Tier 2 data center has an uptime of 99.74% and an annual downtime of <22 hours. |
| Tier 3 | A data center having redundant power and cooling components and multiple power distribution systems is referred to as a Tier 3 data center. The facility is resistant to planned (facility maintenance) and unplanned (power outage, cooling failure) disruption. The Tier 3 data center has an uptime of 99.98% and an annual downtime of <1.6 hours. |
| Tier 4 | It is the most tolerant type of data center. A Tier 4 data center has multiple, independent redundant power and cooling components and multiple power distribution paths. All IT equipment are dual powered, making them fault tolerant in case of any disruption, thereby ensuring interrupted operation. The Tier 4 data center has an uptime of 99.74% and an annual downtime of <26.3 minutes. |
| Small Data Center | Data center that has floor space area of ≤ 5,000 Sq. ft or the number of racks that can be installed is ≤ 200 is classified as a small data center. |
| Medium Data Center | Data center which has floor space area between 5,001-20,000 Sq. ft, or the number of racks that can be installed is between 201-800, is classified as a medium data center. |
| Large Data Center | Data center which has floor space area between 20,001-75,000 Sq. ft, or the number of racks that can be installed is between 801-3,000, is classified as a large data center. |
| Massive Data Center | Data center which has floor space area between 75,001-225,000 Sq. ft, or the number of racks that can be installed is between 3001-9,000, is classified as a massive data center. |
| Mega Data Center | Data center that has a floor space area of ≥ 225,001 Sq. ft or the number of racks that can be installed is ≥ 9001 is classified as a mega data center. |
| Retail Colocation | It refers to those customers who have a capacity requirement of 250 kW or less. These services are majorly opted by small and medium enterprises (SMEs). |
| Wholesale Colocation | It refers to those customers who have a capacity requirement between 250 kW to 4 MW. These services are majorly opted by medium to large enterprises. |
| Hyperscale Colocation | It refers to those customers who have a capacity requirement greater than 4 MW. The hyperscale demand primarily originates from large-scale cloud players, IT companies, BFSI, and OTT players (like Netflix, Hulu, and HBO+). |
| Mobile Data Speed | It is the mobile internet speed a user experiences via their smartphones. This speed is primarily dependent on the carrier technology being used in the smartphone. The carrier technologies available in the market are 2G, 3G, 4G, and 5G, where 2G provides the slowest speed while 5G is the fastest. |
| Fiber Connectivity Network | It is a network of optical fiber cables deployed across the country, connecting rural and urban regions with high-speed internet connection. It is measured in kilometer (km). |
| Data Traffic per Smartphone | It is a measure of average data consumption by a smartphone user in a month. It is measured in gigabyte (GB). |
| Broadband Data Speed | It is the internet speed that is supplied over the fixed cable connection. Commonly, copper cable and optic fiber cable are used in both residential and commercial use. Here, optic cable fiber provides faster internet speed than copper cable. |
| Submarine Cable | A submarine cable is a fiber optic cable laid down at two or more landing points. Through this cable, communication and internet connectivity between countries across the globe is established. These cables can transmit 100-200 terabits per second (Tbps) from one point to another. |
| Carbon Footprint | It is the measure of carbon dioxide generated during the regular operation of a data center. Since, coal, and oil & gas are the primary source of power generation, consumption of this power contributes to carbon emissions. Data center operators are incorporating renewable energy sources to curb the carbon footprint emerging in their facilities. |


Research Methodology
Mordor Intelligence follows a four-step methodology in all our reports.
- Step-1: Identify Key Variables: In order to build a robust forecasting methodology, the variables and factors identified in Step-1 are tested against available historical market numbers. Through an iterative process, the variables required for market forecast are set and the model is built on the basis of these variables.
- Step-2: Build a Market Model: Market-size estimations for the forecast years are in nominal terms. Inflation is not a part of the pricing, and the average selling price (ASP) is kept constant throughout the forecast period for each country.
- Step-3: Validate and Finalize: In this important step, all market numbers, variables and analyst calls are validated through an extensive network of primary research experts from the market studied. The respondents are selected across levels and functions to generate a holistic picture of the market studied.
- Step-4: Research Outputs: Syndicated Reports, Custom Consulting Assignments, Databases & Subscription Platforms


