United States Real Estate Brokerage Market Size and Share
Market Overview
| Study Period | 2020 - 2031 |
|---|---|
| Forecast Data Period | 2026 - 2031 |
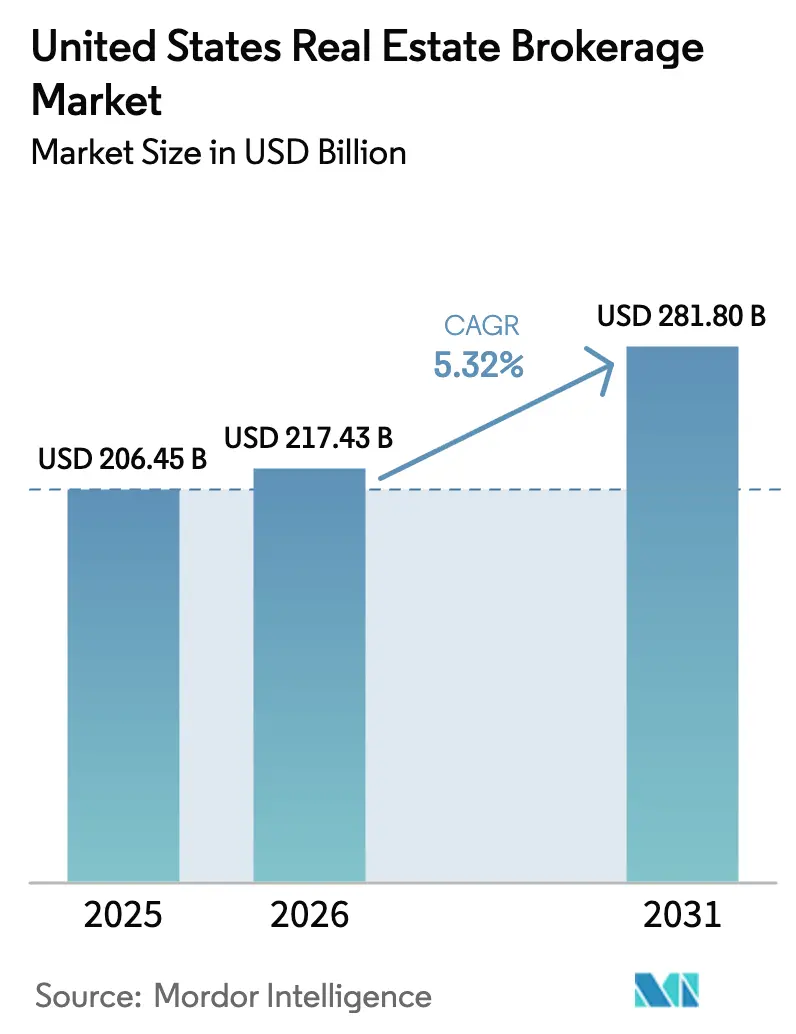
| Base Year Market Size (2025) | USD 206.45 Billion |
| Market Size (2026) | USD 217.43 Billion |
| Market Size (2031) | USD 281.80 Billion |
| Growth Rate (2026 - 2031) | 5.32% CAGR |
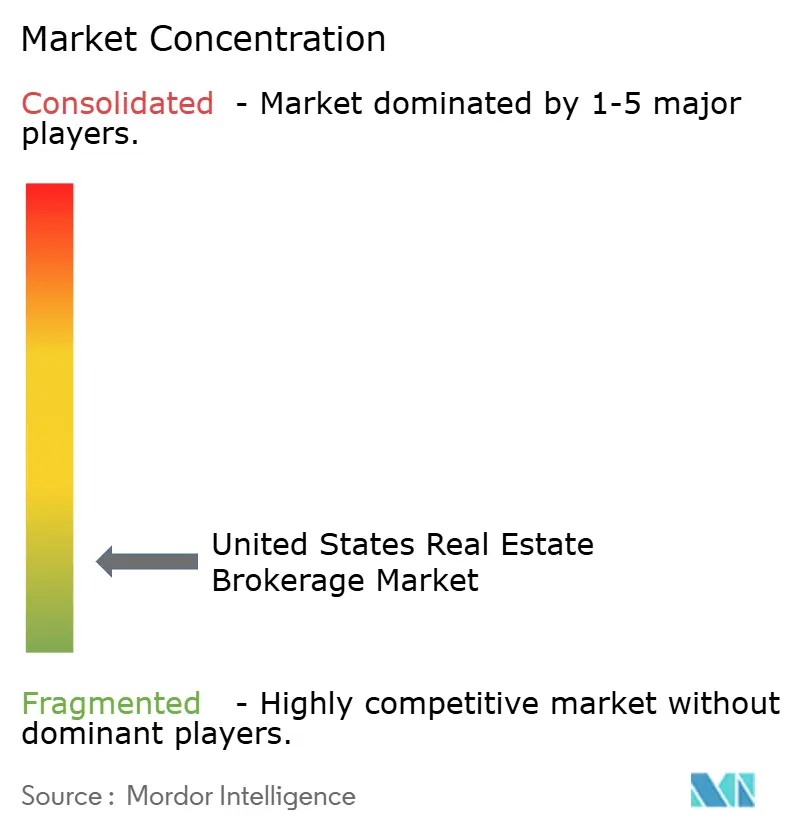
| Market Concentration | Low |
Major Players *Disclaimer: Major Players sorted in no particular order Image © Mordor Intelligence. Reuse requires attribution under CC BY 4.0. | |
United States Real Estate Brokerage Market Analysis by Mordor Intelligence
The United States Real Estate Brokerage Market size was valued at USD 206.45 billion in 2025 and is estimated to grow from USD 217.43 billion in 2026 to reach USD 281.80 billion by 2031, at a CAGR of 5.32% during the forecast period (2026-2031).
Mortgage rates hovering near 6.8% in early 2026 are suppressing purchasing power, yet elevated household formation and steady in-migration keep transaction pipelines active. Regulatory shifts following the November 2024 National Association of Realtors (NAR) settlement compel brokerages to decouple buyer-agent fees from Multiple Listing Service (MLS) displays, accelerating experimentation with flat-fee and rebate models. At the same time, the Department of Justice (DOJ) continues antitrust scrutiny, which nudges the industry toward transparent, value-based pricing. Cloud-enabled brokerages and artificial-intelligence (AI) valuation tools are compressing listing-to-closing cycles, helping firms offset commission pressure through higher volume and ancillary service bundling.
Key Report Takeaways
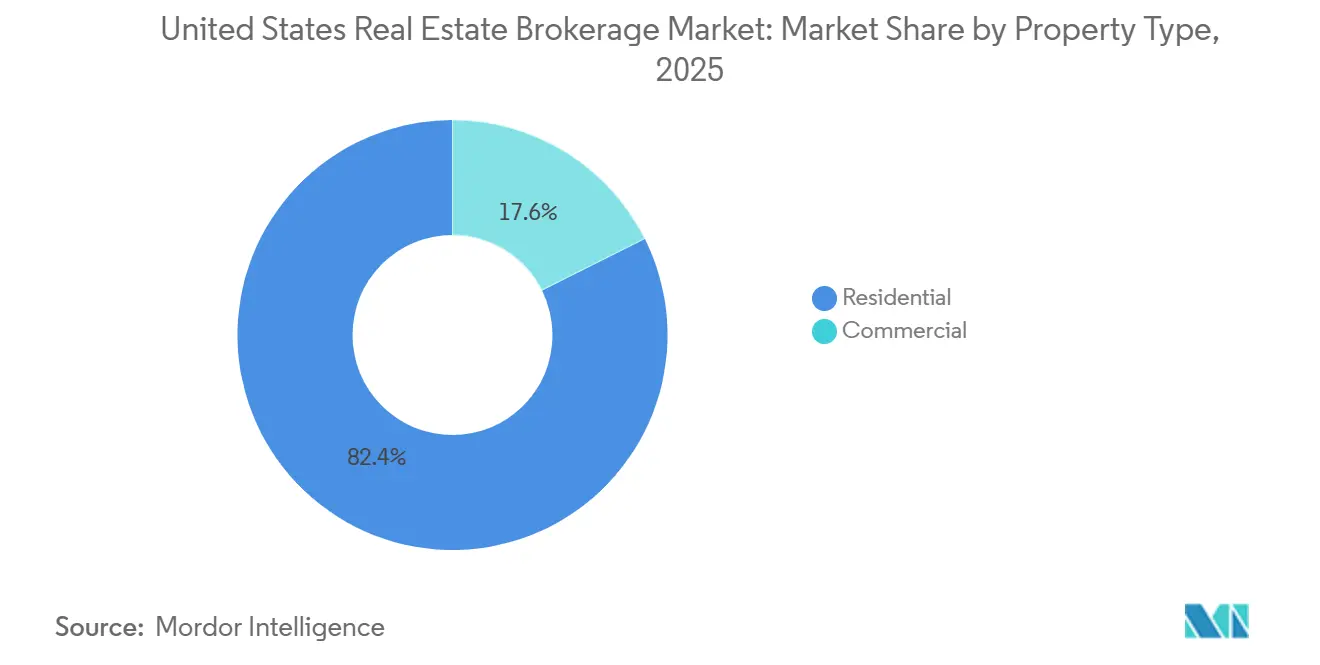
- By property type, residential brokerage commanded 82.40% of the United States real estate brokerage market share in 2025, while commercial transactions are forecast to expand at a 4.77% CAGR through 2031.
- By service, sales retained a 65.20% of the United States real estate brokerage market size in 2025, yet leasing and rental services are set to grow at a 5.09% CAGR through 2031.
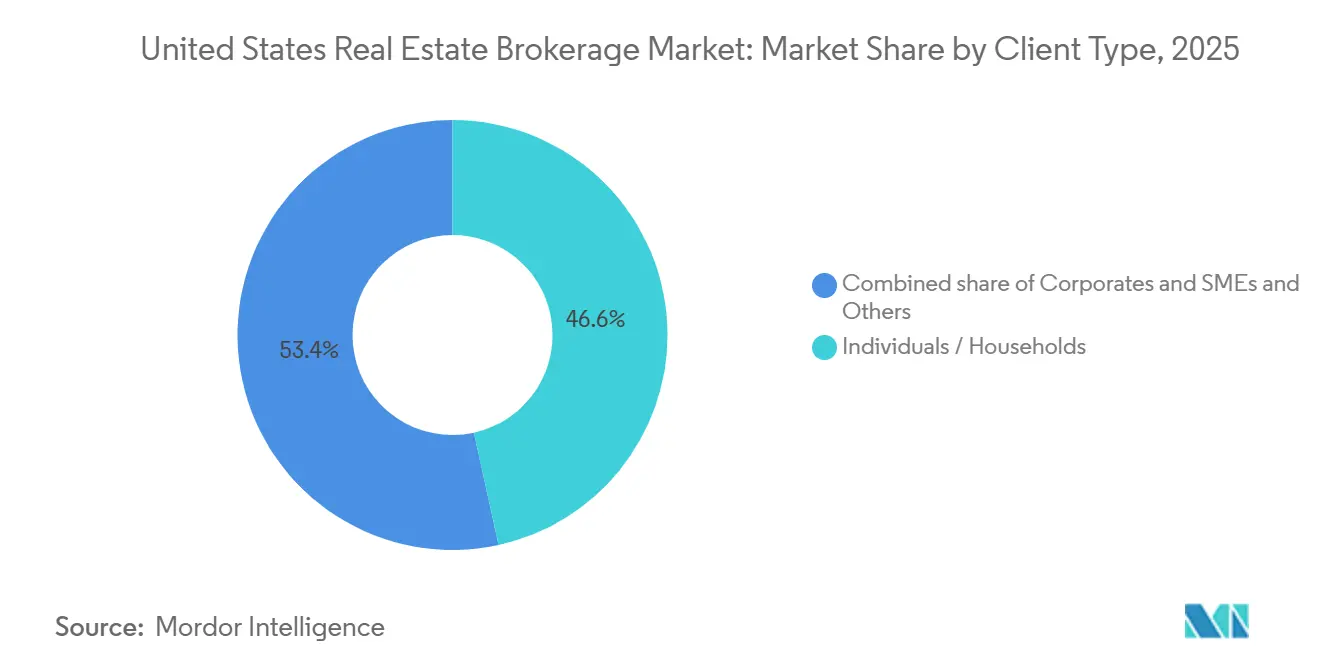
- By client type, individuals/households contributed 46.56% of the United States real estate brokerage market share in 2025, but corporate & SMEs clients are advancing at a 4.92% CAGR through 2031.
- By state, Texas captured 11.90% of of the United States real estate brokerage market size in 2025, whereas Illinois is projected to record the fastest growth at a 4.83% CAGR through 2031.
Note: Market size and forecast figures in this report are generated using Mordor Intelligence’s proprietary estimation framework, updated with the latest available data and insights as of January 2026.
United States Real Estate Brokerage Market Trends and Insights
Drivers Impact Analysis*
| Drivers | (~) % Impact on CAGR Forecast | Geographic Relevance | Impact Timeline |
|---|---|---|---|
| Rising housing demand and household formation increase residential property transaction volumes | +1.2% | National, with early gains in Texas, Florida, and Arizona | Medium term (2-4 years) |
| Recovery in housing inventory and new-build pipelines supports higher brokerage activity | +1.1% | National, strongest in Sunbelt states (Texas, Florida, Georgia, North Carolina) | Medium term (2-4 years) |
| Growing adoption of digital lead-generation platforms and CRM systems improves brokerage efficiency | +0.9% | National, concentrated in tech-forward metros (California, New York, Washington) | Short term (≤ 2 years) |
| Expansion of cloud-based and low-overhead brokerage models attracts new agents and firms | +0.7% | National, with rapid adoption in suburban and exurban markets | Short term (≤ 2 years) |
| AI-driven property valuation tools shorten the listing-to-closing transaction cycle | +0.6% | National, led by urban and high-transaction-volume markets | Short term (≤ 2 years) |
| Tokenized real estate deals create new brokerage revenue streams and fee pools | +0.3% | Pilot markets (New York, California, Florida) | Long term (≥ 4 years) |
| Source: Mordor Intelligence | |||
Rising Housing Demand and Household Formation Increase Residential Property Transaction Volumes
Millennials entering peak home-buying years and immigration-driven population growth produced 1.4 million new U.S. households in 2024, the highest reading since 2020. Robust household formation underpins the residential segment’s 82.40% revenue share, yet high prices push many first-time buyers toward rentals, which lengthens leasing cycles. Median household net worth climbed 23% between 2019 and 2025, consolidating wealth among owners and intensifying renter aspirations. New construction starts hit an annualized 1.56 million units in Q4 2025, signaling future inventory relief that should stabilize pricing and sustain volumes for the United States real estate brokerage market. Brokerages bundling mortgage pre-approvals, title services, and moving packages are capturing more fee income per deal, cushioning against commission compression.[1] U.S. Census Bureau, “Quarterly Residential Vacancies and Homeownership,” census.gov
Recovery in Housing Inventory and New-Build Pipelines Supports Higher Brokerage Activity
Active listings rose 14% year over year (YoY) to 1.08 million in December 2025, marking the healthiest year-end supply since 2019. Builder sentiment, tracked by the National Association of Home Builders, improved to an index level of 47 in December 2025 from 31 two years earlier, encouraging developers to accelerate spec-home activity. Single-family building permits exceeded 1.02 million in 2025, with Texas, Florida, and North Carolina accounting for the largest shares. An influx of listings boosts transaction counts for both buy- and sell-side agents in the United States real estate brokerage market, although competitive pressure can compress seller commission percentages when supply overshoots demand. Brokerages leveraging virtual tours and AI-driven pricing differentiate by moving inventory faster in high-listing environments.
Growing Adoption of Digital Lead-Generation Platforms and CRM Systems Improves Brokerage Efficiency
Subscription-based lead marketplaces such as Zillow Premier Agent charge between USD 350 and USD 1,500 per ZIP code, funneling exclusive prospects to agents and improving conversion rates. Realtor.com’s ReadyConnect Concierge increased successful closures by approximately 20% by relying on call-center vetting to deliver higher-quality leads. CRM suites like Follow Up Boss integrate MLS feeds, automated marketing, and task management, enabling solo agents to scale throughput comparable to small teams. The National Association of Realtors (NAR) noted CRM adoption climbed to 78% among agents in 2025, up from 62% in 2022. Firms lagging in tech enablement face higher agent churn as practitioners migrate toward brokerages offering stronger digital toolkits.[2]National Association of Realtors, “2025 Member Profile,” nar.realtor
Expansion of Cloud-Based and Low-Overhead Brokerage Models Attracts New Agents and Firms
The rapid expansion of cloud-based and low-overhead brokerage models is a primary driver transforming the United States real estate brokerage market. By eliminating the heavy financial burden of physical brick-and-mortar offices, virtual brokerages can offer highly competitive compensation packages, often featuring attractive commission splits and equity-sharing opportunities. This lucrative structure is aggressively pulling top-producing agents and newly formed teams away from traditional legacy firms. Furthermore, advanced digital infrastructure providing centralized virtual support, global collaboration, and streamlined transaction management empowers agents to scale their businesses efficiently. Consequently, this asset-light model is accelerating market fragmentation while driving overall operational modernization.
Restraints Impact Analysis*
| Restraints | (~) % Impact on CAGR Forecast | Geographic Relevance | Impact Timeline |
|---|---|---|---|
| Mortgage-rate volatility reduces buyer affordability and slows property transactions | -0.8% | National, most acute in high-cost coastal markets (California, New York, Massachusetts) | Short term (≤ 2 years) |
| NAR settlement changes trigger buyer-pays structures and intensify commission discount competition | -0.6% | National, early adoption in competitive markets (Texas, Florida, Arizona) | Short term (≤ 2 years) |
| Department of Justice scrutiny of buyer-agent commissions pressures traditional brokerage models | -0.5% | National, with heightened enforcement in major metros | Medium term (2-4 years) |
| Commission-free iBuyer platforms bypass traditional brokers and reduce brokerage participation | -0.3% | Urban and suburban markets with high iBuyer penetration (Phoenix, Atlanta, Charlotte) | Medium term (2-4 years) |
| Source: Mordor Intelligence | |||
Mortgage-Rate Volatility Reduces Buyer Affordability and Slows Property Transactions
The average 30-year fixed mortgage rate settled at 6.82% in January 2026, well below the October 2023 high of 7.79% yet double the pandemic-era lows. Elevated financing costs are reducing purchasing power, as a household budgeting USD 3,000 per month can now afford a USD 350,000 home compared with USD 450,000 at a 3.5% mortgage rate, shrinking the eligible buyer pool by 22%. The Federal Reserve signaled potential rate cuts later in 2026, but sticky inflation may keep rates above 6.0% into mid-2027. First-time buyers, only 26% of purchasers in 2025 compared with a historical 40%, feel the pinch most acutely. Transaction volumes in the United States real estate brokerage market, therefore, skew toward cash or high-equity buyers, eroding volume-driven revenue models.
NAR Settlement Changes Trigger Buyer-Pays Structures and Intensify Commission Discount Competition
Effective August 17, 2024, MLS systems removed buyer-agent commission displays and mandated written buyer-broker agreements before property tours. Early evidence shows median buyer-agent fees hovered between 2.37% and 2.43% through 2025, reflecting seller persistence in covering commissions. In 2026, however, more buyers negotiate fee rebates or limited-service engagements, pressuring the 2.5-3.0% norm, particularly in competitive Sunbelt metros. Discount models offering flat-fee listings as low as USD 3,000 gained traction after Redfin’s October 2024 national rollout. As price transparency deepens, brokerages in the United States real estate brokerage market must articulate differentiated value, local expertise, bundled services, or proprietary tech to command premium pricing.
*Our forecasts treat driver/restraint impacts as directional, not additive. The impact forecasts reflect baseline growth, mix effects, and variable interactions.
Segment Analysis
By Property Type: Residential Dominance Faces Commercial Acceleration
Residential brokerage delivered 82.40% of 2025 revenue for the United States real estate brokerage market share, buoyed by single-family, condominium, and apartment transactions. Logistics-driven industrial spaces, data centers, and mixed-use retail assets underpin commercial’s faster 4.77% CAGR forecast to 2031, outstripping the mature residential trajectory. Office leasing stabilized in late 2025, but the national vacancy near 18.2% restrains commission upside. Conversely, warehouse absorption of 400 million ft² in 2024 testified to e-commerce and near-shoring tailwinds. Brokerages specializing in industrial placements command higher per-deal fees and often secure retainer-based mandates from third-party logistics providers.
Residential sales retain momentum through elevated household formation, yet affordability gaps encourage many customers to transition into build-to-rent communities, expanding leasing commissions. The United States real estate brokerage market size for residential leasing is expected to broaden as institutional investors deepen single-family rental portfolios, providing steady engagements for brokerages with property-management arms. Commercial specialists differentiate via capital-markets advisory, tenant-rep services, and sale-leaseback structuring. Meanwhile, mixed-use projects blending residential, retail, and flexible office spaces foster cross-selling opportunities that enlarge brokerage wallet share. As sustainability mandates broaden, energy-efficient retrofits and green-lease clauses introduce advisory niches that further diversify fee pools.


By Service: Sales Lead, Yet Leasing Gains Ground
Sales transactions accounted for 65.20% of 2025 brokerage revenue, affirming their centrality to the United States real estate brokerage market. Nevertheless, leasing and rental services are growing at a 5.09% CAGR through 2031, riding on prolonged renter occupancy, corporate relocation, and the brisk expansion of build-to-rent supply. Build-to-rent completions reached 75,000 units in 2024, feeding a pipeline of ongoing lease commissions. Brokerages that offer turnkey lease-up, tenant-screening, and rent-collection services cement recurring revenue relationships compared with episodic sales fees.
Cross-selling maintenance coordination and eviction support further stabilizes cash flow amid sales-cycle volatility. The United States real estate brokerage market size linked to leasing is also cushioned against mortgage-rate spikes, as households priced out of ownership extend rental terms. Corporate accounts utilize brokerage partners to navigate space downsizing, flex-office solutions, and ESG-aligned lease structures. Over the forecast period, automated rent-payment portals and AI-driven tenant-credit scoring are expected to lift operating margins for full-service leasing divisions even as headline commission percentages edge lower.[3]National Association of Home Builders, “Build-to-Rent Report 2025,” nahb.org
By Client Type: Households Dominate, Corporates Accelerate
Individuals and households supplied 46.56% of 2025 brokerage revenue, making them the largest slice of the United States real estate brokerage market share. Yet corporates and SMEs segment is set to expand at a 4.92% CAGR through 2031 as companies optimize distributed-work footprints and relocate to lower-tax jurisdictions. Institutional single-family rental funds channel significant deal flow through dedicated brokerage desks, rewarding firms with national footprints and data analytics capabilities. High-net-worth buyers of luxury second homes increasingly demand concierge-level service bundles, from interior design referrals to property-management oversight, enhancing per-transaction revenue.
Government agencies, endowments, and real estate investment trusts (REITs) form the other client segment, which is expanding as public–private partnerships support affordable housing and infrastructure-related developments. Brokerages courting these sophisticated clients deploy research teams capable of zoning analysis, public-finance advisory, and structured-debt placement. Technology integration, including virtual deal rooms and blockchain-secured document vaults, bolsters compliance and speeds closings. As commission transparency tightens, differentiated advisory depth becomes the decisive lever for sustaining premium pricing in the United States real estate brokerage market.
Geography Analysis
Texas delivered 11.90% of national brokerage revenue in 2025, buoyed by a 470,000-person population influx in 2024 and double-digit new-housing permit growth in metros such as Houston and Dallas–Fort Worth. Although Austin faced localized oversupply that lengthened days-on-market, Sunbelt appeal drove sustained inbound migration. Florida’s retirement and remote-work magnetism powered robust brokerage volume in Tampa, Orlando, and Miami, even as insurance-premium inflation tempered higher-end demand. California continued to register the nation’s highest median prices, but transaction counts slipped as buyers decamped to lower-cost states; nevertheless, Silicon Valley cash buyers preserved luxury-segment turnover.
Illinois is forecast to clock the fastest 4.83% CAGR through 2031, propelled by Chicago’s renaissance as a logistics and tech-innovation hub. Industrial developments along Interstate 55 underpin warehouse brokerage demand, while suburban office revamps accommodate hybrid-work configurations. New York City regained rental momentum in 2025 on partial office-return mandates, lifting brokerage leasing fees. Across the broader United States real estate brokerage market, small-metro and rural areas account for the majority of aggregate commission pools, yet they grow more slowly due to thinner population bases and lower transaction velocities.
Regulatory variation influences competition, with Texas offering streamlined escrow processes while California requires disclosure-heavy closings, prompting multi-state brokerages to develop localized compliance expertise. Greater use of virtual tours in faster-growing markets also highlights a technological divide that benefits digitally advanced firms. National franchises leverage scale to harmonize compliance and technology spend, but entrenched regional specialists prosper on hyper-local knowledge, especially in states with idiosyncratic zoning codes such as New York’s co-op approvals. Shifts in insurance markets for example, carrier withdrawals from hurricane-exposed counties add a further variable that seasoned brokers navigate to preserve deal integrity.[4]U.S. Census Bureau, “2025 State-to-State Migration Flows,” census.gov
Competitive Landscape
Competition in the United States real estate brokerage market remains fragmented. Traditional franchises such as Keller Williams, RE/MAX, and Coldwell Banker lean on brand equity and in-house coaching, yet escalating agent splits and technology expenditure gnaw at margins. eXp Realty’s cloud office ignited rapid share capture by promising 80% splits plus equity participation, revealing the vulnerability of bricks-and-mortar networks to digital insurgents. Compass invests heavily in proprietary CRM, but sustaining growth demanded USD 270 million in 2024 losses, spotlighting the cost of tech-driven market entry.
Discount brokerages like Redfin and Clever Real Estate advertise 1.0–1.5% listing commissions or USD 3,000 flat fees, pressuring the customary 2.5–3.0% band. Yet consumer wariness about reduced service keeps their aggregate share below 5%. Meanwhile, iBuyer giants such as Opendoor, Offerpad, and a relaunched Zillow Offers provide instant liquidity, albeit at margins reliant on rapid resale in appreciating markets. Brokerages counter through partnership funnels or by offering bridge-financing programs that replicate certainty while preserving agency involvement.
Compliance and data security emerge as new competitive axes. Firms that swiftly implemented FinCEN ownership-reporting tools and revised buyer-broker workflows in line with the NAR settlement avoid fines and win consumer trust. AI-enhanced recruitment platforms help leading brokerages court top producers with customized compensation simulations, raising switching costs once equity vests. Niche specialists target luxury vacation rentals, senior-housing transitions, or foreign-investor concierge services areas where national franchises often lack bespoke expertise. With concentrated market share still limited, both regional breakouts and tech-first challengers retain significant headroom for organic and acquisitive growth.
United States Real Estate Brokerage Industry Leaders
Keller Williams Realty
RE/MAX
Berkshire Hathaway HomeServices
eXp Realty
Anywhere Real Estate
- *Disclaimer: Major Players sorted in no particular order

Recent Industry Developments
- March 2026: eXp Realty launched eXp New Homes, a specialized division and certification program to equip its agents to partner directly with developers, capturing a larger share of the new construction market.
- March 2026: Global advisory firm Savills announced a USD 1.2 billion agreement to acquire Eastdil Secured. This strategic move is designed to significantly boost Savills' global positioning and liquidity in commercial real estate capital markets.
- September 2025: Compass completed a USD 1.6 billion acquisition of Anywhere Real Estate, merging its proprietary tech with legacy brands like Coldwell Banker to create the largest U.S. residential brokerage platform.
- February 2025: Compass integrated Zillow’s ShowingTime+ scheduling platform into its agent dashboard, reducing appointment-setting times for more than 30,000 associates.


United States Real Estate Brokerage Market Report Scope
| Residential | Apartments and Condominums |
| Villas and Landed Houses | |
| Commercial | Office |
| Retail | |
| Logistics | |
| Others |
| Sales |
| Rental/Leasing |
| Individuals/Households |
| Corporates & SMEs |
| Others |
| Texas |
| California |
| Florida |
| New York |
| Illinois |
| Rest of the United States |
| By Property Type | Residential | Apartments and Condominums |
| Villas and Landed Houses | ||
| Commercial | Office | |
| Retail | ||
| Logistics | ||
| Others | ||
| By Service | Sales | |
| Rental/Leasing | ||
| By Client Type | Individuals/Households | |
| Corporates & SMEs | ||
| Others | ||
| By State | Texas | |
| California | ||
| Florida | ||
| New York | ||
| Illinois | ||
| Rest of the United States | ||


Key Questions Answered in the Report
How large is the U.S. real-estate brokerage business in 2026?
The United States real estate brokerage market stands at USD 217.43 billion in 2026 and is on course to reach USD 281.80 billion by 2031.
What is the current growth rate outlook?
Between 2026 and 2031, the market is projected to grow at a 5.32% CAGR, powered by household formation and technology-driven efficiency gains.
Which property segment generates the highest brokerage revenue?
Residential transactions remain dominant, capturing 82.40% of 2025 revenue, though commercial assets are expanding faster at a 4.77% CAGR.
How are new commission rules changing brokerage models?
The 2024 NAR settlement and ongoing DOJ scrutiny push firms to separate buyer-agent fees from list prices, sparking adoption of flat-fee, rebate, and buyer-pays structures.
Which states are driving brokerage growth?
Texas leads in absolute revenue share at 11.90%, while Illinois is forecast to post the quickest CAGR 4.83% through 2031 on the back of industrial and tech expansion.
Are technology platforms eroding traditional agent roles?
AI valuations, cloud office models, and iBuyer platforms reduce friction but have not displaced agents; instead, they reward brokers who integrate digital tools to enhance client service.
Page last updated on:


