
Market Overview
| Study Period | 2020 - 2031 |
|---|---|
| Forecast Data Period | 2026 - 2031 |
| Base Year Market Size (2025) | USD 1.03 Trillion |
| Market Size (2026) | USD 1.08 Trillion |
| Market Size (2031) | USD 1.39 Trillion |
| Growth Rate (2026 - 2031) | 5.11 % |
| Market Concentration | Low |
Major Players *Disclaimer: Major Players sorted in no particular order Image © Mordor Intelligence. Reuse requires attribution under CC BY 4.0. | |
US Hospitality Real Estate Market Analysis by Mordor Intelligence
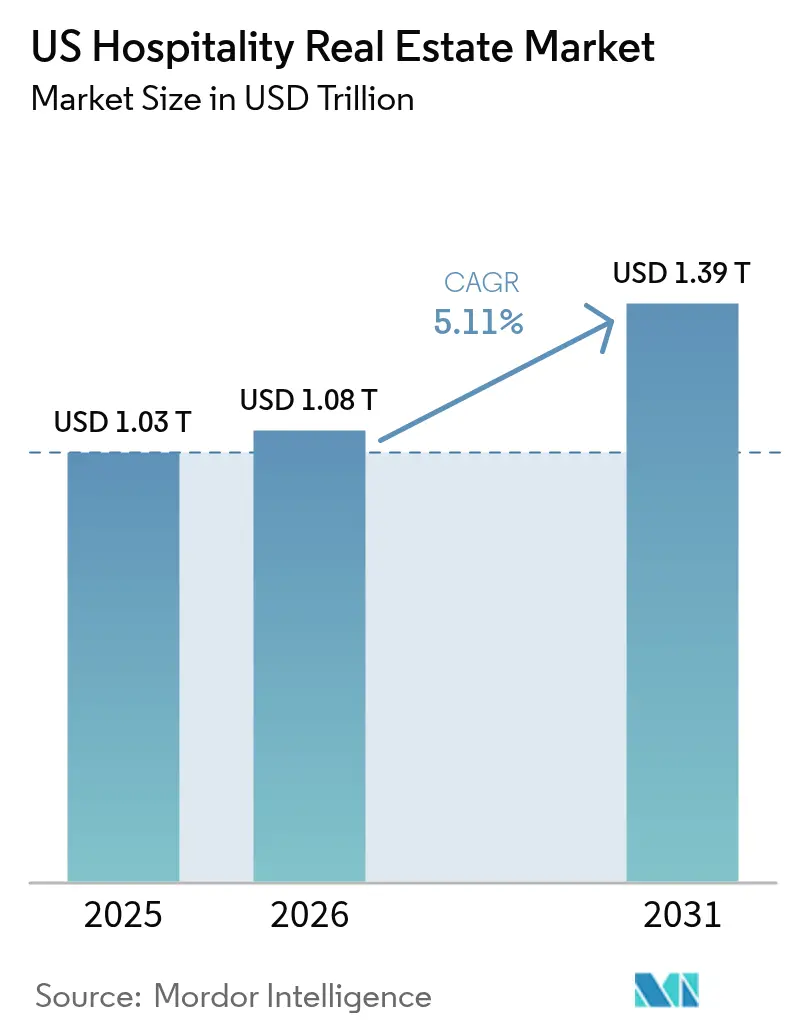
The USA hospitality real estate market size is expected to grow from USD 1.03 trillion in 2025 to USD 1.08 trillion in 2026 and is forecast to reach USD 1.39 trillion by 2031 at 5.11% CAGR over 2026-2031. Demand resilience is anchored in revived leisure, business, and hybrid “bleisure” trips, a development pipeline heavily weighted toward select-service assets, and steady gains in revenue management efficiency. Urban gateways are enjoying occupancy and ADR premiums over suburban corridors as international arrivals rebound, while Sun Belt destinations capitalize on inward population migration and corporate relocations. Operators are refurbishing aging stock, converting under-performing brands, and deploying data-rich loyalty ecosystems to widen margins even as persistent labor shortages lift wage bills. High construction and borrowing costs temper new-build activity, meaning the existing asset base should capture the bulk of incremental demand and support pricing power across most chain scales.
Key Report Takeaways
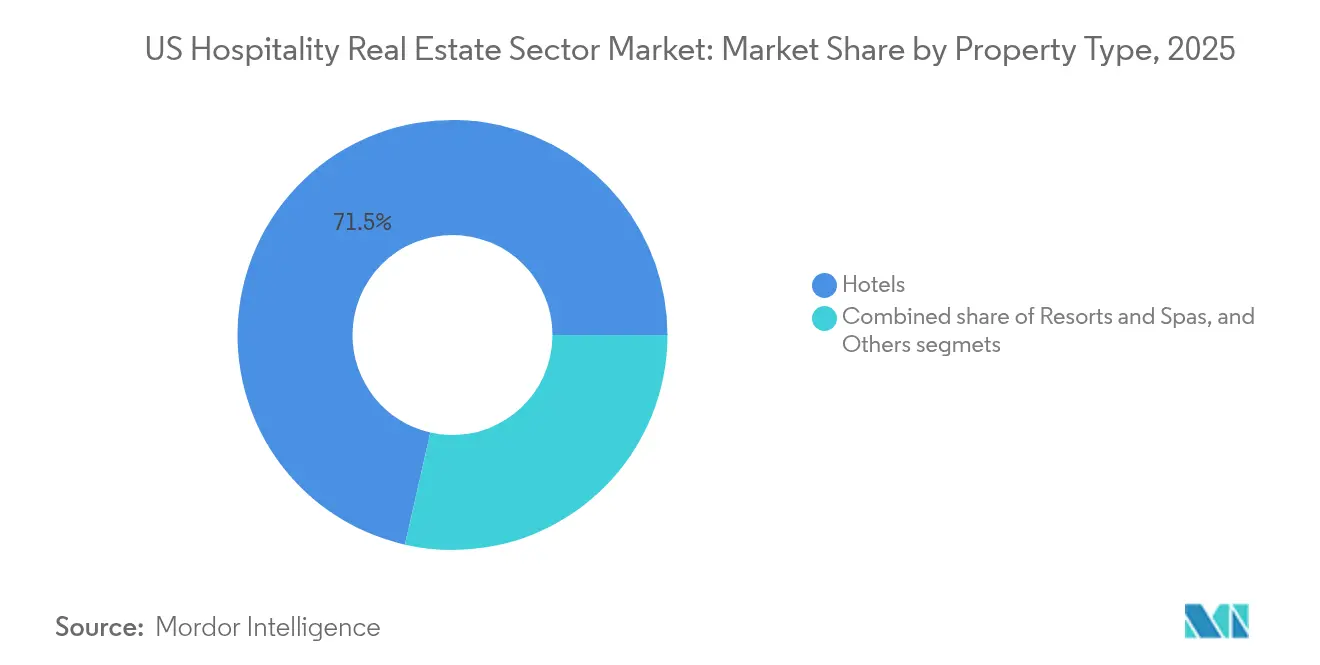
- By property type, Hotels led with 71.45% of the USA hospitality real estate market share in 2025. Others, serviced apartments, boutique inns, and similar formats, are forecast to expand at a 5.62% CAGR through 2031.
- By type, Chain Hotels held 67.10% of the USA hospitality real estate market size in 2025, while Independent Hotels are projected to post the fastest segment CAGR at 5.67% to 2031.
- By asset class, Mid-scale properties accounted for 41.85% of the 2025 base, whereas Luxury assets are advancing at a 5.86% CAGR through 2031.
- By States, California captured 18.55% of the total 2025 value, and Florida is expected to log the highest state-level CAGR at 6.03% during the forecast horizon.
Note: Market size and forecast figures in this report are generated using Mordor Intelligence’s proprietary estimation framework, updated with the latest available data and insights as of 2026.
US Hospitality Real Estate Market Trends and Insights
Drivers Impact Analysis*
| Drivers | ( ~ ) % Impact on CAGR Forecast | Geographic Relevance | Impact Timeline |
|---|---|---|---|
| Leisure, business, and “bleisure” travel recovery sustaining RevPAR and occupancy in core markets | +1.2% | Global, strongest in New York City and Orlando | Medium term (2-4 years) |
| Data-driven revenue management and loyalty ecosystems enhancing yield optimization | +0.9% | Global, led by large chain operators | Medium term (2-4 years) |
| Strength of select-service and extended-stay formats underpinning development pipelines | +0.8% | National, concentrated in Sun Belt and secondary cities | Long term (≥ 4 years) |
| Brand conversions and repositioning’s improving NOI and asset competitiveness | +0.6% | National, early gains in gateway metros | Short term (≤ 2 years) |
| Adaptive reuse of office/retail space into hotels adding accretive supply in urban cores | +0.4% | New York City, San Francisco, Chicago | Long term (≥ 4 years) |
| Source: Mordor Intelligence | |||
Leisure, Business, and “Bleisure” Travel Recovery Sustaining RevPAR and Occupancy in Core Markets
The convergence of leisure travel demand and the gradual recovery of corporate travel itineraries is fostering extended "bleisure" stays. These stays are diminishing the distinction between weekdays and weekends, contributing to an increase in average daily rates. In January 2025, RevPAR recorded a year-on-year growth of 4.5%. Urban room supply is anticipated to surpass suburban supply with an additional 2.8% growth. The resurgence of group business is evident in Marriott's improved food-and-beverage revenue from convention bookings. Hospitality operators who successfully attract flexible workers for mid-week stays are achieving more consistent cash flows and optimized labor scheduling. The continuation of these positive trends will depend on the pace at which global corporate travel budgets stabilize and the persistence of hybrid work models.
Strength of Select-Service and Extended-Stay Formats Underpinning Development Pipelines
Amid 10-12% construction debt costs, developers are increasingly prioritizing select-service and extended-stay hotel formats. These models require lower capital investment per key, operate with streamlined staffing structures, and deliver strong profit margins. As of early 2025, approximately 157,000 hotel rooms were under construction across the United States, with a substantial share concentrated in these segments. Marriott's USD 355 million acquisition of citizenM, along with its licensing agreement with Sonder, is set to add nearly 19,000 technologically advanced rooms, catering to the preferences of digitally oriented travelers. Sun Belt metropolitan areas, including Phoenix, Charlotte, and Nashville, continue to attract these developments due to competitive land costs and favorable demographic trends.
Data-Driven Revenue Management and Loyalty Ecosystems Enhancing Yield Optimization
Marriott Bonvoy, with its 237 million members, now contributes to over 60% of the brand's occupied room nights. These members generate detailed demand insights that drive the company's AI-powered pricing systems. Similarly, Hilton and IHG leverage comparable platforms to implement real-time rate adjustments, optimized based on competitive benchmarks and booking windows. This approach enhances revenue per available room and increases ancillary revenue streams. Personalized offers, informed by loyalty program data, foster extended customer lifecycles and reduce customer acquisition costs. These strategic advantages are likely to further strengthen the competitive position of large hotel chains over smaller independent operators. Consequently, investments in advanced technology function as both a growth enabler and a catalyst for market consolidation.
Brand Conversions and Repositioning Improving NOI and Asset Competitiveness
Capital-efficient brand transitions enable property owners to modernize aging assets, increase Average Daily Rates (ADR), and expand distribution reach, all while mitigating the risks associated with new developments. In 2024, Host Hotels & Resorts allocated USD 1.5 billion toward acquisitions, achieving a 2.1% increase in Total Revenue Per Available Room (RevPAR) following repositioning efforts. Similarly, Pebblebrook Hotel Trust concluded a USD 525 million redevelopment initiative, which upgraded lobbies, food and beverage venues, and guest technology, driving occupancy growth despite challenging macroeconomic conditions. Independent operators are increasingly adopting soft brands to integrate local distinctiveness with global reservation systems, particularly in key gateway cities where brand premiums yield significant value.
Restraints Impact Analysis*
| Restraints | ( ~ ) % Impact on CAGR Forecast | Geographic Relevance | Impact Timeline |
|---|---|---|---|
| Labor shortages and wage inflation pressuring operating margins | -1.1% | National, acute in coastal metros | Medium term (2-4 years) |
| High construction costs and financing rates slowing new project starts | -0.7% | National, toughest in secondary markets | Short term (≤ 2 years) |
| Demand sensitivity to macro uncertainty and corporate travel normalization cycles | -0.5% | Global, heavier on business-centric cities | Short term (≤ 2 years) |
| Source: Mordor Intelligence | |||
Labor Shortages and Wage Inflation Pressuring Operating Margins
Hotels are still short by about 190,000 positions compared to their 2019 headcount and are resorting to higher wages to attract talent. In 2023, the sector's average hourly wage hit USD 17.16, marking a 26.7% increase since the pandemic. This wage hike has compelled operators to boost productivity in housekeeping and adopt digital check-in processes. By 2025, total payroll expenses are set to near USD 128.47 billion, consuming a significant portion of the revenue gains from Average Daily Rate (ADR) increases. While industry groups push for larger visa quotas and more apprenticeship incentives, the persistent workforce gaps indicate that elevated compensation has become the norm. This trend is particularly straining the margins of midscale and economy segments[1]Andrew Hunter, “Occupational Employment and Wage Statistics—Accommodation Industry, May 2023,” U.S. Bureau of Labor Statistics, bls.gov.
High Construction Costs and Financing Rates Slowing New Project Starts
Spot costs for steel, labor, and building systems remain elevated, and 10-12% construction loan coupons make pro-forma returns unattractive, especially in secondary metros where ADR ceilings are lower. Some sponsors pivot to acquiring existing assets at below-replacement pricing, channeling capex into renovations rather than new flags. The supply brake supports the pricing power of incumbent assets but may restrict room availability in high-growth nodes, nudging operators to dynamic pricing strategies to balance utilization and customer satisfaction.
*Our forecasts treat driver/restraint impacts as directional, not additive. The impact forecasts reflect baseline growth, mix effects, and variable interactions.
Segment Analysis
By Property Type: Hotels Hold Scale Advantages Amid Rising Alternatives
In 2025, hotels held 71.45% of the U.S. hospitality real estate market, driven by strong brand equity, distribution networks, and operational efficiency. The remaining market share was split among resorts, spas, conference centers, and the "Others" category, which includes serviced apartments and boutique accommodations. The "Others" segment, growing at a 5.62% CAGR, is projected to account for 12.5% of new supply by 2031, fueled by demand for unique ambiances and flexible layouts. Major hotel chains are leasing inventory to operators like Sonder and enhancing loyalty programs to attract new customers. Traditional hotels retain pricing power, optimizing rates during peak periods to sustain revenue dominance.
Alternative accommodations are gaining traction, but hotels' pricing resilience supports cash flows. Resorts and spas benefit from wellness tourism and affluent leisure travel, with Host Hotels & Resorts investing over USD 400 million in 2025 to upgrade spa, dining, and sustainability offerings. The "Others" segment’s growth reflects a shift toward longer stays and home-like amenities, boosting mid-term rentals in urban markets. Investors monitor income volatility across segments, noting traditional hotels’ stronger weekday occupancy and serviced apartments’ consistent weekend and extended-stay performance.



By Type: Chain Hotels Command Share as Independents Capture Differentiated Demand
Chain Hotels secured 67.10% of 2025 value, underpinned by ubiquitous reservation platforms and the draw of massive loyalty bases. For example, Hilton’s pipeline of 510,600 rooms reflects owner confidence in brand power to accelerate ramp-up curves. Independents carved out a 5.67% CAGR outlook by leaning into localized design, culinary individuality, and direct-booking engagement to tap authenticity-seeking guests. Third-party managers and soft brands supply independents with revenue management and distribution expertise, narrowing historical capability gaps.
Chain networks harness data scale to sharpen yield strategies, extracting incremental revenue per occupied room and boosting ancillary spend through mobile upsells. That edge may widen as artificial intelligence becomes embedded in pricing, service recovery, and labor scheduling. Independents counter through hyper-local partnerships, curated spaces, and agile leadership structures able to pivot swiftly to emerging trends. Their gains are concentrated in leisure-led micro-markets and adaptive-reuse landmarks, reinforcing the richness of America’s hospitality offer while intensifying competitive differentiation.
By Asset Class: Mid-scale Stability Versus Luxury Momentum
Mid-scale assets represented 41.85% of the 2025 base and remain the bedrock of the USA hospitality real estate market share, serving business transients and cost-conscious leisure party mixes. Their historically consistent occupancy shelters cash flow, but wage pressure and limited ADR headroom could impair margin expansion. Luxury stock, though smaller, enjoys outsized upside with a 5.86% CAGR outlook as high-net-worth travelers resume long-haul itineraries and corporations reinstate premium incentive trips. Limited new luxury supply, due to sky-high build costs, elevates RevPAR potential and asset valuations for incumbent owners.
Affordable/Budget tiers struggle to pass through higher labor and utilities expenses, prompting operators to automate front-of-house processes and pare non-essential services to defend profitability. Upper-upscale and Luxury properties invest aggressively in wellness, F&B, and ESG retrofits to justify rate premiums and reinforce brand promise. The barbell dynamic, buoyant Luxury on one end and reliable Mid-scale on the other, suggests moderate erosion for full-service Upscale unless they redefine value propositions for a more polarized demand profile.

Geography Analysis
California generated 18.55% of the USA hospitality real estate market size in 2025, sustained by a blend of tech-driven corporate travel, global entertainment tourism, and coastal resort traffic. Limited developable land and stringent building codes suppress new supply in Los Angeles and San Diego, preserving ADR pricing power. Northern California’s rebound in business travel post-return-to-office policies strengthens weekday occupancy, though wage pressure and urban regulatory costs weigh on margins.
Florida leads future growth with a forecast 6.03% CAGR to 2031, bolstered by year-round leisure appeal, convention center expansions in Orlando and Miami, and a favorable tax climate attracting corporate meetings. Population inflow fuels domestic demand, and cruise-related pre- and post-stay nights add incremental occupancy layers. Resort acquisitions from REITs underline capital’s confidence in the Sunshine State’s secular upside.
Texas remains a cornerstone market, supported by energy, aerospace, and technology employers that anchor weekday demand in Houston, Dallas, and Austin. The state’s lighter regulatory regime and lower unionization aid profit margins, while an influx of corporate headquarters underpins a pipeline of select-service and extended-stay developments tailored to relocating staff. Austin’s events calendar, from SXSW to Formula 1, injects high-rate compression nights that boost annualized RevPAR.
New York is still an indispensable gateway as international arrivals climb toward pre-pandemic peaks. Manhattan’s prohibitive land costs and strict zoning restrain new hotel starts, conferring pricing leverage on existing stock. Yet elevated property taxes and compliance mandates tighten margins, making asset management discipline vital. Chicago, representing Illinois’ benchmark, leverages its central location and mature convention infrastructure, though it contends with winter seasonality and rising intra-Midwest competition.
Secondary and tertiary cities collectively labeled the “Rest of US” are accruing outsized share of net new supply. Nashville, Charlotte, and Raleigh-Durham attract institutional capital with pro-business policies and cultural cachet. Lower site costs, streamlined permitting, and robust population growth grant these metros favorable development economics, allowing owners to achieve target yields even under high interest-rate conditions. This mosaic of regional demand balances the broader USA hospitality real estate market, diffusing concentration risk and widening investor optionality.
Regulatory Landscape
US hospitality real estate development and operations sit under layered federal accessibility, life-safety, and labor oversight, with state and local rules shaping permitting and operating models. The 2010 ADA Standards for Accessible Design (28 CFR 36.406) provide the federal baseline for accessibility in new construction and alterations of transient lodging, which affects capex planning and renovation scope. On life safety, 15 USC 2225 links places of public accommodation to fire prevention requirements such as smoke detection and automatic sprinkler system standards (for example, NFPA 13 or 13-R in applicable multi-story facilities), reinforcing how code-driven building systems feed into underwriting and retrofit decisions.
Labor-related rulemaking can also swing compliance priorities for hotel owners and operators, given labor intensity and the prevalence of tipped roles. In 2026, the US Department of Labor advanced rulemaking activity covering tip credits, child labor, independent contractor status, and joint employment standards (submitted to the White House OMB), with targeted 2026 finalization timelines referenced for child labor and independent contractor actions. Separate from that, state-level short-term rental (STR) preemption activity, such as new 2026 laws in Idaho (HB 583) and Indiana (HEA 1210) limiting local ability to ban STRs outright, influences competitive supply dynamics for transient lodging in certain markets by shifting regulation toward permits and safety standards rather than prohibitions.
Value Chain Analysis
The US hospitality real estate value chain typically separates asset ownership from brand and operating know-how. Owners (including REITs, private equity, and high-net-worth investors) supply capital and hold real-estate risk, while hotel brands set standards, manage distribution, and run loyalty ecosystems through franchise or management agreements, often supported by third-party managers. Development and repositioning then move through site acquisition, entitlement, design, financing, construction, and commissioning, followed by ramp-up operations and ongoing asset management focused on revenue management systems, property improvement plans (PIPs), and brand compliance.
On the supply side, the construction and renovation ecosystem includes general contractors, specialty trades, and a large FF&E procurement layer (rooms, public space, kitchens, and back-of-house). Tariff and freight volatility on items such as furniture and cabinetry can affect renovation economics, since FF&E can represent a meaningful share of refurbishment budgets. AAHOA cited a one-year delay of scheduled tariff increases on upholstered furniture, kitchen cabinets, and bathroom vanities in January 2026 as an input-cost relief point. Pipeline data also shows how supply is being shaped by a mix of new-build and conversions, with Q1 2026 reporting 6,020 projects and 705,825 rooms in the US pipeline and notable conversion volume (1,461 projects and 141,971 rooms), which highlights the role of adaptive reuse and brand conversion specialists alongside traditional ground-up developers.
Competitive Landscape
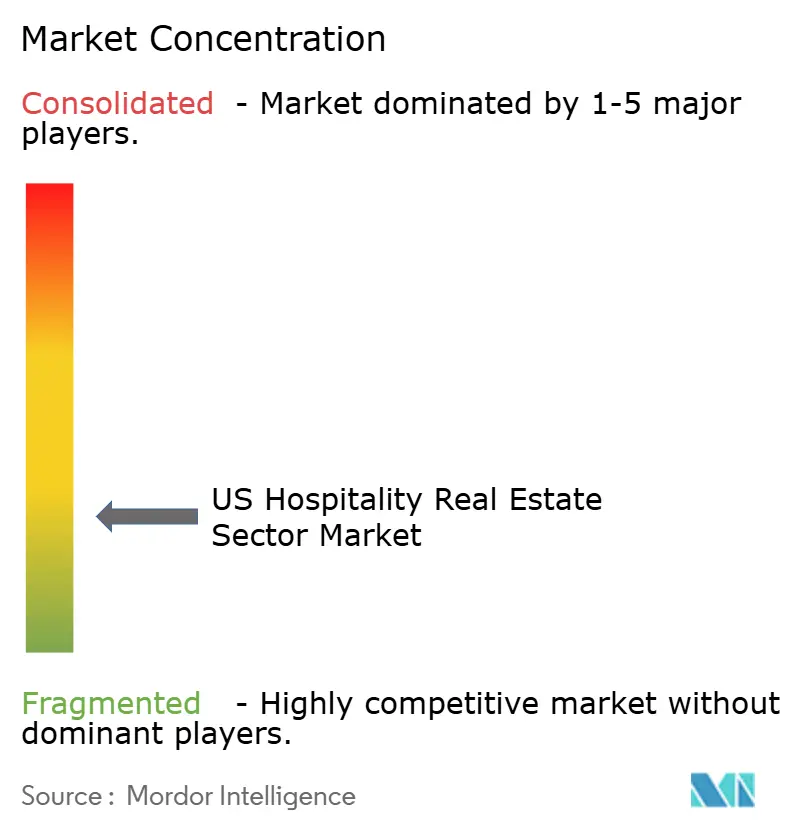
Ownership remains fragmented because global operators largely pursue franchise and management-agreement models, limiting direct real-estate exposure. Marriott’s USD 355 million citizenM purchase and Sonder licensing partnership illustrate a selective return to asset-light acquisitions that add lifestyle inventory without material balance-sheet strain. Operators increasingly distinguish themselves by technology adoption, ESG commitments, and loyalty scale rather than physical room counts.
Host Hotels & Resorts, Park Hotels & Resorts, and Pebblebrook Hotel Trust focus on asset repositioning and disciplined capital recycling to outperform. Host’s acquisition of 1 Hotel Central Park for USD 265 million and The Ritz-Carlton O’ahu for USD 680 million bolster its luxury tilt and geographic diversity. Competitors watch for return metrics as REITs deploy significant capex into energy-efficiency retrofits, rooftop solar, and storm-hardening, aiming to lower cost of capital and attract ESG-oriented shareholders.
Lifestyle and extended-stay challengers, aided by nimble operating models, are eroding chain loyalty among younger cohorts. CitizenM’s self-check-in kiosks and communal-space emphasis typify the tech-enabled experience economy, while residential-inspired brands such as Sonder woo remote workers requiring longer stays. Traditional chains respond with micro-brands and adaptive-reuse prototypes to guard share. As capital tightens, brand platforms offering superior booking engines, procurement savings, and labor-light service scripts should consolidate weaker players, nudging the market toward moderate concentration by decade-end.
US Hospitality Real Estate Industry Leaders
Marriott International
Hilton Worldwide Holdings
IHG Hotels & Resorts
Wyndham Hotels & Resorts
Choice Hotels International
- *Disclaimer: Major Players sorted in no particular order

Market Opportunities and Future Outlook
Higher financing and construction costs are pushing growth toward renovation, conversion, and repositioning, which widens the opportunity set for capital providers and operators able to execute faster-cycle upgrades and brand transitions. The conversion activity reported in Q1 2026 (1,461 projects and 141,971 rooms) supports investment focus on office and retail adaptive reuse, older full-service refreshes, and soft-brand conversions in gateway markets where distribution and loyalty premiums can lift ADR. Supply-chain turbulence also increases the value of procurement platforms and owner-led sourcing strategies, especially for FF&E-heavy renovation programs where tariff shifts can change total project cost and timing.
Operational technology is also moving from optional to core in hotel real estate underwriting, particularly for labor productivity and yield management. Evidence of broad digital adoption, including cloud PMS penetration cited at 71% in 2026 and AI usage among larger hotels, supports opportunities in tech-enabled select-service and extended-stay formats, where lean staffing models and centralized revenue management align with investor return targets. Alongside this, the Q1 2026 pipeline showing a record luxury project count (102 projects) and brand moves into wellness-oriented luxury, such as Marriott bringing Lefay into its portfolio through a joint venture, point to a differentiated demand and product opportunity around wellness, experiential F&B, and ESG retrofits that support rate premiums while improving operating efficiency.
Recent Industry Developments
- July 2026: Hilton advanced plans to expand the Hilton Marco Island Beach Resort and Spa with a proposed second tower, entering a local rezoning process in Florida. The project highlights how coastal, leisure-heavy markets are using expansion and redevelopment to add keys where land is constrained, while managing entitlement risk as part of the investment thesis.
- June 2026: Marriott International announced a joint venture with the founders of Lefay to bring the luxury wellness brand into its global portfolio, with integration into Marriott Bonvoy planned as part of the rollout. The partnership strengthens Marriott's positioning in wellness-led luxury and shapes capex and development priorities toward experience-heavy assets that support ADR premiums.
- July 2024: Host Hotels & Resorts acquired The Ritz-Carlton O'ahu for approximately USD 680 million, adding a recently renovated 450-room luxury resort to its portfolio. The transaction emphasized how large lodging REITs recycle capital into high-barrier, resort-driven markets, where refurbishment and brand strength influence asset values.


Research Methodology Framework and Report Scope
Market Definition and Coverage
For this methodology, the US hospitality real estate market covers the value of lodging real estate assets that generate revenue by leasing rooms or units to guests, including hotels, motels, resorts, and similar accommodation property types.
Scope exclusions: We exclude non-lodging hospitality revenue streams such as standalone restaurants, travel booking services, and pure operating revenue that is not linked to owning or controlling real estate.
Segmentation Overview
- By Property Type
- Hotels
- Resorts & Spas
- Others (Serviced Apartments, boutique inns, etc)
- By Type
- Chain Hotels
- Independent Hotels
- By Asset Class
- Affordable/Budget
- Midscale
- Luxury
- By States
- Texas
- California
- Florida
- New York
- Illinois
- Rest of US
Data Sources, Market Sizing, and Validation
Desk Research
Desk work starts by mapping the investable hospitality property universe in the US and then checking how travel demand, pricing, and financing conditions are moving across cycles. We relied on public and official sources such as the US Bureau of Economic Analysis for travel and consumption signals, the US Census Bureau for construction and business patterns context, the Bureau of Labor Statistics for wages and inflation indicators that affect operating costs, and the Federal Reserve Economic Data portal for interest rates and broader macro series that influence cap rates.
To keep the real estate lens grounded, we also referenced open industry and association publications, such as the American Hotel and Lodging Association and state level tourism and lodging bodies, along with company filings, investor presentations, and transaction coverage from reputed press. A paid subscription for company financials and a news and financials platform helped confirm ownership structures, portfolio shifts, and major deal timing, which were then discussed again in interviews to reduce assumption drift. The sources listed above are illustrative, and many other public and paid references were also used for data collection, cross-checks, and clarification.
Primary Interviews and Surveys
Primary inputs were gathered through expert interviews and surveys with owners, asset managers, lenders, brokers, developers, and operating-side leaders who influence underwriting and pricing. These conversations helped validate occupancy and rate expectations, renovation and conversion pipelines, refinancing availability, and how investors are treating different lodging formats across major US states and both urban and leisure destinations.
Distribution of primary research fieldwork respondents
| Company type | Respondent position |
|---|---|
| Top tier: 33% | CXOs: 18% |
| Mid tier: 45% | Functional/Unit leaders: 36% |
| Smaller Players: 22% | Managers: 46% |
Market-Sizing & Forecasting
The market is first built using the top-down and bottom-up combination where US hospitality real estate value is reconstructed from demand and valuation signals, and then corroborated using selective roll-ups. On the top-down side, the model uses inputs such as room supply changes (openings and removals), occupancy movement, average daily rate direction, revenue per available room trend, and interest rate driven cap rate shifts, because these variables explain how asset values re-rate over time.
Once the total is formed, we validate it using smaller approximations, like sample portfolio valuation disclosures, transaction pricing per key, and simple value math using observed income yields where those data points were available and consistent. Forecasting is mainly done through scenario analysis, where occupancy and ADR paths, new supply timing, and financing costs are adjusted in line with what interviewees expect for business and leisure travel. Where visibility is limited for niche property formats, conservative gap fills are applied using comparable state benchmarks and recent transaction ranges, followed by re-checks during review.
Data Validation & Update Cycle
Outputs are checked against independent signals, including major transaction activity, public lodging REIT disclosures, changes in debt pricing, and the direction of hotel operating metrics. When a variance is large, the driver is traced back to the assumption that caused it (for example, a cap rate jump or a step-change in ADR), and follow-up calls are triggered if the shift looks structural.
Before sign-off, the model goes through multiple review passes so the logic, units, and conversions line up across years. Reports are refreshed annually, and interim updates are made when material events occur, such as sharp rate moves or large transaction waves. Right before delivery, we do a final pass so the latest public data and interview signals are reflected.
Mordor Intelligence's USA Hospitality Real Estate Sector Market Estimate Compared With Other Published Estimates
Published market sizes for US hospitality real estate can vary even when the titles sound similar, because the counted asset pool and valuation lens are not always the same. The split usually starts with whether the number represents a standing value of lodging assets, a narrower investable subset, or a combined real estate and hospitality basket.
The biggest gap drivers come from scope boundaries and valuation timing. Some sources mix in non-US assets under North America totals, and others blend hospitality with broader real estate categories, which mechanically lifts the value. By keeping the count limited to US lodging property value and refreshing cap rate assumptions using interest rate direction and lodging operating metrics, the spread is reduced in a repeatable way, which is the treatment applied by Mordor Intelligence.
Benchmark comparison
| Source | Market Size | Gaps in Research Methodology |
|---|---|---|
| Mordor Intelligence | USD 1.03 T (2025) | |
| Trade Journal A | USD 1.21 T (2024) | Uses a North America total with a 2024 base year, which can include Canada or regional aggregation effects and may not isolate US-only lodging asset value in the same way. |
| Cross-Sector Publisher B | USD 4.80 T (2026) | Combines real estate and hospitality into one market, which expands the scope beyond lodging real estate and lifts the number to a much broader asset universe. |
The table shows that differences are mainly explained by what is being counted and how the valuation year is defined. When the asset pool stays lodging-specific and the valuation drivers are tied back to observable performance and financing indicators, the market size is easier to track and re-check over time.


Key Questions Answered in the Report
What is the projected value of the USA hospitality real estate market in 2031?
The sector is forecast to reach USD 1,388.67 billion by 2031.
Which property type is growing fastest within U.S. hospitality real estate?
Serviced apartments and boutique inns, grouped under “Others,” are expanding at a 5.62% CAGR through 2031.
Why are select-service and extended-stay hotels favored by developers?
Lower build costs per key, lean staffing models, and resilient margins make these formats attractive during high-rate financing cycles.
How are labor shortages impacting hotel profitability?
Wage growth of 26.7% since 2020 raises payroll to a projected USD 128.47 billion in 2025, pressuring margins across most chain scales.
Page last updated on:


 Your data is secure and never sold or shared.


