Market Overview
| Study Period | 2020 - 2031 |
|---|---|
| Forecast Data Period | 2025 - 2031 |
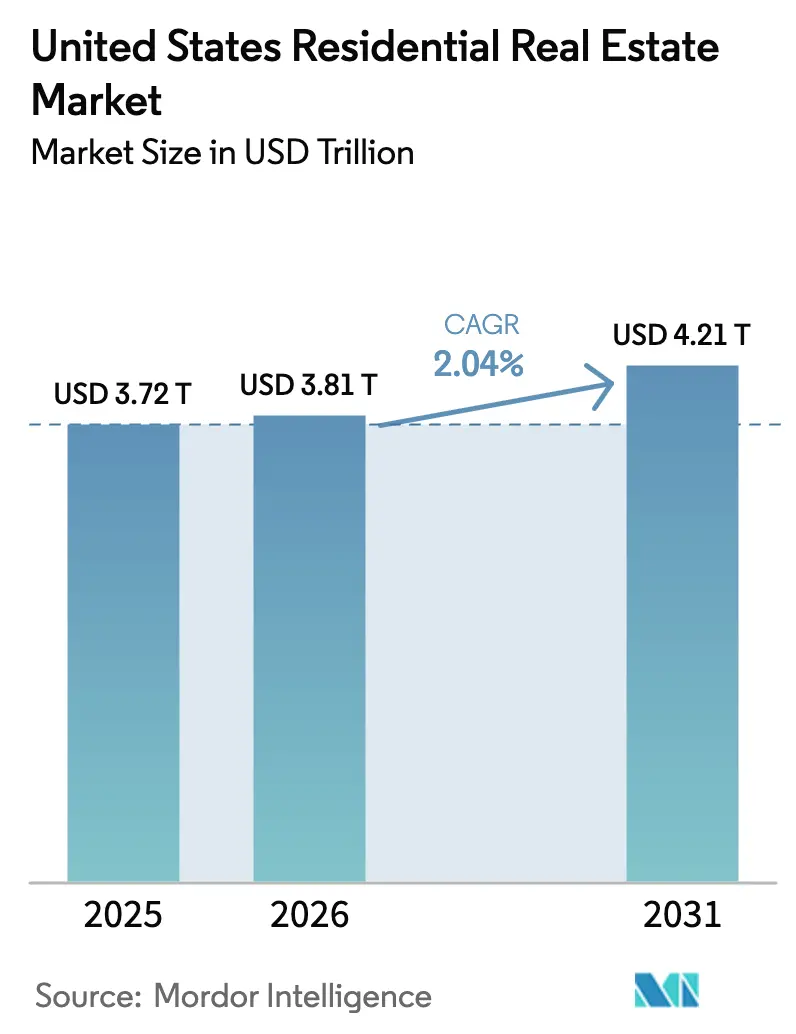
| Base Year Market Size (2025) | USD 3.72 Trillion |
| Market Size (2026) | USD 3.81 Trillion |
| Market Size (2031) | USD 4.21 Trillion |
| Growth Rate (2025 - 2030) | 2.04% CAGR |
| Market Concentration | Medium |
Major Players *Disclaimer: Major Players sorted in no particular order Image © Mordor Intelligence. Reuse requires attribution under CC BY 4.0. | |
United States Residential Real Estate Market Analysis by Mordor Intelligence
The United States Residential Real Estate Market size is estimated at USD 3.81 trillion in 2026, and is expected to reach USD 4.21 trillion by 2031, at a CAGR of 2.04% during the forecast period (2026-2031). Easing mortgage rates late in 2025 and wage growth outpacing home price gains are improving affordability, which is stabilizing demand and supporting a gradual normalization of transaction activity. Pending home sales rose 3.3% month over month in November 2025, the strongest print in nearly three years, signaling the release of pent-up demand into early 2026. Supply remains tight because the mortgage lock-in effect continues to suppress resale listings even as builders add inventory and deploy incentives to defend volume in price-sensitive submarkets. Insurance costs have become a national headwind after a 21% year-over-year jump between 2023 and 2024, and rising premiums are especially burdensome in high-exposure geographies like Florida, where average annual costs now exceed USD 6,000.[1]https://www.iii.org/
Key Report Takeaways
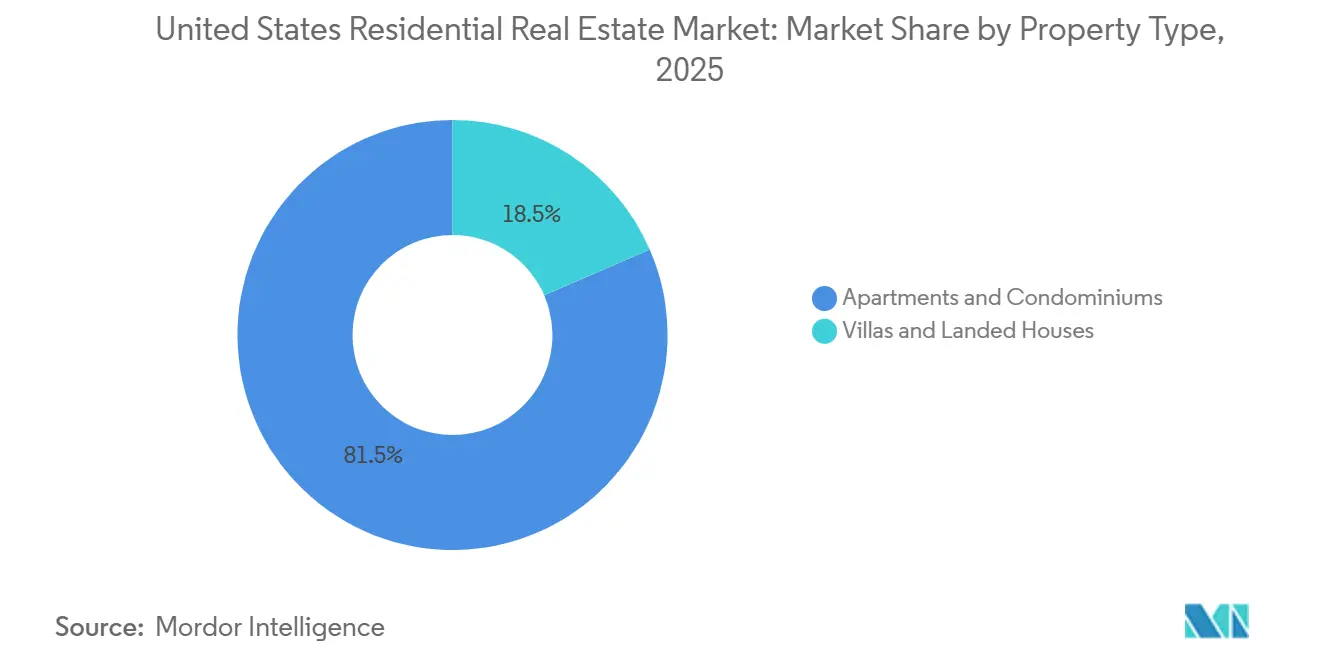
- By property type, apartments and condominiums led with 81.50% of the U.S. residential real estate market share in 2025, and they are forecast to expand at a 2.13% CAGR through 2031.
- By business model, the sales segment held 78.55% in 2025, while rental is projected to record the highest growth at a 2.29% CAGR through 2031.
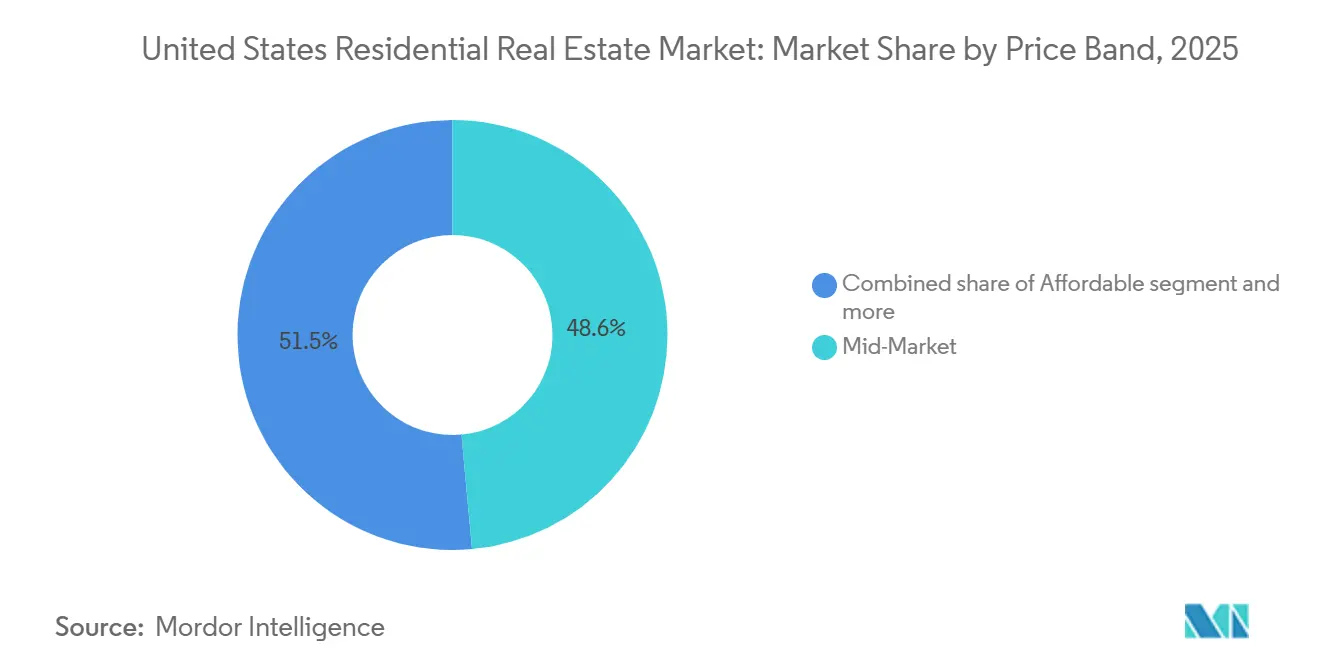
- By price band, the mid-market captured 48.55% in 2025, while the affordable tier is forecast to grow the fastest at a 2.22% CAGR to 2031.
- By mode of sale, secondary transactions represented 88.44% of volume in 2025, while primary new-builds are projected to expand at the fastest pace with a 2.35% CAGR through 2031.
- By state, California captured 14.5% share in 2025, while New York is forecast to expand at a 3.10% CAGR through 2031.
Note: Market size and forecast figures in this report are generated using Mordor Intelligence’s proprietary estimation framework, updated with the latest available data and insights as of January 2026.
United States Residential Real Estate Market Trends and Insights
Drivers Impact Analysis*
| Drivers | (~) % Impact on CAGR Forecast | Geographic Relevance | Impact Timeline |
|---|---|---|---|
| Mortgage rates easing and improving affordability | +0.7% | Texas and Illinois strongest, California and New York tighter, Florida mixed, Rest of US varied | Medium term (2-4 years) |
| Pent-up demand reflected in rising pending sales | +0.5% | Broad-based across Texas, California, Florida, New York, Illinois, and the Rest of US | Short term (≤ 2 years) |
| Builder incentives and new-home supply narrowing the price gap | +0.4% | Texas and Florida, selected California metros, Rest of US growth corridors | Medium term (2-4 years) |
| Wage growth outpacing home price gains supports absorption | +0.3% | Illinois and Texas, with spillover to Florida and the Rest of US | Long term (≥ 4 years) |
| Assumable FHA/VA mortgages unlocking low-rate financing | +0.1% | Elevated in Texas and California, also present in Florida and the Rest of US | Short term (≤ 2 years) |
| ADU financing expansion, adding hidden density | +0.2% | California primary, with traction in New York and pilots in Texas, plus Rest of US where local rules enable | Long term (≥ 4 years) |
| Source: Mordor Intelligence | |||


Mortgage Rates Easing and Improving Affordability
The 30-year fixed mortgage rate averaged 6.15% in December 2025, which was the lowest monthly reading of the year and a notable improvement from late 2024 levels as monetary policy shifted toward easing. The Federal Reserve’s rate cuts placed the policy range at 3.5-3.75% by December 2025, which anchored expectations for steadier borrowing costs into 2026 and reduced volatility for buyers and sellers in the US residential real estate market. Forecasts for 2026 indicate rates trending toward the high 5% range, which would expand the pool of qualified borrowers and support incremental gains in purchase applications. As wages outpace recent home price increases, payment-to-income ratios improve most in states with better alignment between incomes and medians such as Illinois and Texas, while affordability remains tighter in California and New York and is mixed in Florida due to insurance add-ons [2]https://www.federalreserve.gov/. The net effect is a gradual but broad-based lift in absorption that supports a measured recovery across the US residential real estate market in 2026
Pent-Up Demand Reflected In Rising Pending Sales
Pending home sales rose 3.3% month over month in November 2025 and reached their highest level in nearly three years, which signals a release of deferred demand into early 2026. Gains were broad-based across all four regions, pointing to a national rather than local inflection in buyer activity. Improved affordability and a modest expansion in active listings are giving buyers more options, and that is translating into higher contract signings. Purchase application trends and showing activity support a firmer transaction pipeline, which should lift closed sales as the U.S. residential real estate market transitions into the spring season. Even small rate declines can move marginal borrowers over approval thresholds, which boosts conversion and amplifies the near-term recovery in volumes.[3]https://www.nar.realtor/
Builder Incentives and New-Home Supply Narrowing The Price Gap
The median price gap between new and existing homes narrowed to a multi-decade low by mid-2025, and in select submarkets new homes priced at parity or even slight discounts to comparable resales, which reshaped buyer preference in active construction corridors. Large builders used rate buydowns and closing-cost credits to lower effective payments, with captive mortgage channels coordinating approval speed and pipeline certainty across communities in Texas and Florida and in selected California metros. Incentive packages also included smaller floor plans and reduced lot sizes to land affordable monthly payments while preserving absorption, which positioned new homes as a competitive option against scarce resales in the US residential real estate market. This pricing and financing strategy is most evident where land pipelines are deeper and development cycles are faster, which aligns with Texas and Florida and parts of the Rest of US that retain production capacity. As incentives compress the gap with resales, new-build share is positioned to remain elevated relative to pre-pandemic norms in 2026 in the US residential real estate market.
Wage growth outpacing home price gains supports absorption
Median household income growth surpassed national home price appreciation in late 2025, which reduced payment-to-income strain and supported buyer qualification in mainstream price bands that dominate volumes. States where incomes and prices are more closely aligned, such as Illinois and Texas, benefit most from this rebalancing as buyers clear underwriting thresholds with fewer concessions in the US residential real estate market. In contrast, high-cost areas like California and New York continue to exhibit stretched multiples at the median, which skews activity toward cash buyers and higher equity move-up participants. As income growth sustains and inflation pressures moderate, absorption improves across the affordable and mid-market tiers, and that helps maintain occupancy in professionally managed rentals while supporting gradual movement into ownership. These conditions contribute to a steadier path for the US residential real estate market through 2031.
Restraints Impact Analysis*
| Restraints | (~) % Impact on CAGR Forecast | Geographic Relevance | Impact Timeline |
|---|---|---|---|
| Mortgage-rate lock-in suppressing listings and mobility | -0.8% | Nationwide, with acute effects in New York and Illinois where tenure is longer, plus Rest of US | Long term (≥ 4 years) |
| Insurance and climate-exposure costs reducing affordability | -0.6% | Florida and California, with spillover into Rest of US wildfire zones | Medium term (2-4 years) |
| Older-condo reserve/financing rules constraining transactions | -0.2% | New York, Florida, and Illinois, plus Rest of US legacy towers | Short term (≤ 2 years) |
| Source: Mordor Intelligence | |||
Mortgage-Rate Lock-In Suppressing Listings and Mobility
An estimated 80% of mortgage borrowers hold rates below the December 2025 market average, which creates a powerful disincentive to list and repurchase at higher costs. Inventory remains 25% below pre-pandemic norms in many metros, and that tightness keeps prices firm despite slower volumes. The affordability gap for move-up or lateral buyers is material, and it functions as a de facto mobility tax that reduces turnover across age cohorts. Transaction chains that rely on move-down sellers are also affected, which constrains entry-level inventory in popular school districts and established neighborhoods. A durable easing in mortgage rates would alleviate this restraint, and some forecasts project rates closer to the high 5% range by late 2026, which would unlock more listings over time. Until then, the U.S. residential real estate market will contend with structurally low resale supply relative to demand.
Insurance And Climate-Exposure Costs Reducing Affordability
Homeowners insurance premiums increased 21% nationally between 2023 and 2024, and carriers have pulled back from high-risk markets and tightened underwriting, which raises total ownership costs. Florida homeowners now face average annual premiums above USD 6,000, and in some coastal areas, costs reach much higher levels, which can add USD 500 or more per month to housing outlays before taxes and HOA fees. Academic and policy research links rising premiums to elevated default risk and downward price pressure, suggesting insurance inflation can spill into credit performance and valuations. California’s 2025 regulatory pivot, allowing catastrophe modeling and reinsurance costs in filings, aims to stabilize insurer participation, but it also validates double-digit increases in higher-risk zones. FAIR Plan enrollment has surged, and California’s pool exceeded 610,000 policies by mid-2025, which underscores private market stress in exposure-heavy areas. These cost dynamics are a measurable drag on the U.S. residential real estate market, where climate risks are concentrated.
*Our forecasts treat driver/restraint impacts as directional, not additive. The impact forecasts reflect baseline growth, mix effects, and variable interactions.
Segment Analysis
By Property Type: Apartments And Condominiums Anchor Urban Density
Apartments and condominiums captured 81.50% of total value in 2025, reflecting strong urban and inner-ring suburban demand that favors maintenance-free living, walkability, and proximity to employment centers. This concentration also mirrors the depth of institutional capital in multifamily formats and the scale benefits associated with professionally managed buildings. Developers are leaning into smaller average unit sizes and amenity-light formats that align with target rents, which supports occupancy and stabilizes absorption even as new deliveries crest in 2025–2026. Detached product remains relevant for family renters, and single-family rental communities have gained traction as a complementary path to meet household formation in growth corridors.
Builder incentives have narrowed the price gap with resales in several Sun Belt metros, which bolsters multifamily competitiveness in new-home communities that share school zones and commute sheds with established neighborhoods. Institutional developers continue to prioritize infill opportunities and transit-served sites in markets with durable job growth and supply constraints, which supports pricing over the forecast period. Zoning reforms that introduce missing-middle formats, including townhomes and small multiplexes, are expanding the attainable housing toolkit in select jurisdictions. These conditions position apartments and condominiums to remain the core of the U.S. residential real estate market through 2031, both as owner-occupied stock and as professionally managed rentals.


By Business Model: Sales Dominates, Rental Expands Faster
Sales comprised 78.55% in 2025 as ownership remains the default path for many households in Texas, California, Florida, New York, and Illinois as well as the Rest of US . Rate buydowns, smaller footprints, and targeted credits keep payments within reach, which helps the sales channel preserve volume during lock-in constrained periods in the US residential real estate market. Resales are limited by low listing flow, so builders and lenders coordinate closely to deliver certainty and speed for qualified buyers who prioritize new-home warranties and modern energy standards. The US residential real estate industry is also adapting workflow tools that streamline pre-approvals and closings, which support throughput during the 2026 normalization. These elements maintain sales primacy even as other channels gain share in the US residential real estate market.
Rental is projected to grow faster at a 2.29% CAGR through 2031 as single-family rental communities scale and professionally managed multifamily assets deliver location and service benefits across large metros in the US residential real estate market. Texas and Florida saw significant single-family rental community delivery in 2025, which moderated rent growth due to increased supply, while New York and Illinois multifamily maintained pricing power amid tighter pipelines. Institutional ownership of single-family rentals remains a minority of the total stock, which leaves room for consolidation and professionalization that can lift operating metrics over time. As affordability improves, some higher-income renters convert to ownership while lifestyle renters remain active in well-located communities, which supports a two-track expansion in the US residential real estate market. These patterns suggest durable rental growth as part of a balanced channel mix in the US residential real estate market.
By Price Band: Affordable Segment Gains As Mid-Market Holds Volume
The mid-market tier, defined as 80% to 120% of area median values, held the largest share at 48.55% in 2025, supported by a concentration of transactions among first-time buyers, repeat movers, and downsizing households. This band remains the transaction fulcrum in many metros because it aligns most closely with median incomes and standard mortgage underwriting. Builders are addressing price sensitivity with smaller footprints, attached formats, and targeted incentives that reduce initial monthly payments and expand eligibility. The U.S. residential real estate industry has also seen renewed emphasis on attainable townhome clusters and energy-efficient entry-level products supported by local planning reforms. These patterns sustain mid-market volume leadership while affordability constraints gradually ease with rate moderation.
The affordable tier is the fastest-growing price band, with a projected 2.22% CAGR through 2031, reflecting both policy support and builder pivots to reach sub-USD 350,000 price points in secondary markets. By 2024, homes under USD 200,000 accounted for only 6.13% of sales in Florida, which underscores how constrained the low-price inventory became and why the new-build response is central to expanding supply in this tier. Luxury transactions remained resilient into late 2025, with median luxury prices at USD 1.26 million and year-over-year gains of 5.0%, while inventory rose 7.7% as sellers tested demand with stock-market gains supporting down payments and cash purchases. In the middle of the distribution, steady wage growth and slight rate relief are restoring payment-to-income ratios that support mid-market resales, which remain the backbone of transaction activity. Together, these shifts help rebalance the U.S. residential real estate market as builders and policy adapt to affordability realities.
By Mode of Sale: Secondary Resales Anchor Volume, New-Builds Lead Growth
Secondary resales accounted for 88.44% in 2025 due to the large installed base and the appeal of established neighborhoods and school districts across the key states and the Rest of US. Lock-in suppressed listings and kept resale inventories below long-run averages, which maintained pricing even as volumes ran below historical norms in the US residential real estate market. Builders narrowed the price gap by reducing lot sizes and adjusting specifications so that total monthly payments aligned with underwriting thresholds, which redirected buyers toward primary new homes in selected corridors. In markets where new construction exists at scale, buyers favored modern efficiency, warranty coverage, and flexible closing timelines when premiums were minimal. This interplay guided transaction mix across Texas, California, Florida, New York, Illinois, and the Rest of US in the US residential real estate market.
The US residential real estate market size for primary new-builds is projected to expand at a 2.35% CAGR through 2031, and growth concentrates where production capacity and land pipelines are deeper such as in Texas and Florida and in parts of the Rest of US. In those areas, new homes frequently trade at parity with resales due to incentives and design efficiencies, while in places with thin new-home supply like dense parts of New York and Illinois, premiums persist because of scarcity and modern code benefits. Builders and institutional single-family rental operators also increased use of forward purchase arrangements and developer lending, which secured pipelines and reduced execution risk in the US residential real estate market. These tactics underpin the structural role of new-builds as the growth engine as resale listings recover more slowly from lock-in effects in the US residential real estate market.
Geography Analysis
Texas, California, and Florida account for a significant share of activity by virtue of population scale and construction capacity, while New York and Illinois anchor large legacy housing stocks with deep resale markets and the Rest of US captures a wide range of growth corridors that reflect similar fundamentals to the national trajectory in the US residential real estate market. Texas communities benefit from production scale and builder incentives that reduce effective monthly payments, which helps new-home absorption even while resale listings remain scarce due to mortgage-rate lock-in. Florida presents a mix of strong in-migration and heavy insurance premiums that lift monthly carrying costs, which changes qualification math for many median earners and preserves demand for new-builds that offer buydowns to land approvals in the US residential real estate market. California is positioned for incremental capacity through accessory dwelling units because statewide mandates and Fannie Mae’s updated income treatment enable owner-occupants to finance small-scale density in high-demand neighborhoods. These states set the tone for volumes while the Rest of US mirrors the pattern of easing rates meeting steady wage growth in the US residential real estate market.
New York and Illinois reflect the dynamics of large legacy condo and co-op stocks and of urban neighborhoods where agency approvals hinge on reserve adequacy and maintenance health, which shapes financing availability and sales velocity for older buildings in the US residential real estate market. Upstate New York markets show buyer interest from relocators seeking relative value, while New York City continues to concentrate activity among higher equity buyers and investors when medians are stretched. Chicago neighborhoods in Illinois maintain rental occupancy due to solid job bases and steady pipelines, which supports rent growth within a narrow band while ownership transactions stabilize as rates ease. Both states will see more ADU-linked financing in select jurisdictions that streamline permitting, though most near-term capacity will come from existing-home turnover and targeted infill in the US residential real estate market. As reserve compliance and maintenance backlogs are resolved, condo liquidity should improve, which will aid entry-level and downsizing cohorts over the forecast horizon in the US residential real estate market.
Competitive Landscape
Brokerage remains structurally fragmented, while technology platforms and institutional single-family rental operators continue to scale, creating a dual-track competitive environment. The announced all-stock merger between Compass and Anywhere Real Estate targets operating synergies and cross-selling across franchise, title, escrow, and relocation services, which could deepen platform integration across the transaction stack when it closes in 2026. Even at that scale, the combined entity still captures less than a quarter of annual U.S. home sales, which highlights persistent fragmentation and the importance of localized agent networks. Technology-first models continue to emphasize end-to-end workflows and lead routing tools that benefit high-performing agents and improve conversion in a low-inventory environment.
On the technology front, Zillow rolled out its AI-enabled Zillow Pro suite for agents, with nationwide availability targeted in 2026, and expanded consumer discovery with a listings app inside ChatGPT, which integrates search and tour scheduling pathways. eXp Realty introduced the Mira platform to streamline agent workflows and launched new international operations, extending its cloud brokerage footprint and recruiting reach. These moves reflect a broader shift toward AI-driven productivity and platform consolidation that reduces time per transaction while improving client engagement. As adoption scales, these tools can shift share in the U.S. residential real estate market toward platforms that close the loop across lead, finance, and close.
Institutional operators are expanding build-to-rent pipelines through financing partnerships and forward purchase options with builders, which secures inventory and reduces execution risk. Invitation Homes launched a developer lending program in 2025, including an initial USD 32.7 million loan for a Houston community with an option to acquire upon stabilization, which illustrates a supply-chain strategy to lock in product before lease-up. American Homes 4 Rent expanded to more than 61,000 homes across 24 states, opened its 200th new community, and maintained a land pipeline exceeding 10,000 lots, which underpins new-build delivery visibility. These growth initiatives, combined with compliance capabilities around fair housing and data privacy, create operating moats that are difficult for smaller owners and brokers to match within the U.S. residential real estate market.
United States Residential Real Estate Industry Leaders
Invitation Homes Inc.
Equity Residential
AvalonBay Communities Inc.
American Homes 4 Rent
Brookfield Residential Properties Inc.
- *Disclaimer: Major Players sorted in no particular order

Recent Industry Developments
- October 2025: Zillow debuted the only real estate app available in ChatGPT through a strategic partnership with OpenAI, bringing Zillow's real-time listings, financing options, and housing insights to conversational AI. The app, live for all logged-in ChatGPT users in the U.S. on Free, Plus, and Pro plans, allows users to search for homes via natural language prompts and seamlessly transition to the full Zillow experience for scheduling tours, connecting with agents, or exploring mortgage pre-approval. Plans include integrating new-construction listings and immersive 3D tours.
- October 2025: eXp Realty unveiled Mira, a new AI technology platform designed to streamline agent operations and enhance client experience, during its eXpcon Miami event. The company also announced entry into three new international markets, the Netherlands, Luxembourg, and Romania, and launched eXp Sports & Entertainment, a new division within eXp Luxury aimed at serving high-profile clients. eXp's global network now exceeds 82,000 agents across 29 countries.
- October 2025: Zillow Group launched Zillow Pro, an AI-powered suite of products for real estate agents integrating Follow Up Boss CRM, My Agent, and Agent Profiles, with nationwide availability targeted for mid-year 2026. The platform expansion reflects Zillow's continued investment in software to help agents capture business and meet consumer needs, and Zillow Pro will become the primary qualification pathway for the Zillow Preferred performance-based partner program once fully rolled out.
- June 2025: Invitation Homes launched a developer lending program to finance new build-to-rent community development and secure future acquisitions, with the first agreement providing a USD 32.7 million loan to a homebuilder for a 156-home community in Houston. The development secures the loan and includes an option for Invitation Homes to acquire the community upon stabilization, a structure anticipated to be replicated across multiple markets.


Research Methodology Framework and Report Scope
Market Definitions and Key Coverage
Our study frames the United States residential real estate market as the total dollar value of completed transactions in newly built and existing housing units, single-family homes, apartments, and condominiums sold or rented for private dwelling purposes across all 50 states during a calendar year. Values capture the full property consideration (land and structure) at closing or lease initiation rather than brokerage fees.
Scope exclusions include timeshares, cooperative housing shares, vacation rentals shorter than six months, and any commercial mixed properties that are not counted.
Segmentation Overview
- Sales
- Rental
Detailed Research Methodology and Data Validation
Primary Research
We complemented desk findings with semi-structured interviews and pulse surveys of homebuilders, multifamily operators, title insurers, and state-licensed agents across the Northeast, Sunbelt, Midwest, and Pacific regions. Their ground-level intelligence on deal velocity, incentive use, and net effective pricing helped stress-test secondary data and refine vacancy, absorption, and average-sale-price (ASP) assumptions.
Desk Research
Mordor analysts opened with a sweep of authoritative, non-paywalled sources such as the U.S. Census Bureau's Building Permits Survey, Federal Reserve Economic Data for mortgage costs, HUD's Comprehensive Housing Market Analyses, and National Association of Realtors monthly sales releases. Macro context on household formation and migration patterns was drawn from BEA personal-income tables and Bureau of Labor Statistics employment data. Select insights on capital flows came from D&B Hoovers and Dow Jones Factiva. These sources illustrate market scale, price dynamics, and regulatory backdrops; yet they rarely align on valuation baselines. Therefore, they serve as guardrails, not final answers. The list is indicative, and many additional publications were reviewed to verify trends and numeric consistency.
Market-Sizing & Forecasting
A top-down build converts national housing stock, turnover ratios, and median transaction prices into a gross market pool, which is then cross-checked through selective bottom-up rollups of public builders' closings and sampled ASP × unit volumes. Key model inputs include the annual mover rate, single-family housing starts, 30-year fixed mortgage rate, regional median list-to-close discount, and institutional Build-to-Rent penetration. Forecasts use a multivariate regression where turnover and ASP are driven by disposable income growth, mortgage affordability indices, and housing-start pipelines, with scenario overlays for policy shifts. Gaps in builder rollups are bridged by county deed recordings and trade-association rental surveys.
Data Validation & Update Cycle
Outputs pass three-layer checks: analyst peer review, variance screens versus HUD demand forecasts and NAR sales tallies, and senior-review sign-off. The model refreshes annually, while material shocks, rate spikes, stimulus bills, and disaster declarations trigger interim revisions before report delivery.
Why Our US Residential Real Estate Baseline Commands Reliability
Published estimates often diverge because researchers choose different property scopes, price bases, or refresh cadences.
Key gap drivers include some studies that track only broker revenue, others that roll residential into a broader real estate basket, and many that rely on dated census snapshots without reconciling fast-moving mortgage and migration shifts. Mordor's baseline, anchored in full-value transaction dollars and refreshed each year against live deed and lender feeds, avoids those drifts and provides decision-makers with a steady reference point.
Benchmark comparison
| Market Size | Anonymized source | Primary gap driver |
|---|---|---|
| USD 2.64 Trillion (2025) | Mordor Intelligence | - |
| USD 0.83 Trillion (2024) | Regional Consultancy A | Covers North America aggregate; omits existing-home resale volume and applies constant 2020 ASPs |
| USD 130.02 Billion (2024) | Trade Journal B | Tracks only developer revenue across all property types, excludes rental turnover and secondary sales |
Taken together, the comparison shows that headline gaps stem mainly from scope compression and outdated price anchors. By combining live transaction data with stakeholder validation, Mordor delivers a balanced, transparent baseline that clients can replicate and challenge with confidence.


Key Questions Answered in the Report
What is the U.S. residential real estate market size in 2026 and how fast will it grow?
What is the U.S. residential real estate market size in 2026 and how fast will it grow?
Which property type leads share and growth across states like Texas, California, and Florida?
Apartments and condominiums lead by share at 81.50% in 2025 and they are also the fastest-growing property type with a 2.13% CAGR through 2031.
How are mortgage rates and affordability shaping demand in 2026?
Rates eased into late 2025 and wages outpaced home price gains, which improved payment-to-income ratios and helped pending sales strengthen into early 2026.
What segments offer the best balance of volume and growth during 2026–2031?
Mid-market resales anchor volume, while affordable-priced new-builds and professionally managed rentals in Western and select Southern metros combine higher growth with active pipelines.
What is driving new-home momentum in markets such as Texas and Florida?
Builders are using rate buydowns, closing-cost credits, and compact designs to match payments to underwriting limits, which narrowed the price gap with resales and lifted absorption.
How do insurance costs affect buyers in states like Florida and California?
Premiums increased rapidly and now add significant monthly costs, which constrain eligibility and shift some demand toward less exposed areas within the Rest of US.
Page last updated on:


