
Market Overview
| Study Period | 2020 - 2031 |
|---|---|
| Forecast Data Period | 2026 - 2031 |
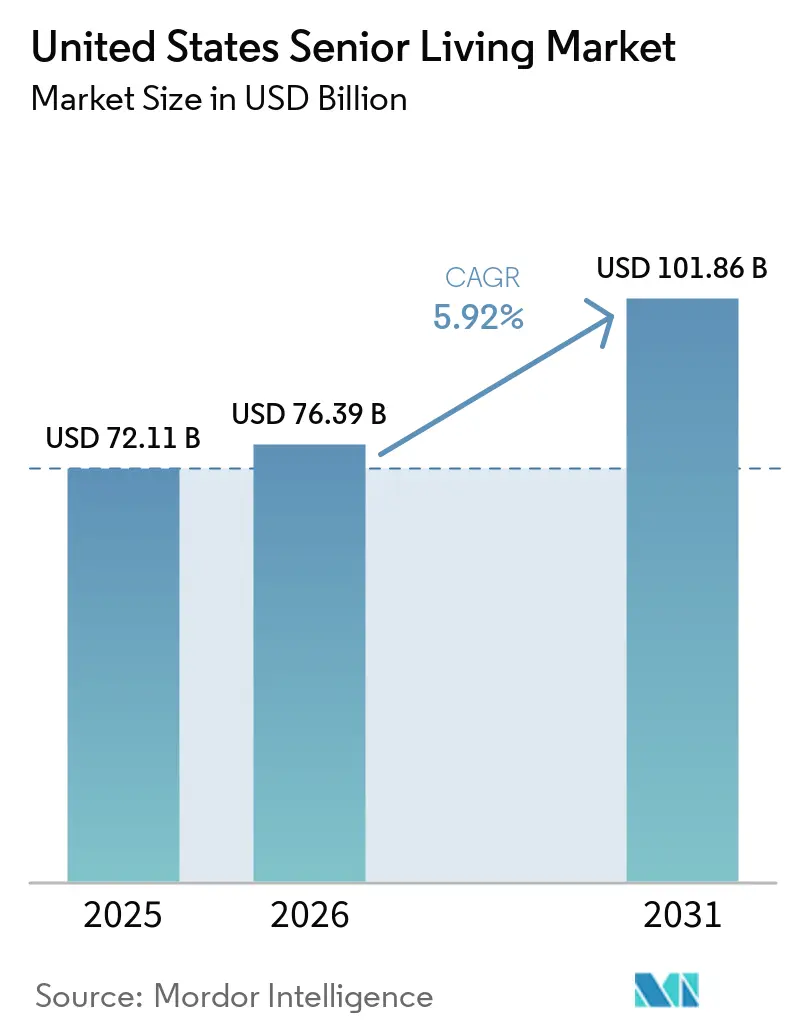
| Base Year Market Size (2025) | USD 72.11 Billion |
| Market Size (2026) | USD 76.39 Billion |
| Market Size (2031) | USD 101.86 Billion |
| Growth Rate (2026 - 2031) | 5.92 % |
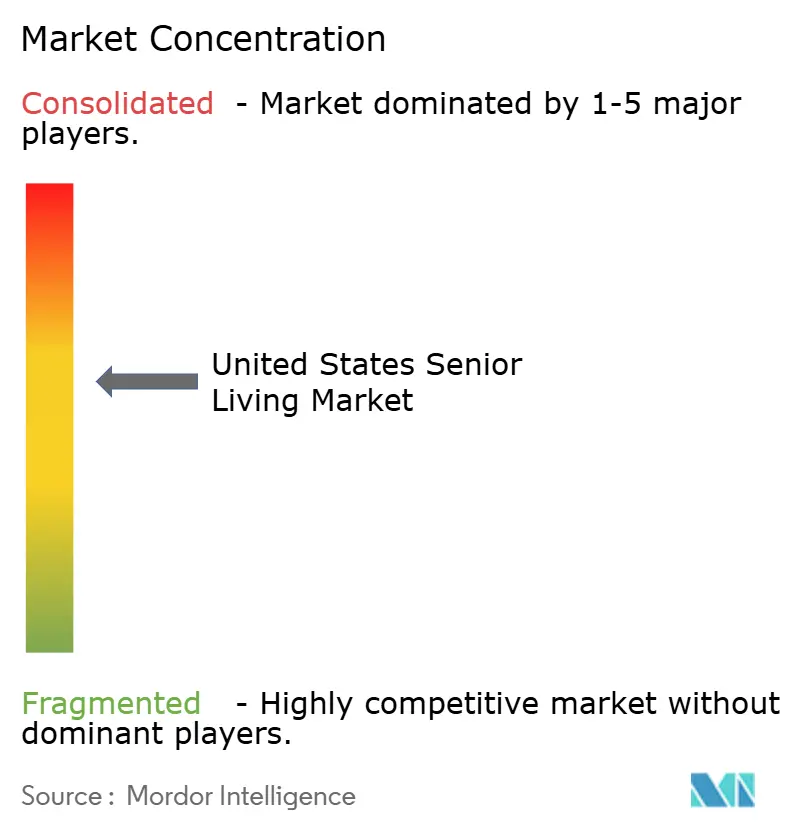
| Market Concentration | Medium |
Major Players *Disclaimer: Major Players sorted in no particular order Image © Mordor Intelligence. Reuse requires attribution under CC BY 4.0. | |
United States Senior Living Market Analysis by Mordor Intelligence
United States senior living market size in 2026 is estimated at USD 76.39 billion, growing from 2025 value of USD 72.11 billion with 2031 projections showing USD 101.86 billion, growing at 5.92% CAGR over 2026-2031. Continued demand from an aging population, constrained new‐build supply, and sophisticated capital inflows combine to create pricing power for operators while supporting steady occupancy gains. Healthcare integration deepens competitive moats because communities that embed primary care and rehabilitation services capture higher margins, lift length of stay, and reduce hospital transfers. Rental pricing flexibility lets operators respond quickly to wage inflation and regulatory costs, helping to maintain operating margins despite labor pressures. Institutional investors, especially healthcare REITs, sustain development pipelines through joint ventures and sale-leasebacks, fueling consolidation even as interest rates remain elevated. Technology adoption, from electronic health records to predictive analytics, further enhances resident outcomes and cost efficiency.
Key Report Takeaways
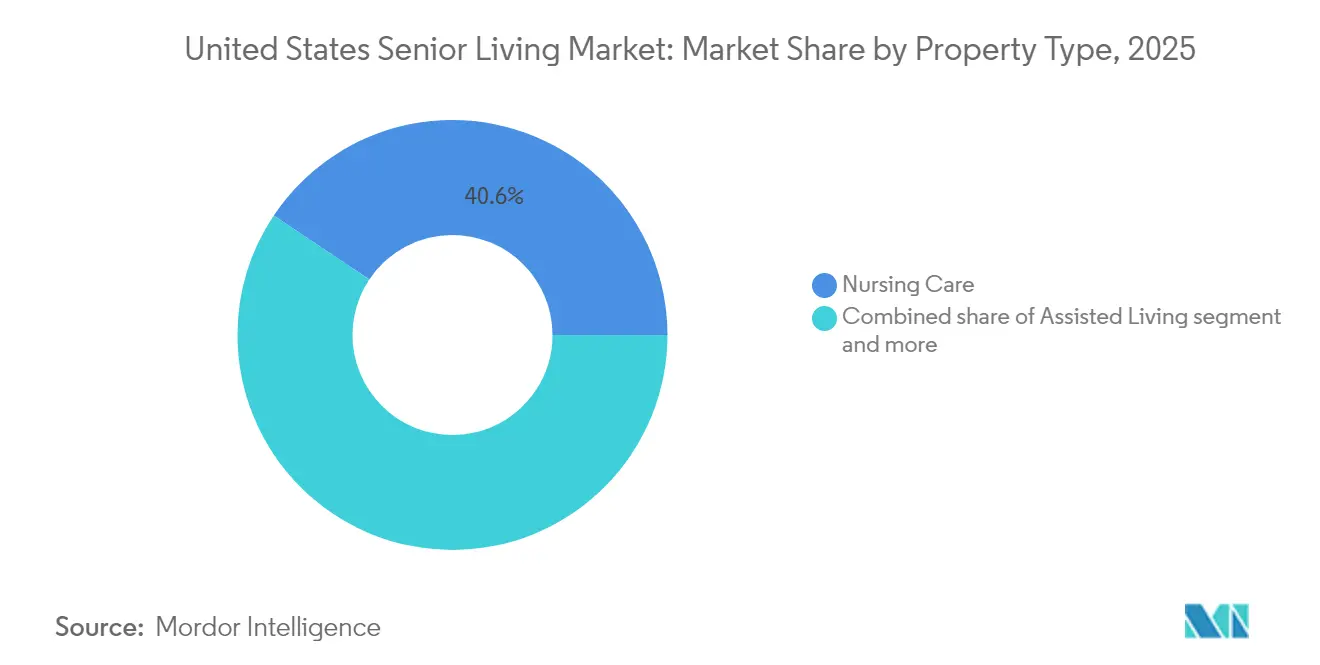
- By property type, nursing care captured 40.62% of the United States senior living market share in 2025 and leads growth with a 6.29% CAGR through 2031.
- By business model, the Long-Lease / Rental format held 81.65% of the United States senior living market share in 2025, while the Hybrid (Sale + Lease) model records the highest projected CAGR at 6.45% to 2031.
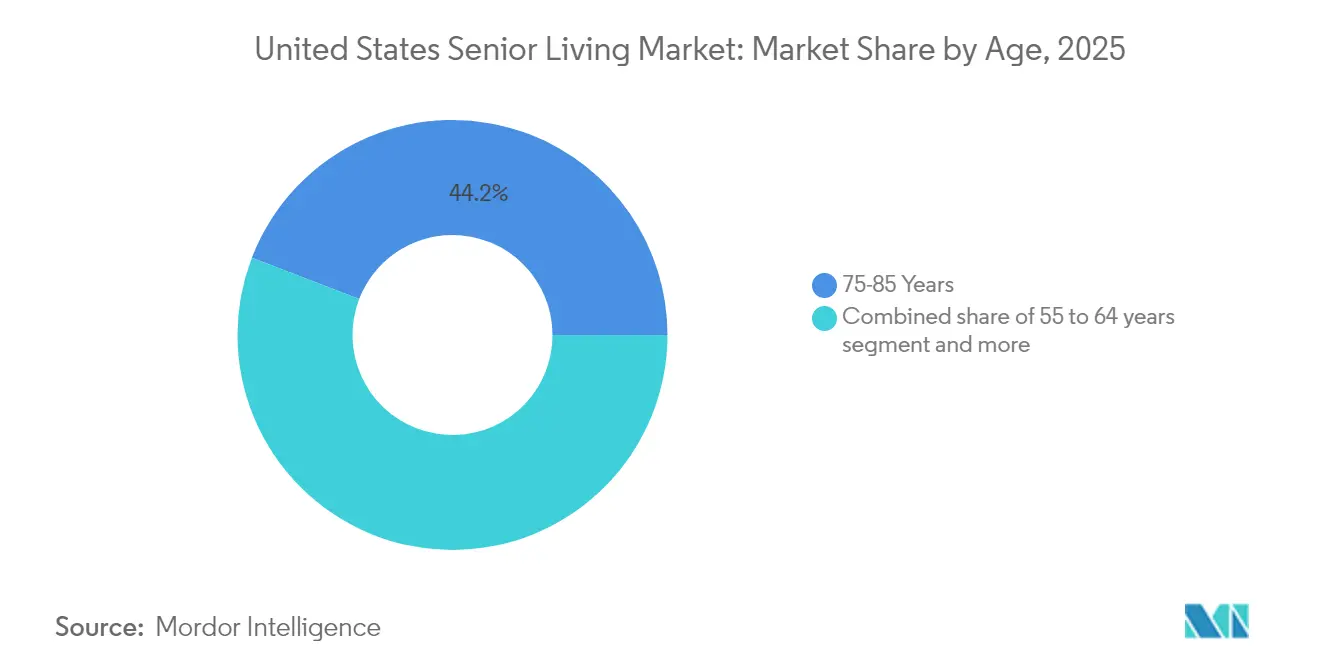
- By age, residents aged 75-85 accounted for 44.15% of demand in 2025; residents above 85 are projected to expand at a 6.63% CAGR through 2031.
- By geography, California led with a 12.05% revenue share in 2025, whereas Texas is advancing at a 6.88% CAGR to 2031.
Note: Market size and forecast figures in this report are generated using Mordor Intelligence’s proprietary estimation framework, updated with the latest available data and insights as of 2026.
United States Senior Living Market Trends and Insights
Drivers Impact Analysis*
| Drivers | ( ~ ) % Impact on CAGR Forecast | Geographic Relevance | Impact Timeline |
|---|---|---|---|
| Aging baby-boomer cohort driving sustained demand across independent, assisted, and memory care | +2.1% | National; high density in California, Florida, Texas | Long term (≥ 4 years) |
| Deep capital markets and active healthcare REITs supporting development and consolidation | +1.4% | National, primary metropolitan areas | Medium term (2-4 years) |
| Shift to healthcare-integrated models, enhancing the value proposition | +1.2% | National; early adoption in California, the Northeast | Medium term (2-4 years) |
| Home-sale equity and retirement savings enabling private-pay affordability | +0.9% | High-income metros: California, Northeast | Short term (≤ 2 years) |
| Technology adoption elevates care quality and efficiency | +0.4% | National; faster in urban markets | Long term (≥ 4 years) |
| Source: Mordor Intelligence | |||


Aging Baby-Boomer Cohort Driving Sustained Demand Across Care Levels
Nearly all 69 million baby boomers will be 70 or older by 2033, dramatically enlarging the resident pool for the United States senior living market. Higher home ownership and net worth among this cohort underpin private-pay affordability, while broader acceptance of technology raises comfort with digitally enabled care. The 85-plus population, most likely to require skilled nursing and memory care, is set to double by 2040, guaranteeing demand for high-acuity services. States attracting retirees through favorable taxes and climate, such as Texas and Florida, will see especially strong growth. Operators that tailor amenities, payment plans, and marketing to this wealthier, tech-savvy generation are positioned to capture lifetime value. Green Street estimates show more than 40% of seniors can pay for senior housing without liquidating assets, indicating significant latent demand.
Deep Capital Markets and Active Healthcare REITs Supporting Development and Consolidation
Healthcare REITs are pouring record funds into United States senior living market assets. Ventas lifted its 2025 investment target to USD 1.5 billion after deploying USD 2 billion in 2024, signaling long-term conviction in sector fundamentals. Welltower’s USD 3.2 billion acquisition of Amica Senior Lifestyles illustrates the scale REITs will transact to secure premier portfolios. Debt capital remains abundant, with Walker & Dunlop arranging USD 600 million in seniors-housing loans during 2024. Private equity heavyweights such as Fortress add further competition for assets, driving valuations and spurring operational upgrades. Strong liquidity supports new builds in undersupplied metros and offers exit paths for regional owner-operators, accelerating consolidation and professionalization across the ecosystem[1]Roberta Katz, “2025 Investor Presentation,” Ventas Inc., ventasreit.com.
Shift to Healthcare-Integrated Models Enhancing Value Proposition and Resident Outcomes
Operators now embed primary care, chronic disease programs, and rehabilitation services directly inside communities, recasting senior living as a healthcare platform. Brookdale’s HealthPlus residents experienced 78% fewer urgent-care visits and 36% fewer hospitalizations compared with peers in traditional communities. Integration widens revenue streams via Medicare Advantage partnerships and ancillary billing while boosting resident loyalty. Specialized memory-care wings, on-site labs, and therapy gyms create one-stop solutions that alleviate family burden and justify premium pricing. Electronic health records and telehealth link on-site clinicians with external providers, ensuring seamless care coordination. Regulatory support is growing as payers reward demonstrable outcome improvements.
Home-Sale Equity and Retirement Savings Enabling Private-Pay Affordability
Home price appreciation over the past decade has given many seniors sizable equity cushions that can be tapped through sales or reverse mortgages to fund entry fees or monthly rents. High savings rates among white-collar retirees further buttress affordability, especially in coastal and high-income metros. Financial advisors increasingly recommend senior living communities as cost-effective alternatives to prolonged in-home care, encouraging earlier move-ins. Operators respond with bridge-financing programs and refundable entrance fees to lower perceived barriers. While macroeconomic volatility can delay home sales, longer trend lines point to a steady supply of qualified residents for the United States senior living market.
Restraints Impact Analysis*
| Restraints | ( ~ ) % Impact on CAGR Forecast | Geographic Relevance | Impact Timeline |
|---|---|---|---|
| Labor shortages and wage inflation are pressuring margins and service levels | −1.8% | National; acute in rural and secondary markets | Short term (≤ 2 years) |
| State-by-state regulatory complexity is increasing compliance costs and timelines | −0.7% | National; highest in California, New York, Illinois | Medium term (2-4 years) |
| Affordability gaps and uneven occupancy recovery in certain secondary markets | −0.5% | Secondary and rural markets; Midwest | Medium term (2-4 years) |
| Source: Mordor Intelligence | |||
Labor Shortages and Wage Inflation Pressuring Margins and Service Levels
Severe staffing shortages plague virtually every care level, forcing communities to raise hourly wages, expand benefits, and rely heavily on agency labor. New CMS nursing-home staffing rules requiring 3.48 nursing hours per resident per day ripple into assisted and independent living through competition for licensed nurses. Only 6% of nursing homes currently meet the 24/7 RN mandate, driving cross-sector bidding wars that compress margins. Caregiver wage campaigns, such as Nevada’s push from USD 16 to USD 20 per hour, spotlight inflationary pressures. The FTC’s pending ban on non-compete clauses may further elevate turnover, undermining continuity of care. Operators in rural areas confront the steepest hurdles, sometimes restricting admissions to maintain mandated staff-resident ratios[2]Chiquita Brooks-LaSure, “Minimum Staffing Standards for Long-Term Care Facilities and Medicaid Institutional Payment Transparency Reporting,” Centers for Medicare & Medicaid Services, cms.gov.
State-by-State Regulatory Complexity Increasing Compliance Costs and Development Timelines
The absence of uniform federal oversight means each state sets its own licensing, inspection, and reporting rules. Fifteen states updated assisted-living statutes between July 2023 and July 2024, with 88% now imposing infection-control mandates. California’s multi-agency approval process for Residential Care Facilities for the Elderly demands financial, architectural, and care-model reviews, stretching timelines and consultancy fees. New CMS surveyor guidance, effective March 2025, layers additional federal documentation on admission assessments and chemical-restraint policies. Multi-state operators must maintain disparate policy handbooks, duplicative training, and localized audit teams, diluting scale efficiencies[3]Karen Hoffman, “State Infection Control Requirements in Assisted Living, 2024 Update,” National Center for Assisted Living, ncal.org..
*Our forecasts treat driver/restraint impacts as directional, not additive. The impact forecasts reflect baseline growth, mix effects, and variable interactions.
Segment Analysis
By Property Type: Nursing Care Demand Mirrors Rising Acuity Needs
Nursing care facilities controlled 40.62% of the United States senior living market size in 2025 and will post the quickest 6.29% CAGR through 2031. Demand stems from residents with multiple chronic conditions who prefer aging in place within a continuum-of-care setting instead of hospital transfers. Assisted-living remains the mainstream entry point, yet operators retrofit wings for memory-care or sub-acute services to retain residents and capture value. Independent-living communities focus on lifestyle amenities, fitness centers, chef-led dining, and cultural programs, geared toward younger seniors who prize autonomy. The maturation of memory-care units, complete with secured layouts and dementia-trained staff, illustrates the sector’s pivot to higher acuity while preserving residential ambience. Continuing-care retirement communities, though niche, gain traction among affluent seniors desiring contractual access to multiple care levels.
Nursing-care dominance compels capital investment in clinical staff training, negative-pressure rooms, and on-site therapy suites. Operators deploy electronic medication-administration records and smart lifts to boost safety and efficiency. Rising acuity also attracts insurer partnerships seeking reduced readmissions, adding payer-driven revenue to the United States senior living market. However, regulatory scrutiny on staffing ratios, infection control, and reimbursement adequacy remains intense, requiring sophisticated compliance infrastructures.


By Business Model: Rental Flexibility Outweighs Upfront Cost of Ownership Alternatives
Long-lease and rental communities accounted for 81.65% of the U.S. senior living market, driven by consumer preference for flexible month-to-month agreements and low upfront costs. Operators benefit from predictable cash flow and the ability to swiftly adjust pricing to offset labor or utility cost inflation. Marketing efforts emphasize liquidity, appealing to seniors seeking to avoid capital lock-in through entry fees. In contrast, hybrid models, primarily Continuing Care Retirement Communities (CCRCs), are forecasted to grow at a 6.45% CAGR. These models attract high-net-worth households by offering real estate appreciation and contractual care guarantees. Entrance fees, typically ranging from USD 200,000 to 1 million, provide funding for expansions and refurbishments without leveraging debt, thereby enhancing community standards and resale values.
Emerging hybrid contracts offer partial refunds on entrance fees or equity interests, combining the benefits of ownership with rental flexibility. Securitization of entrance-fee receivables enables operators to access cost-effective financing, accelerating the development of resort-style communities in key metropolitan markets. Rental communities are adopting à-la-carte care packages and subscription-based wellness programs to emulate the lifetime-care assurances of CCRCs, but without significant upfront costs. This approach facilitates broader market penetration within the U.S. senior living sector.
By Age: Above-85 Residents Propel High-Margin Services
Residents aged 75-85 supplied 44.15% of 2025 occupancy, yet the above-85 cohort will climb at a 6.63% CAGR and account for a growing share of premium-priced units. Communities design universal-access apartments with wider doorways, zero-threshold showers, and voice-activated controls to accommodate frailty without sacrificing aesthetics. Higher-age residents generate elevated per-capita revenue due to greater care intensity, spurring investment in 24/7 nursing stations, memory-care curricula, and hospice partnerships. Early retirees aged 55-64, meanwhile, gravitate toward active-adult rental enclaves with pickleball courts and co-working lounges, viewing the move as a lifestyle upgrade rather than a health need.
Programming across age bands becomes increasingly personalized. Cognitive-fitness classes, tele-rehab sessions, and chef-guided nutrition coaching address preventive health for younger cohorts, whereas fall-prevention technologies and chronic-disease clinics target the oldest residents. The United States senior living market thus segments not just by age but by wellness goals, enabling operators to diversify revenue streams and lengthen resident tenure.
Geography Analysis
California commanded 12.05% of United States senior living market revenue in 2025, underpinned by high household wealth, robust home equity, and stringent licensure that limits new entrants. Operators capitalize on dense healthcare networks and thriving technology ecosystems to pilot telehealth platforms, electronic health records, and green-building retrofits that resonate with environmentally conscious residents. Elevated land and labor costs lift monthly fees, yet affluent clientele sustain occupancy and fund premium amenities. California’s wildfire and seismic risk necessitate resilient construction and emergency preparedness investments, which further raise barriers for smaller competitors.
Texas delivers the fastest 6.88% CAGR through 2031, buoyed by pro-business regulations, modest land prices, and significant retiree in-migration. Streamlined licensing allows quicker groundbreakings, and diversified metro economies in Dallas, Austin, and Houston support both middle-income and luxury projects. Labor supply is deeper, and wage levels are comparatively moderate, improving operating margins. The Ensign Group’s multi-property acquisitions highlight confidence in Texas as a springboard for the United States senior living market expansion.
Florida, New York, and Illinois represent mature yet opportunity-rich states. Florida communities confront hurricane risk and insurance cost spikes, prompting investments in hardened infrastructure and microgrid energy systems. New York grapples with high labor costs and unionization pressures but benefits from dense wealth pockets and sophisticated healthcare partnerships. Illinois sees regulatory scrutiny over staffing and refund-timing for CCRCs, but maintains steady demand in Chicago’s affluent suburbs. Emerging growth states such as North Carolina, Arizona, and Colorado draw developers thanks to favorable tax climates and healthcare system growth, evening out geographic risk for national platforms. Consolidation in secondary markets accelerates as regional chains merge to access capital and technology scale.
Regulatory Landscape
Regulation in the United States senior living market is split between federal oversight for skilled nursing facilities (SNFs) and state licensing for assisted living. SNFs are governed by federal Centers for Medicare & Medicaid Services (CMS) Conditions of Participation tied to Medicare and Medicaid certification, while assisted living is primarily overseen through state licensing and inspection regimes. In December 2025, CMS repealed the minimum staffing requirements for skilled nursing and long-term care facilities after Public Law 119-21 placed a moratorium on those staffing requirements through September 30, 2034. In practice, this pushed near-term compliance back toward existing survey enforcement and state-specific staffing rules rather than introducing a single new federal staffing floor.
Payment and financing programs also affect operator behavior and asset viability. For FY 2026, CMS finalized a 3.2% update to SNF Prospective Payment System rates, influencing revenue capacity for nursing care operators participating in Medicare. On the capital side, HUDs Office of Residential Care Facilities (ORCF) administers the FHA Section 232 mortgage insurance program for nursing homes and assisted living, with continued borrower compliance to ORCF regulatory agreements and reporting obligations remaining central for deals using this channel.
Value Chain Analysis
The United States senior living value chain runs from land acquisition and entitlement, to development and construction, capital formation (healthcare REITs, private equity, banks, and government-backed channels such as HUD Section 232), lease-up and marketing, and then day-to-day operations and clinical service delivery. Resident care coordination with external providers and payers sits on top of these activities. Operators and owners depend on a layered vendor ecosystem covering staffing and training, food service, building maintenance, medical supplies and equipment, health IT (EHRs, nurse call, resident engagement), and third-party therapy and primary care partners in healthcare-integrated communities.
The main constraints show up upstream in development and construction, where limited starts and long build cycles restrict new supply and shift activity toward acquisitions and renovation. Evidence cited in the report points to construction labor scarcity (with the broader construction industry needing to attract 499,000 new workers in 2026) and prolonged timelines (around 29 months in 2025), alongside cost inflation from materials and labor. With more than half of existing senior living inventory older than 25 years, a large share of value creation also moves through recapitalization and refurbishment projects, while policy and financing pathways influence supply cadence through advocacy such as ASHAs December 2025 support for the Housing for the 21st Century Act.
Competitive Landscape
The United States senior living market remains moderately fragmented, with the top five operators controlling just under one-third of total units, while hundreds of local firms serve niche geographies. Brookdale, Atria, and Sunrise leverage national brands, purchasing clout, and data analytics to optimize pricing and staffing across portfolios. Healthcare REIT partners such as Ventas and Welltower furnish acquisition capital and performance-based lease structures that incentivize operational excellence. Private equity sponsors buy underperforming communities, inject technology upgrades, and deploy centralized revenue-management systems to fast-track value creation.
Competitive advantage coalesces around healthcare integration. Operators offering on-site primary care, therapy services, and advanced memory-care programs win referrals from hospital systems eager to reduce readmissions. Technology is another battleground. Electronic health records, predictive staffing algorithms, and resident engagement apps differentiate larger platforms and appeal to adult-child decision makers. Smaller operators respond by joining purchasing alliances and outsourcing IT functions to achieve cost parity.
Regulatory compliance capacity influences market share as CMS staffing mandates tighten and states heighten infection-control audits. Companies with robust clinical governance teams and real-time reporting dashboards mitigate citation risk and sustain five-star quality ratings, which directly correlate with occupancy. Capital access rounds out the landscape story: organizations with REIT or private-equity partners can execute multi-property portfolios, whereas stand-alone operators may become acquisition targets to secure succession planning or relieve debt burdens.
United States Senior Living Industry Leaders
Brookdale Senior Living Inc.
Atria Senior Living Inc.
LCS (Life Care Services)
Erickson Senior Living
Sunrise Senior Living
- *Disclaimer: Major Players sorted in no particular order

Market Opportunities and Future Outlook
Supply constraints and aging physical stock create whitespace for operators and capital partners that can add units through expansion, repositioning, and acquisitions rather than relying on ground-up development. Evidence from NIC indicates that as of Q2 2026, occupancy in primary markets neared 90%, inventory growth remained limited (0.4%), and the under-construction pipeline stayed below 16,000 total units. This environment supports opportunity in targeted expansions and in renovating older communities (with over 50% of inventory older than 25 years) to align with higher-acuity demand and updated amenity expectations. Rising development costs, cited in the evidence at about USD 388,830 per revenue unit (USD 364 per sq. ft.) from Q3 2023 to Q2 2026, further improves the relative appeal of buying and upgrading existing assets.
Operational differentiation continues to center on healthcare integration and technology-enabled efficiency. In 2026, senior housing leaders ranked risk monitoring and predictive wellness insights as top technology priorities, alongside CRM and safety and wellness reporting tools, while smartphone ownership among adults 50+ reached 90% in 2025, broadening the addressable base for digital engagement and remote monitoring workflows. On the compliance side, CMSs national Risk-Based Survey approach for nursing homes begins September 8, 2026, and NCAL reported 18 states updated assisted living regulations in 2025. Together, these points support multi-state platforms built around standardized training, documentation, and quality systems that can scale across portfolios.
Recent Industry Developments
- July 2026: Brookdale Senior Living completed the acquisition of the 244-unit Brookdale Galleria community in Houston, Texas, for USD 23.4 million, converting a previously managed property into owned real estate. The move increases Brookdales owned-asset base and can strengthen unit economics through tighter control over capital planning and operating decisions in a high-growth state.
- March 2026: Atria Senior Living acquired and assumed management of two assisted living communities on Long Island in partnership with Fundamental Advisors and Scribner Capital LLC, rebranding them as Atria Levittown and Atria Patchogue. The transaction extends Atrias footprint in the New York metro area and reflects continued use of capital partnerships to scale in regulated, high-barrier submarkets.
- March 2025: Welltower disclosed an agreement to acquire Amica Senior Lifestyles for about USD 3.2 billion, adding 47 properties and development sites to its senior housing portfolio. The deal highlights how healthcare REIT balance sheets are being used to consolidate premium senior living assets and shape operating platforms through portfolio scale.


Research Methodology Framework and Report Scope
Market Definition and Coverage
For this methodology, the United States senior living market covers paid residential communities and facilities that provide housing and day to day support for older adults, along with care levels where applicable, and the related service revenue captured at the facility level.
Scope exclusions: We do not count informal family care, non residential home health visits delivered to private homes, or general hospital acute care revenue.
Segmentation Overview
- By Property Type
- Assisted Living
- Independent Living
- Memory Care
- Nursing Care
- By Business Model
- Outright Sale (Freehold)
- Long-Lease / Rental
- Hybrid (Sale + Lease)
- By Age
- 55 to 64 years
- 65 to 74 years
- 75 to 85 years
- Above 85 years
- By States
- Texas
- California
- Florida
- New York
- Illinois
- Rest of US
Data Sources, Market Sizing, and Validation
Desk Research
Desk work started with public sources that help explain the demand pool and the supply base for senior living. We referred to sources such as the U.S. Census Bureau for older age population trends, the CDC for health and aging indicators, and CMS for nursing and long term care reference statistics. We also used state health and licensing portals (where available) to understand facility definitions and bed or unit supply, which helps keep scope consistent.
To connect demand signals with dollars, we reviewed public filings and investor decks of listed operators and real estate owners, along with reputable press and association releases such as AHCA/NCAL. We also used paid subscriptions for company financials and news intelligence, and a patent database to scan technology adoption themes that can shift staffing and operating cost assumptions. The specific sources named here are illustrative only, and many other public datasets and documents were used to collect, cross check, and clarify inputs.
Primary Interviews and Surveys
Primary calls and surveys were used to confirm what is actually billed and recognized as senior living revenue, and how pricing changes are applied across care levels and geographies. We spoke with operators, facility administrators, real estate and development stakeholders, and care leaders who influence rates, occupancy plans, and service mix across major US regions. When desk data left gaps, those gaps were closed by structured questions on occupancy normalization, monthly rate ranges, staffing driven cost pass through, and the pace of new supply additions.
Distribution of primary research fieldwork respondents
| Company type | Respondent position |
|---|---|
| Top tier: 37% | CXOs: 21% |
| Mid tier: 42% | Functional/Unit leaders: 24% |
| Smaller Players: 21% | Managers: 55% |
Market-Sizing & Forecasting
Sizing used a mix of top down and bottom up checks, with the main build coming from a demand pool view that ties seniors by age band to the share likely to live in senior living, and then converts that into occupied units and revenue. To make the dollars realistic, we modeled occupancy rates, unit or bed stock, and average monthly rates by care level, and then adjusted for payer mix and the typical add on services that are billed within facilities.
The model inputs were guided by practical market fingerprints, including move in and move out patterns, construction pipeline timing, staffing availability impacts on usable capacity, and rate reset behavior (annual increases and mid year adjustments). For forecasting, we used scenario analysis supported by simple time series smoothing on occupancy and rate growth, and then pressure tested those paths with primary feedback on how quickly discounts roll off and how demand changes with local affordability. Where facility counts or inventory were not visible in public sources for specific states, we filled gaps using sampled operator footprints and state level licensing ranges, and then rebalanced totals so the national picture stays consistent.
Data Validation & Update Cycle
Outputs were checked against independent signals such as senior population growth, publicly discussed occupancy direction, and reported pricing change ranges, and then mismatches were investigated before sign off. We also ran variance checks across states and care levels so one segment does not grow in a way that contradicts supply, staffing, or demographic reality.
A second analyst review was applied to key assumptions like occupancy normalization and rate growth, and follow up outreach was triggered when an assumption moved outside the range heard in interviews. Reports are refreshed annually, and we also do interim updates when material events show up, such as major policy changes or sharp shifts in occupancy or labor conditions. Before delivery, a final pass is completed so the dataset reflects the latest available year end and quarterly information.
Mordor Intelligence's United States Senior Living Market Size Compared Against Other Published Estimates
It is common to see different market sizes for senior living because publishers do not always count the same care settings, and they may apply different pricing and occupancy logic. Timing choices also matter because a market measured on a calendar year basis can look different from one aligned to a fiscal cut, especially when rates are being reset and occupancy is still normalizing.
The spread is usually driven by a few practical items, including whether nursing care is fully included, whether only private pay revenue is counted, and how average monthly rates are converted into annual revenue for each care level. Refresh cadence can also move results because a model updated after major rent increases or after a change in reported occupancy will land higher even if the underlying demand pool did not change much. By locking annual rate resets to the most recent observable pricing and validating occupancy assumptions before currency timing is finalized, the estimate used by Mordor Intelligence reduces drift that can happen when older price points are carried forward too long.
Benchmark comparison
| Source | Market Size | Gaps in Research Methodology |
|---|---|---|
| Mordor Intelligence | USD 72.11 B (2025) | |
| Industry Digest A | USD 97.85 B (2024) | Uses a different base year and appears to include a broader set of state level senior living revenue, which can pull in additional facility and care revenue beyond a like for like 2025 pricing and occupancy point. |
| Policy and Trends Brief B | USD 119.55 B (2025) | Headline value is presented without a clear tie back to occupied units and monthly rates by care level, so the estimate may fold in adjacent long term care or broader service revenue and apply faster ASP progression. |
Across the three figures, the main takeaway is that timing and what is counted as senior living revenue explain most of the gap. When rate growth, occupancy normalization, and included care settings are defined in a repeatable way, the market total becomes easier to reconcile with real facility economics and state level supply signals.


Key Questions Answered in the Report
What is the current value of the United States senior living market?
The market is valued at USD 76.39 billion in 2026 and is projected to reach USD 101.86 billion by 2031.
Which property type leads revenue in senior living communities?
Nursing care facilities account for 40.62% of 2025 revenue and will post the fastest 6.29% CAGR through 2031.
Why are healthcare REITs investing heavily in senior housing?
REITs view integrated care models and growing demand as durable income streams, prompting multibillion-dollar acquisitions and development pipelines.
How does Texas compare to California in market growth?
California holds the largest share at 12.05%, whereas Texas is the fastest-growing state with a 6.88% CAGR to 2031.
Page last updated on:


 Your data is secure and never sold or shared.


