Market Overview
| Study Period | 2020 - 2031 |
|---|---|
| Forecast Data Period | 2026 - 2031 |
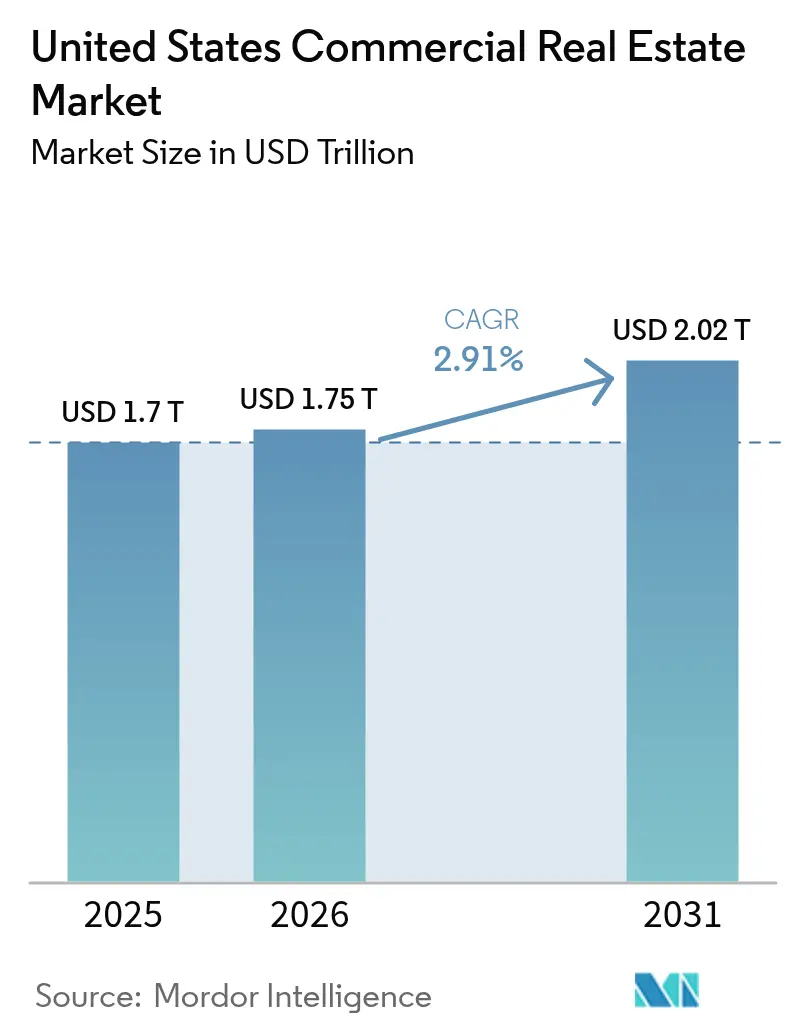
| Base Year Market Size (2025) | USD 1.7 Trillion |
| Market Size (2026) | USD 1.75 Trillion |
| Market Size (2031) | USD 2.02 Trillion |
| Growth Rate (2026 - 2031) | 2.91% CAGR |
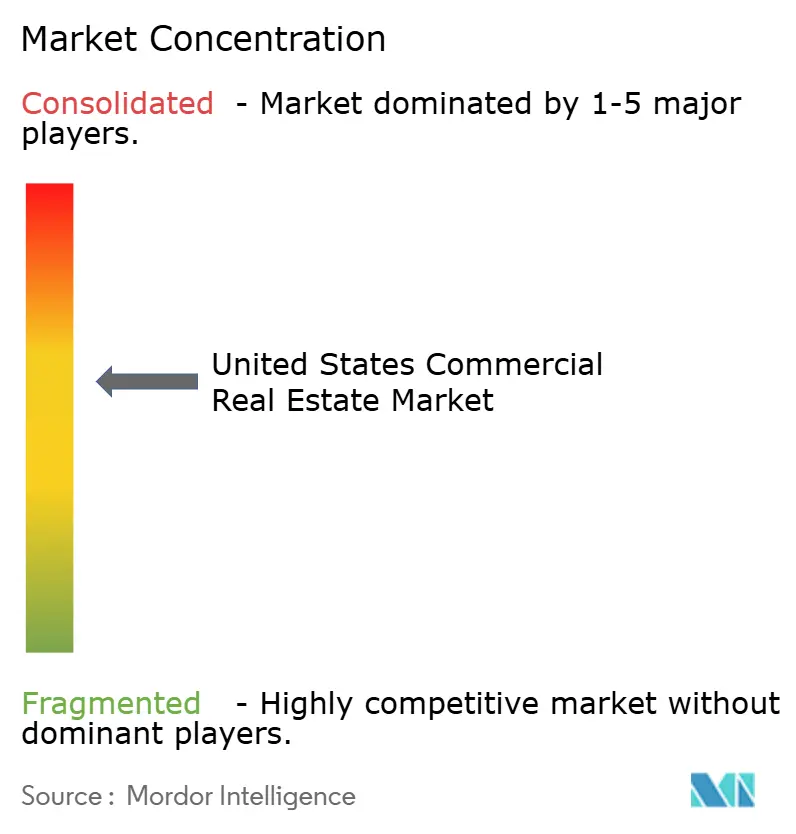
| Market Concentration | Medium |
Major Players *Disclaimer: Major Players sorted in no particular order Image © Mordor Intelligence. Reuse requires attribution under CC BY 4.0. | |
United States Commercial Real Estate Market Analysis by Mordor Intelligence
The United States Commercial Real Estate Market size is expected to increase from USD 1.7 trillion in 2025 to USD 1.75 trillion in 2026 and reach USD 2.02 trillion by 2031, growing at a CAGR of 2.91% over 2026-2031.
Institutional investors continued to favor income-producing assets, even as the Federal Reserve’s restrictive policy environment kept average commercial-mortgage rates above 6%. Logistics facilities outperformed offices thanks to e-commerce penetration surpassing 16% of total U.S. retail sales, while Sunbelt migration supported multifamily absorption. Compliance costs linked to SEC climate-disclosure rules climbed to as much as USD 2 million per public filer, driving landlords to adopt energy-management PropTech that lowers operating expenses by up to 20%. Brokerage firms accelerated technology spending to defend market share against digital platforms that shorten leasing cycles and compress bid-ask spreads.
Key Report Takeaways
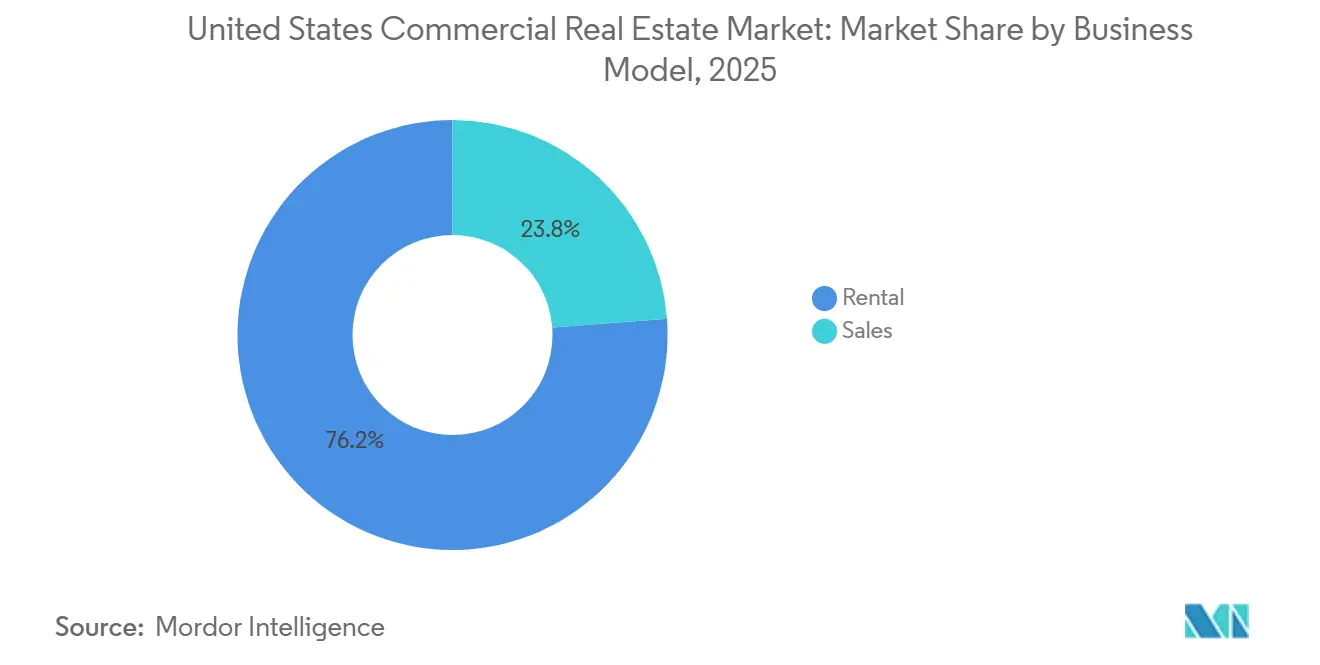
- By business model, rentals led with 76.2% of 2025 revenue, while the sales segment is projected to log the fastest 3.19% CAGR through 2031.
- By property type, offices commanded the largest 29.1% share in 2025, yet logistics assets are set for the highest 3.44% CAGR over 2026-2031.
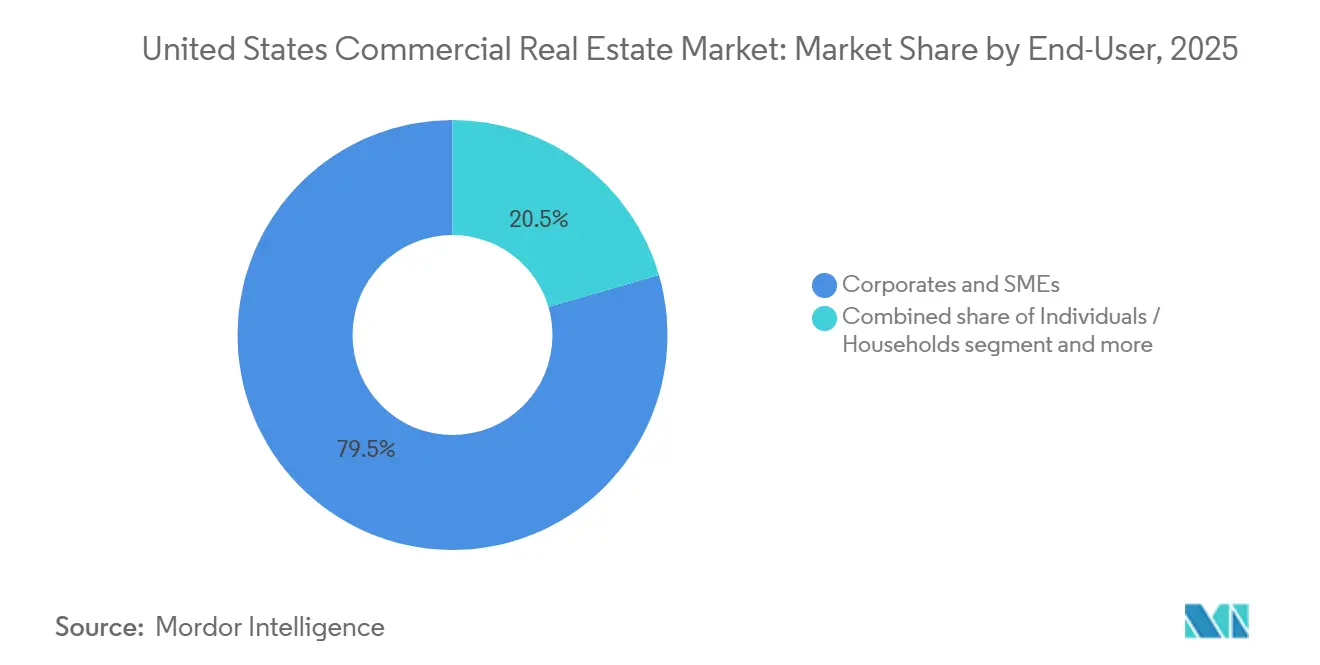
- By end user, corporates and SMEs held 79.5% of 2025 demand, whereas individuals and households are forecast to expand at a 3.25% CAGR to 2031.
- By state, California captured a 21.1% share in 2025, but the Rest of US cohort is expected to outpace all regions with a 3.61% CAGR during the outlook period.
Note: Market size and forecast figures in this report are generated using Mordor Intelligence’s proprietary estimation framework, updated with the latest available data and insights as of 2026.
United States Commercial Real Estate Market Trends and Insights
Drivers Impact Analysis*
| Drivers | (~) % IMPACT ON CAGR FORECAST | Geographic Relevance | Impact Timeline |
|---|---|---|---|
| Strong demand for industrial and logistics space driven by e-commerce and supply-chain needs | +1.1% | Texas, California Inland Empire, New Jersey, Georgia | Long term (≥ 4 years) |
| Increased investor interest in multifamily and mixed-use properties expanding capital markets activity | +0.7% | Florida, Texas, Arizona, urban infill | Medium term (2–4 years) |
| Recovery in office and retail leasing boosting demand for brokerage and leasing services | +0.6% | New York, San Francisco, Chicago | Medium term (2–4 years) |
| Adoption of PropTech and data analytics enhancing market transparency and transaction efficiency | +0.5% | San Francisco, New York, Austin, Seattle | Short term (≤ 2 years) |
| Growing need for professional property and asset management services | +0.4% | National, large institutional portfolios | Long term (≥ 4 years) |
| Source: Mordor Intelligence | |||
Strong Demand for Industrial and Logistics Space Driven by E-Commerce and Supply-Chain Needs
E-commerce exceeded 16.3% of United States retail sales in 2025, pushing tenants to secure 250 million square feet of new warehouse capacity. Prologis posted 7.2% same-store rent growth and maintained a 50 million square-foot development pipeline in last-mile markets [1]Industrial Rent Index 2025,” Prologis, prologis.com. Nearshoring added 475,000 residents to Texas in 2025, fueling record industrial absorption in Dallas-Fort Worth. Cold-storage rents ran 30-40% higher than conventional warehouses, yet supply remained scarce due to complex build-outs. Industrial REITs delivered a 17% total return in 2025, the second-best performing subsector after health-care assets.
Increased Investor Interest in Multifamily and Mixed-Use Properties Expanding Capital Markets Activity
Multifamily transaction volume jumped 28% year over year to USD 185 billion in 2025. Sunbelt rent growth of 5-7% attracted pension funds seeking inflation-protected yields. Mixed-use projects earned premium valuations as cities promoted transit-oriented developments via tax-increment financing. Brokerages saw a 35% rise in equity-placement mandates for multifamily refinancings at stabilized 5.0-5.5% cap rates. Institutional buyers acquired 18% of single-family homes in targeted metros, integrating them with multifamily portfolios for financing scale.
Recovery in Office and Retail Leasing Boosting Demand for Brokerage and Leasing Services
Leasing velocity rebounded, with Manhattan alone closing 8.4 million square feet in Q2 2025, the best quarter since 2019. Tenant confidence is returning, but demand is concentrating in high-quality buildings, leaving Class B and C vacancies above 25%. Experiential retailers filled former apparel boxes, turning retail net absorption positive in lifestyle centers. Brokerages expanded tenant-representation teams and rolled out lease-administration software that commands recurring fees, improving revenue visibility. Longer average lease terms of 8.5 years enhance lifetime client value for advisory firms.
Adoption of PropTech and data analytics enhancing market transparency and transaction efficiency
U.S. PropTech funding reached USD 8.2 billion in 2025, led by landlord-facing lease analytics and tenant-engagement platforms. VTS managed 15 billion square feet globally, offering predictive renewal models 18 months in advance. HQO’s platform covered 400 million square feet, turning amenity usage data into capex priorities. Crexi closed USD 12 billion in sales, trimming bid-ask spreads by 150 basis points via transparent pricing. Digital-twin pilots cut utility costs 12% for early adopters, and BIM use on new builds topped 65% in 2025.
Restraint Impact Analysis*
| Restraints | (~) % IMPACT ON CAGR FORECAST | Geographic Relevance | Impact Timeline |
|---|---|---|---|
| Rising Interest Rates and Higher Borrowing Costs Slowing Deal Volumes | -0.8% | National, acute in high-leverage metros | Short term (≤ 2 years) |
| Office Sector Headwinds from Hybrid Work Reducing Occupancy and Valuations | -0.5% | San Francisco, New York, Chicago, secondary CBDs | Medium term (2-4 years) |
| Regulatory Compliance and ESG Requirements Increasing Operating Complexity and Costs | -0.3% | National, most acute for public REITs | Long term (≥ 4 years) |
| Source: Mordor Intelligence | |||
Rising Interest Rates and Higher Borrowing Costs Slowing Deal Volumes
Commercial-mortgage coupons averaged 6.4% in 2025, still 300 basis points above 2019, depressing leveraged returns[2]“Commercial Mortgage Rate Survey 2025,” Mortgage Bankers Association, mba.org. Deal flow stayed 35% below prior peaks as bid-ask spreads widened to 20% on office trades. Floating-rate debt covering 40% of outstanding balances faced repricing shocks that triggered distressed sales. Regional banks curtailed lending after 2023’s turmoil, creating a USD 150 billion annual funding gap partly filled by CMBS and debt funds. The Fed’s guidance for only 50 basis points of easing through 2026 suggests borrowing costs will remain a drag on the United States commercial real estate market.
Office Sector Headwinds from Hybrid Work Reducing Occupancy and Valuations
Hybrid schedules adopted by 68% of employers cut utilization to 3.2 days weekly, leaving 20-25% of inventory functionally obsolete. Class B and C vacancy in secondary metros exceeded 28%, forcing concession packages equal to 2 years of free rent on 10-year leases. Non-core asset prices fell 30-40% from 2019 highs, and only 12% of stock qualifies for profitable apartment or life-science conversions. San Francisco’s vacancy climbed to 34.5%, the highest among large metros. Trophy buildings with wellness amenities maintained 85% occupancy and earned 25-30% rent premiums, reinforcing a flight-to-quality trend.
*Our forecasts treat driver/restraint impacts as directional, not additive. The impact forecasts reflect baseline growth, mix effects, and variable interactions.
Segment Analysis
By Business Model: Rental Accounts for Over Three-Quarters of Revenue
The rental segment captured 76.2% of 2025 revenue, underlining institutional appetite for predictable cash flows and CPI-linked escalators. Core-plus strategies delivered 4.2% same-store NOI growth, comfortably above the overall United States commercial real estate market CAGR, because most new industrial leases in 2025 embedded 3-4% annual bumps. Rental ownership also skirts mark-to-market risk, letting investors ride out valuation swings while collecting distributions.
Sales activity, forecast to grow at a 3.19% CAGR through 2031, revolves around distressed office conversions, subdivision land, and single-tenant deals priced 150 basis points over replacement-cost cap rates. Transaction velocity should accelerate once financing costs ease, potentially unleashing USD 200 billion of pent-up deals. Still, rental’s dominance in the United States commercial real estate market looks durable as insurers and pensions expand allocations to net-lease assets for liability matching.


By Property Type: Logistics Surges While Offices Reset
Office assets held a 29.1% slice of 2025 revenue even as hybrid work hollowed out commodity buildings. Owners of Class A space countered with wellness upgrades and flexible layout options, protecting occupancy rates near 85%.
Logistics is the fastest-growing property type with a 3.44% CAGR, buoyed by 16.3% e-commerce penetration and nearshoring demand for modern distribution nodes. Warehouse rents advanced 7.2% in 2025, and limited infill land ensured pricing power. Retail assets bifurcated: experiential centers enjoyed positive absorption, whereas legacy strips lagged. Data centers, hospitality, and self-storage broadened diversification, with the “other” cluster attracting USD 25 billion of equity despite a correction in data-center valuations.
By End User: Corporations Dominate but Household Demand Accelerates
Corporates and SMEs drove 79.5% of 2025 leasing, reflecting a sustained appetite for flexible offices, third-party logistics space, and destination retail[3]“2025 U.S. Net-Lease Report,” CBRE, cbre.com. Average corporate lease terms shortened to 5.2 years, pushing landlords to emphasize tenant-experience tech that raises renewal odds.
Individuals and households are slated to expand at a 3.25% CAGR through 2031 as millennials and Gen-Z favor rentals over ownership, lifting single-family rental and co-living formats. Government, non-profit, and educational tenants remain stable but resource-constrained. Mixed-use campuses increasingly fuse corporate and residential demand, optimizing land use and raising valuations.

Geography Analysis
California’s 21.1% share of 2025 revenue stems from robust AI leasing in Silicon Valley and 40 million square feet of annual logistics absorption in the Inland Empire. Title 24’s all-electric construction rule adds 8-12% to budgets yet trims long-run operating costs by about one-fifth. Texas gained 475,000 residents in 2025, lifting Dallas-Fort Worth industrial absorption to 35 million square feet, while multifamily rents grow 5-7% yearly through 2026. Florida’s 365,000-person population surge compressed Miami and Tampa cap rates by 50 basis points.
Illinois contends with corporate departures but retains strength in inland logistics, recording 18 million square feet of absorption in 2025. The Rest of US category will expand at a 3.61% CAGR, led by Phoenix’s 8.1% industrial rent growth, Nashville’s first positive office absorption since 2019, and Charlotte’s 12,000-unit multifamily pipeline. State regulatory divergence reinforces relocation trends: New York City’s carbon caps force USD 15-25 per square foot retrofits, whereas Texas’ streamlined permitting shaves 6-9 months off development schedules. Florida’s 10% cap on annual property-assessment hikes keeps holding costs low, enticing institutional capital.
Competitive Landscape
Scale brokerage houses—CBRE, JLL, Cushman & Wakefield, Newmark, and Colliers—account for about 60% of commission revenue yet face fee compression from PropTech rivals that deliver transparency at lower cost. These incumbents are integrating vertical services such as property and asset management to lock in annuity income and differentiate through data insights.
Technology investment has become pivotal. CBRE spent USD 500 million on digital platforms between 2023 and 2025, while JLL acquired a controlling stake in HqO to embed tenant-experience analytics across its managed portfolio. Smaller specialists like Marcus & Millichap defend turf in sub-USD 20 million sales by leveraging deep local networks for certainty of execution.
Regulation favors scale. SEC climate-disclosure rules threaten to raise fixed costs by up to USD 2 million per year for public REITs, an outlay that smaller firms may struggle to absorb. Consequently, mid-tier brokerages could pursue mergers to amortize compliance and tech spend, accelerating consolidation in the United States commercial real estate market.
United States Commercial Real Estate Industry Leaders
CBRE
JLL
Cushman & Wakefield
Newmark
Colliers
- *Disclaimer: Major Players sorted in no particular order

Recent Industry Developments
- February 2026: CBRE bought a 75% stake in a European energy-management PropTech platform to bolster ESG advisory services.
- January 2026: Prologis formed a USD 2.5 billion joint venture to build 15 million square feet of logistics space across Texas, Florida, and Georgia.
- December 2025: Simon Property Group partnered with a fitness-entertainment chain to convert 2 million square feet of vacant anchors into experiential venues.
- November 2025: JLL acquired 60% of HqO, integrating the tenant-experience app into its management platform


United States Commercial Real Estate Market Report Scope
By Business Model
| Sales |
| Rental |
| By Business Model | Sales |
| Rental |


Key Questions Answered in the Report
How large will U.S. commercial real estate be by 2031?
The USA commercial real estate market is forecast to reach USD 2.02 trillion by 2031, expanding at a 2.91% CAGR from 2026
Which property type is growing fastest?
Logistics facilities lead with a projected 3.44% CAGR through 2031, reflecting e-commerce growth and nearshoring demand.
Why does rental dominate transaction structures?
Rental assets offer CPI-linked escalators and predictable cash flows, giving rentals 76.2% of 2025 revenue compared with the more cyclical sales segment
How are ESG rules affecting owners?
SEC climate-disclosure mandates raise annual reporting costs to as much as USD 2 million per REIT and accelerate investment in energy-management technology .
Which regions offer the strongest outlook?
Sunbelt metros such as Phoenix, Nashville, and Charlotte are forecast to grow at or above 3.61% CAGR through 2031 thanks to in-migration and cost advantages .
Page last updated on:


