Market Overview
| Study Period | 2018 - 2031 |
|---|---|
| Forecast Data Period | 2026 - 2031 |
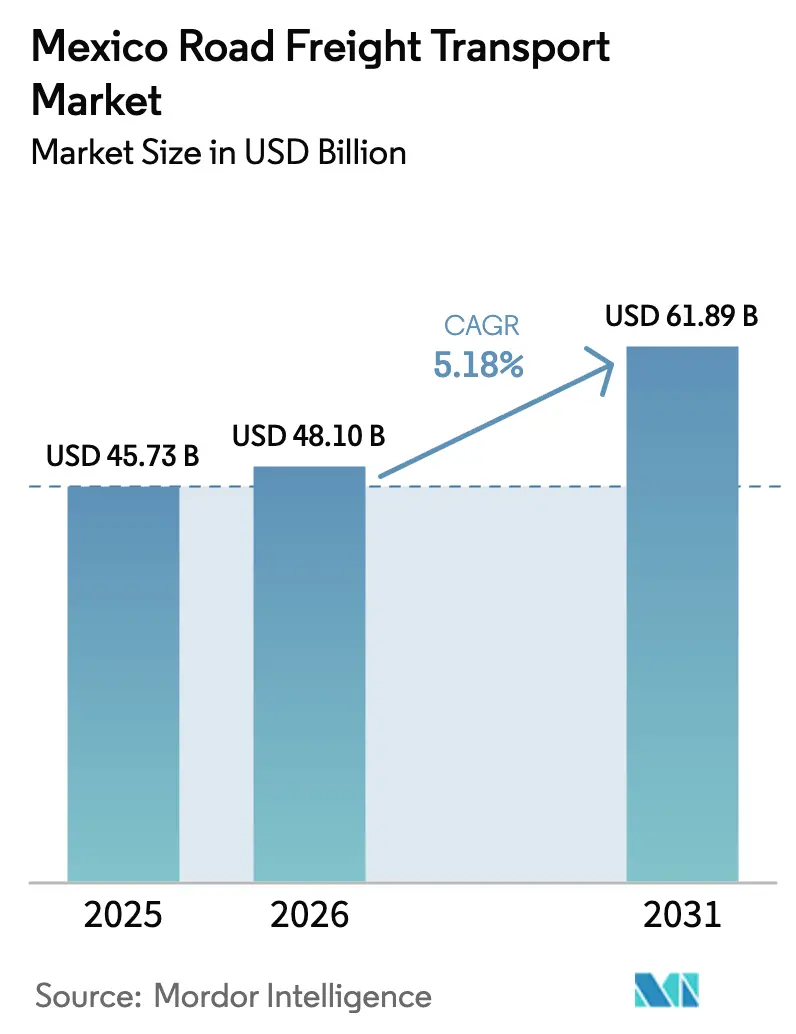
| Base Year Market Size (2025) | USD 45.73 Billion |
| Market Size (2026) | USD 48.1 Billion |
| Market Size (2031) | USD 61.89 Billion |
| Growth Rate (2026 - 2031) | 5.18% CAGR |
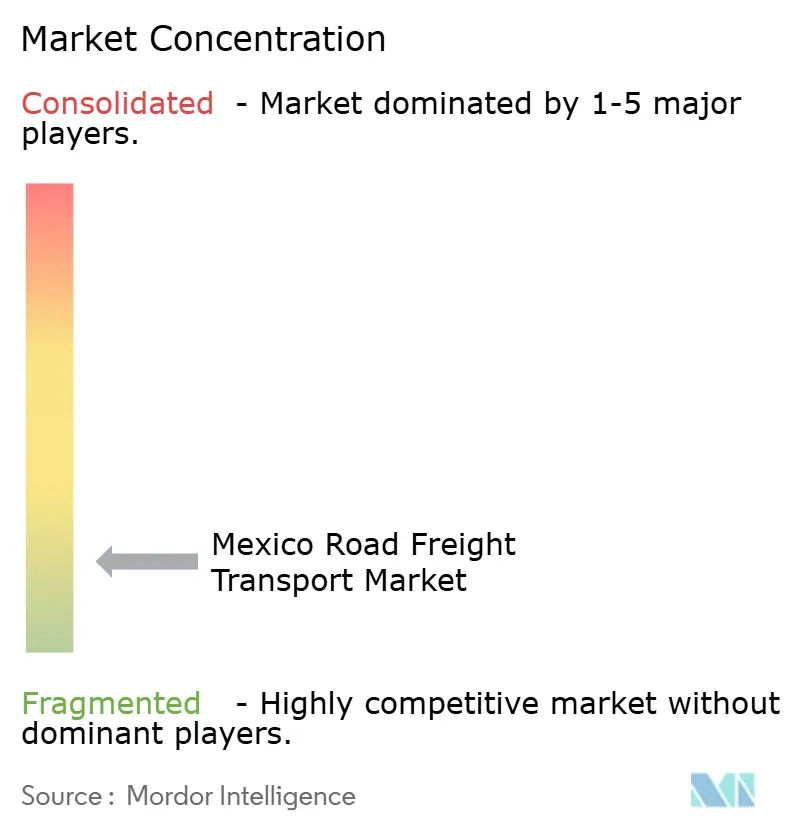
| Market Concentration | Low |
Major Players *Disclaimer: Major Players sorted in no particular order Image © Mordor Intelligence. Reuse requires attribution under CC BY 4.0. | |
Mexico Road Freight Transport Market Analysis by Mordor Intelligence
Mexico road freight transport market size in 2026 is estimated at USD 48.1 billion, growing from 2025 value of USD 45.73 billion with 2031 projections showing USD 61.89 billion, growing at 5.18% CAGR over 2026-2031. Cross-border truck trade with the United States climbed 9.5% year over year to USD 77.3 billion in March 2025, confirming Mexico’s strategic freight role within North America. Manufacturing generates the largest share of outbound demand as automotive and electronics exporters require fast, reliable trucking to meet just-in-time schedules. Concurrently, investment in LTL-oriented logistics hubs is reshaping domestic distribution patterns, while security and emissions regulations are accelerating fleet modernization. These trends collectively strengthen pricing power for technologically advanced carriers even as driver shortages and cargo theft erode margins for traditional operators.
Key Report Takeaways
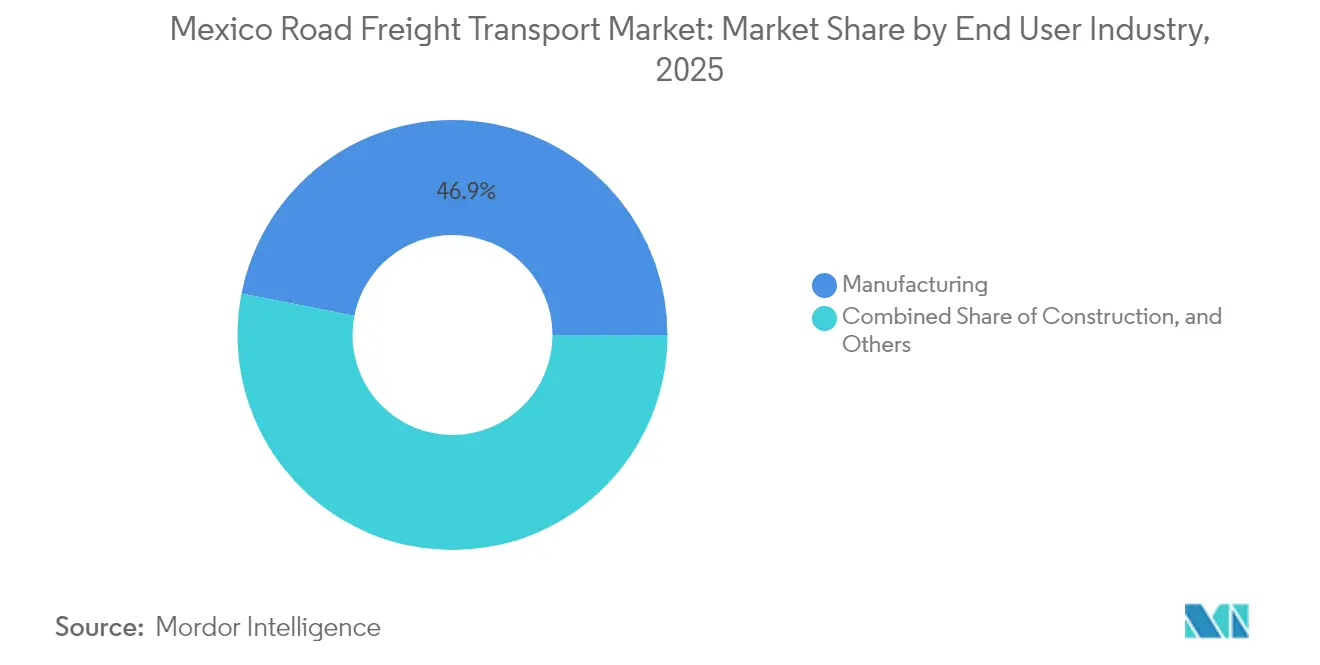
- By end user industry, manufacturing held 46.90% of the Mexico road freight transport market share in 2025; wholesale and retail trade is forecast to expand at a 5.88% CAGR between 2026-2031.
- By destination, domestic movements commanded 62.10% share of the Mexico road freight transport market size in 2025, while international freight is advancing at a 5.95% CAGR between 2026-2031.
- By truckload specification, Full-Truck-Load captured 81.00% revenue share in 2025; Less than-Truck-Load is projected to rise at a 5.68% CAGR between 2026-2031.
- By containerization, non-containerized shipments accounted for 84.00% of the Mexico road freight transport market size in 2025, whereas containerized freight records the fastest 5.22% CAGR between 2026-2031.
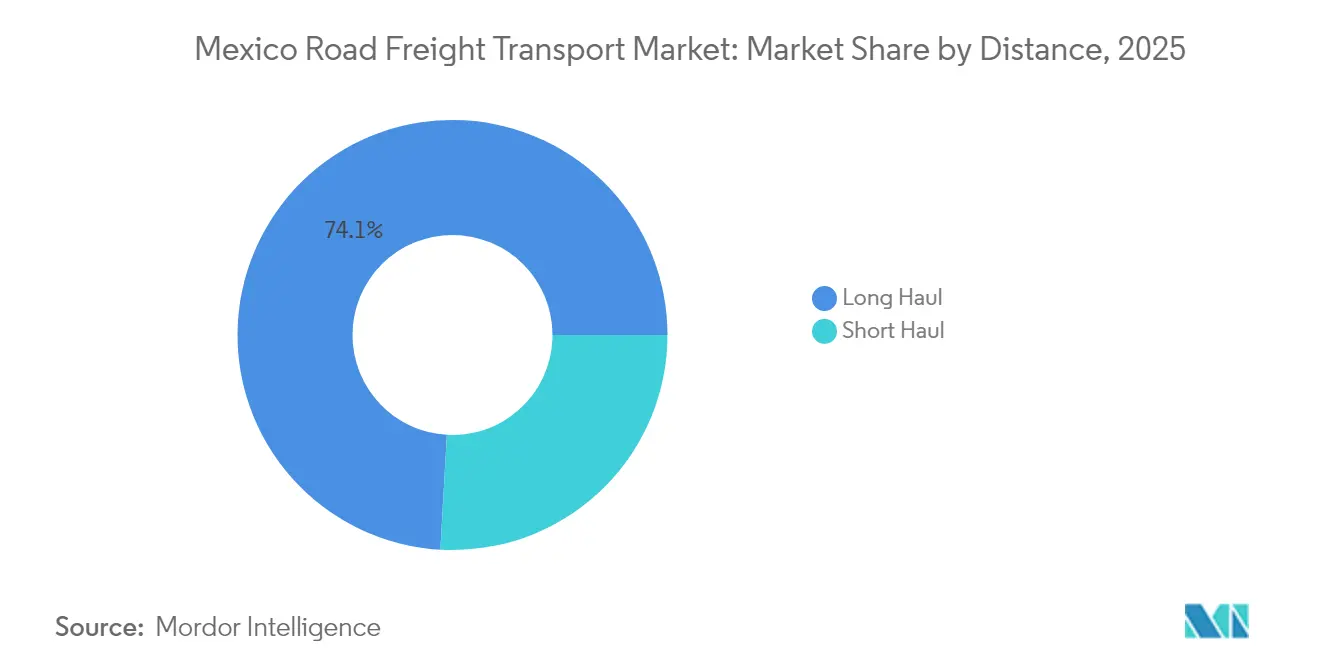
- By distance, long-haul services led with a 74.10% share in 2025 and are progressing at a 5.32% CAGR between 2026-2031.
- By goods configuration, solid goods comprised 61.20% share of the Mexico road freight transport market size in 2025; fluid goods are growing at 5.31% CAGR between 2026-2031.
- By temperature control, non-temperature-controlled freight dominated with 94.10% share in 2025, while temperature-controlled loads are expanding at a 5.57% CAGR between 2026-2031.
Note: Market size and forecast figures in this report are generated using Mordor Intelligence’s proprietary estimation framework, updated with the latest available data and insights as of 2026.
Mexico Road Freight Transport Market Trends and Insights
Drivers Impact Analysis*
| Driver | (~) % Impact on CAGR Forecast | Geographic Relevance | Impact Timeline |
|---|---|---|---|
| Near-shoring-led FDI surge | +1.8% | Northern border states, central corridors | Medium term (2-4 years) |
| E-commerce boom and LTL demand | +1.2% | Mexico City, Guadalajara, Monterrey | Short term (≤ 2 years) |
| Federal road-infrastructure expansion | +0.9% | National highway network | Long term (≥ 4 years) |
| Automated Laredo–Monterrey corridor | +0.7% | Texas–Mexico border region | Medium term (2-4 years) |
| Digital carta porte and paperless customs | +0.5% | Major trade corridors | Short term (≤ 2 years) |
| Cold-chain pharma export growth | +0.4% | Pharma manufacturing hubs | Medium term (2-4 years) |
| Source: Mordor Intelligence | |||


Near-Shoring-Led FDI Surge
Foreign manufacturers are redirecting supply chains from Asia to Mexico, unlocking sustained freight demand along border-adjacent industrial parks. French companies pledged USD 3 billion in new plants during 2024, and China-origin exports to Mexico reached USD 90.23 billion, up 10.8% year over year. Nearly 90% of Mexico’s 3.77 million vehicles produced in 2023 moved to the United States, Canada, and Germany, concentrating high-value shipments at crossings such as Laredo, which processed USD 30.5 billion in trade during March 2025. Bottlenecks at these gateways are steering investment toward dedicated truck lanes and intermodal nodes. Heightened cross-border density allows carriers with customs-ready fleets to command premium rates, while capacity shortfalls encourage long-term fleet renewal. The cumulative result is a virtuous cycle of corridor-focused capex that reinforces road freight’s primacy in the Mexico-U.S. manufacturing nexus[1] “BTS Data Reveals Long-term Trend Emerging in North American Freight Trucking,” Bureau of Transportation Statistics, bts.gov.
E-Commerce Boom and LTL Demand
Online retail penetration is reshaping shipment profiles from pallet-size FTL to parcel-rich LTL runs. MercadoLibre earmarked USD 2.5 billion for fulfillment upgrades, while Temu and Shein jointly captured 40% of cross-border e-commerce spend in 2024. Consequently, LTL volumes are climbing at 5.86% CAGR, outpacing overall market growth. Urban consolidation centers in Mexico City, Guadalajara, and Monterrey are now core to service design, prompting carriers to deploy smaller, security-enhanced trucks capable of quick turnarounds. Wholesale and retail traders mirror this shift by tightening inventory cycles, which magnifies the need for frequent, tech-driven dispatch. Carriers that combine dense pickup-and-delivery networks with digital visibility tools are monetizing the service gap created by Mexico’s large base of traditional FTL operators[2]“More Than Just Tech Needed for Logistics Companies to Thrive,” Mexico Business News, mexicobusiness.news .
Federal Road-Infrastructure Expansion
Government allocation of MXN 35 billion (USD 2.06 billion) to highways and MXN 157 billion (USD 9.24 billion) to rail in 2025 marks the largest freight-related infrastructure push in decades. Projects such as the Interoceanic Corridor from Salina Cruz to Coatzacoalcos add viable alternatives to the Panama Canal, routing Asian cargo through Pacific ports before truck distribution inland. Highway upgrades favor border crossings by widening lanes, adding weigh-in-motion stations, and integrating real-time traffic management. Carriers save 2-3% of shipment value formerly lost to delay fees, improving asset utilization. Over the long term, these improvements lower barrier-to-entry for temperature-controlled and hazmat carriers that previously avoided congested corridors, broadening service scope within the Mexico road freight transport market.
Automated Laredo-Monterrey Freight Corridor
Handling nearly 3 million inbound trucks each year, the Laredo–Monterrey route now relies on intelligent transportation systems that shrink border wait times to 90 minutes for compliant loads. Dedicated truck lanes, weigh-in-motion sensors, and AI-driven traffic analytics collectively reduce transit times by up to 20%. Fleet operators report fuel savings of 25% owing to lower idling, while shippers gain schedule reliability critical for just-in-time assembly lines. The corridor serves as a model for replication at Tijuana–San Diego and El Paso–Ciudad Juárez, expanding the efficiency dividend across the North American trade spine.
Restraints Impact Analysis*
| Restraint | (~) % Impact on CAGR Forecast | Geographic Relevance | Impact Timeline |
|---|---|---|---|
| Cargo theft and security risks | −1.1% | Central highways, national | Short term (≤ 2 years) |
| Driver shortage and high turnover | −0.8% | Border states, urban hubs | Medium term (2-4 years) |
| SME-carrier technology gap | −0.5% | Nationwide rural lanes | Medium term (2-4 years) |
| Northern-state water/energy constraints | −0.3% | Manufacturing border states | Long term (≥ 4 years) |
| Source: Mordor Intelligence | |||
Cargo Theft and Security Risks
Reported theft cases hit 15,937 between January and November 2024, up 9% year over year, with 83% involving violence against drivers. High-risk corridors force carriers to equip GPS beacons, employ escorts, and use reinforced trailers, adding 8-12% to operating costs. Insurance premiums likewise climb, and shipper RFPs increasingly stipulate real-time location data. While the Balam security plan has tempered incident growth in recent months, route planning and night-driving curfews still limit asset utilization, restraining overall market expansion[3]FreightWaves, “Top 5 US-Mexico Trade Stories of 2024,” freightwaves.com.
Driver Shortage and High Turnover
A deficit of 70,000 licensed drivers in 2024 pushed average wages up 108%, eroding carrier profit margins. Attrition exceeds 80% annually at many fleets, driven by security fears, regulatory paperwork, and the lure of tech-sector jobs. Training a CDL-qualified recruit costs USD 3,000-5,000, stretching SME budgets. Some operators trial platooning and autonomous pilots, yet commercial roll-out remains several years away, keeping labor scarcity an acute mid-term constraint[4]“The 2023 Mexican Car Market (Volumes and Trends),” Global Fleet, globalfleet.com.
*Our forecasts treat driver/restraint impacts as directional, not additive. The impact forecasts reflect baseline growth, mix effects, and variable interactions.
Segment Analysis
By End User Industry: Manufacturing Anchors Freight Volumes
Manufacturing accounted for a 46.90% Mexico road freight transport market share in 2025, reflecting dominant outbound flows of vehicles, electronics, and machinery. Auto parts alone generated USD 121.7 billion in 2023 sales, knitting together multi-tier supplier lanes across 10 states. This dense network yields predictable, high-margin FTL hauls that underpin steady trailer utilization.
The wholesale and retail trade segment is forecast to advance at a 5.88% CAGR between 2026-2031, propelled by e-commerce fulfillment and omnichannel restocking cycles. Rapid-turn inventory models multiply backhaul opportunities, enabling carriers to trim empty-mile ratios. Together these dynamics widen the revenue base beyond automotive, enhancing resilience of the Mexico road freight transport market.


By Destination: Domestic Scale Meets International Momentum
Domestic lanes retained 62.10% of the Mexico road freight transport market size in 2025, thanks to sizeable intra-country supply chains linked to 128 million consumers. Agricultural outbound from the central plains meets industrial inputs flowing north and consumer goods heading south, creating balanced equipment flows. Federal spending on bypass roads around Mexico City eases urban congestion, raising on-time performance.
International freight, while smaller, is pacing ahead at a 5.95% CAGR between 2026-2031, as USMCA harmonization trims customs friction. Digital Carta Porte integration now synchronizes manifests with U.S. ACE filings, lowering dwell times and drawing more shippers toward road-based cross-border modes. The resulting interdependence strengthens the long-run competitiveness of the Mexico road freight transport market.
By Truckload Specification: FTL Dominates, LTL Scales Up
Full-Truck-Load services captured 81.00% share in 2025, underpinned by high-volume automotive and electronics contracts that demand dedicated capacity. Border pre-clearance lanes favor FTL by incentivizing complete-seal integrity.
Less-than-Truck-Load, expanding at 5.68% CAGR (2026-2031), leverages consolidation hubs and AI-based load matching. C.H. Robinson’s 2025 cross-border service illustrates cost-out potential of 40% for shippers when dynamic routing blends U.S. and Mexican pickup networks. As parcel-rich cargo proliferates, LTL’s strategic weight within the Mexico road freight transport market continues to rise.
By Containerization: Non-Containerized Leads but Boxes Gain Ground
Non-containerized freight commanded 84.00% share in 2025, covering bulk commodities and auto racks that suit flatbed and specialized trailers. Flexibility in loading oversized equipment keeps this format dominant across domestic corridors.
Containerized shipments, however, register a brisk 5.22% CAGR (2026-2031) as Pacific-side ports like Manzanillo add direct Shanghai rotations with 24-day transits. Sealed boxes expedite customs inspections, lowering dwell time, and aligning well with automated highway corridors that favor drop-and-hook operations.
By Distance: Long-Haul Drives Revenue, Short-Haul Fuels Density
Long-haul lanes held 74.10% share in 2025 and will climb at a 5.32% CAGR between 2026-2031, reflecting the north-to-south stretch between manufacturing clusters and end-markets. Intelligent traffic systems on the Laredo–Monterrey artery cut transit time 20%, enhancing trailer turns and driver productivity.
Short-haul segments cater to urban fulfillment and plant-to-warehouse shuttles. Smarter route planning using real-time traffic feeds is shrinking empty miles, while 5G-enabled dock-door scheduling smooths yard congestion. Together, both distance tiers contribute to a balanced growth profile for the Mexico road freight transport market.
By Goods Configuration: Solid Goods Core, Fluid Niche Rising
Solid goods represented 61.20% of 2025 volume, spanning auto components, consumer electronics, and construction materials. Standard dry-van equipment and established shipper relationships keep this category stable and cost-efficient.
Fluid goods, expanding at 5.31% CAGR (2026-2031), comprise fuels, chemicals, and food-grade liquids that require insulated or stainless-steel tanks. NOM-044 emissions rules encourage newer engines, raising capex but also delivering fuel efficiencies that offset operating cost. Specialized compliance favors larger fleets, consolidating share in this growing niche.
By Temperature Control: Ambient Prevails, Cold-Chain Premiums Expand
Non-temperature-controlled freight dominated with 94.10% share in 2025, reinforcing the market’s reliance on ambient goods and straightforward operating models. Competitive rates and abundant carrier capacity keep this segment essential for mass-market logistics.
Temperature-controlled loads, climbing at 5.57% CAGR (2026-2031), leverage rising pharma exports and fresh-food e-commerce. IoT probes now log every degree shift, enabling proactive interventions and lowering spoilage claims. The segment’s premium yields strengthen revenue diversification within the Mexico road freight transport market.
Geography Analysis
Northern border states generate the bulk of Mexico’s freight throughput due to dense automotive and electronics clusters feeding U.S. assembly plants. Laredo alone processes nearly 3 million incoming trucks annually, representing USD 30.5 billion in trade value in March 2025. Recent automation has cut typical crossing times to 90 minutes, solidifying the corridor’s dominance.
Central regions act as a relay between agriculture and manufacturing, leveraging the MXN 35 billion (USD 2.06 billion) Highway Plan’s ring-road upgrades to bypass Mexico City gridlock. Improved east-west connectivity via the Interoceanic Corridor is expected to redistribute Pacific-origin cargo toward Veracruz for inland truck distribution, creating fresh lane combinations.
Southern territories remain primarily export-oriented for perishables and energy inputs, yet tourism-linked infrastructure is indirectly boosting dry-van capacity by raising consumer goods inflows. Collectively, these geographic nuances reinforce diversified lane dynamics that underpin the resilience of the Mexico road freight transport market.
Competitive Landscape
The industry is fragmented, yet consolidation is accelerating. Traxión absorbed Solistica from FEMSA for USD 208 million, while UPS paid more than USD 1 billion for Estafeta to expand last-mile reach. Digital-first entrants like Cargado pair load boards with embedded insurance, attracting 300 trucking companies within months of launch.
Carriers owning telematics-ready fleets exploit regulatory headwinds such as digital Carta Porte and NOM-044 to win compliance-sensitive contracts. Meanwhile, security-focused operators leverage armored boxes and escort networks to command premiums on high-risk corridors. The top five players now control roughly 45-50% of formal sector revenue, yet thousands of micro-fleets persist in regional lanes, sustaining price dispersion and service gaps.
Investment themes favor 5G-enabled cold-chain, AI-driven consolidation for LTL, and cross-border drop-and-hook yards. These priorities align with shippers’ twin demands for visibility and cost certainty, setting the competitive agenda for the Mexico road freight transport market through 2030.
Mexico Road Freight Transport Industry Leaders
Fletes Mexico
Traxion
Schneider National, Inc.
FedEx
Transportes Castores
- *Disclaimer: Major Players sorted in no particular order

Recent Industry Developments
- September 2025: C.H. Robinson unveiled a US-Mexico LTL consolidation platform promising up to 40% cost savings for shippers.
- September 2025: Echo Global Logistics invested USD 10 million to scale Mexican operations and cross-border tech infrastructure.
- March 2025: DHL Group completed a USD 120 million expansion of its Queretaro hub, adding pharma-grade cold rooms and automated sortation.
- March 2024: A.P. Moller-Maersk opened a large, modern cross-border facility in Tijuana (Pacifico Industrial Park), Mexico, targeting cross-border trade.


Mexico Road Freight Transport Market Report Scope
Agriculture, Fishing, and Forestry, Construction, Manufacturing, Oil and Gas, Mining and Quarrying, Wholesale and Retail Trade, Others are covered as segments by End User Industry. Domestic, International are covered as segments by Destination. Full-Truck-Load (FTL), Less than-Truck-Load (LTL) are covered as segments by Truckload Specification. Containerized, Non-Containerized are covered as segments by Containerization. Long Haul, Short Haul are covered as segments by Distance. Fluid Goods, Solid Goods are covered as segments by Goods Configuration. Non-Temperature Controlled, Temperature Controlled are covered as segments by Temperature Control.End User Industry
| Agriculture, Fishing, and Forestry |
| Construction |
| Manufacturing |
| Oil and Gas, Mining and Quarrying |
| Wholesale and Retail Trade |
| Others |
Destination
| Domestic |
| International |
Truckload Specification
| Full-Truck-Load (FTL) |
| Less than-Truck-Load (LTL) |
Containerization
| Containerized |
| Non-Containerized |
Distance
| Long Haul |
| Short Haul |
Goods Configuration
| Fluid Goods |
| Solid Goods |
Temperature Control
| Non-Temperature Controlled |
| Temperature Controlled |
| End User Industry | Agriculture, Fishing, and Forestry |
| Construction | |
| Manufacturing | |
| Oil and Gas, Mining and Quarrying | |
| Wholesale and Retail Trade | |
| Others | |
| Destination | Domestic |
| International | |
| Truckload Specification | Full-Truck-Load (FTL) |
| Less than-Truck-Load (LTL) | |
| Containerization | Containerized |
| Non-Containerized | |
| Distance | Long Haul |
| Short Haul | |
| Goods Configuration | Fluid Goods |
| Solid Goods | |
| Temperature Control | Non-Temperature Controlled |
| Temperature Controlled |


Market Definition
- Agriculture, Fishing, and Forestry (AFF) - This end user industry segment captures the external (outsourced) logistics expenditure incurred by the AFF industry players on road freight transport service. The end user players considered are the establishments primarily engaged in growing crops, raising animals, harvesting timber, harvesting fish & other animals from their natural habitats and providing related support activities. Herein, across the value chain, Logistics Service Providers (LSPs) play a crucial role in acquisition, storage, handling, transportation, and distribution activities for the optimal & continuous flow of inputs (seeds, pesticides, fertilizers, equipment, and water) from manufacturers or suppliers to the producers and smooth flow of output (produce, agro-goods) to distributors/ consumers. This includes both termperature controlled and non-temperature controlled logistics, as and when required according to the shelf life of goods being transported or stored.
- Construction - This end user industry segment captures the external (outsourced) logistics expenditure incurred by the construction industry players, on road freight transport service. The end user players considered are the establishments primarily engaged in constructing, repairing and renovating residential & commercial buildings, infrastructure, engineering works, subdividing and developing land. Logistics Service Providers (LSPs) play a crucial role in increasing profitability of construction projects by maintaing the inventory of raw materials & equipment, time-critical supplies and by providing other value added services for effective project management.
- Containerized Road Freight Transport - The segment captures the external (outsourced) logistics expenditure incurred by the road freight transport service end users on Full-Truck-Load (FTL) services. FTL road freight transport is characterized as a full single load not combined with other shipments. It comprises of shipments (i) devoted to the goods of a single shipper (ii) taken directly from a point of origin to one or more destination points (iii) comprising of bulk mail truck transportation (iv) comprising of both Container (Full Container Load, FCL)/Non-Container trucking services (v)comprsing of goods requiring temperature controlled or non-temperature controlled transportation services (vi) comprising of bulk liquid tankering (vii) invoving trucking of waste (viii) hazardous material trucking. Related value added services (VAS) of sorting, consolidation, deconslidation are included in the other services segment of freight and logistics market.
- Export Trends and Import Trends - Overall logistics performance of an economy is positively and significantly (statistically) correlated to its trade performance (exports and imports). Hence, in this industry trend, total value of trade, major commodities/ commodity groups and the major trade partners, for the studied geography (country or region as per the scope of report) have been analysed alongside the impact of major trade/logistics infrastructure investments & regulatory environment.
- Fluid Goods - The segment captures the external (outsourced) logistics expenditure incurred by the road freight transport service end users for the transport of bulk liquids, that are often used in extraction, manufacturing, food processing, agriculture industries among others. It includes transportation of liquids like (i) Chemicals/ hazardous goods (for instance acids) (ii) Water (potable as well as waste) (iii) Oil and gas (upstream as well as downstream like gasoline, fuel, crude oil, or propane), (iv) Food grade bulk liquids (like milk, or juice), (v) Rubber, (vi) Agrichemical products, among others. These goods are generally transported through tanker trucking.
- Fuel Price - Fuel price spikes can cause delays and diruption for logistics service providers (LSPs), while drops in the same can result in higher short-term profitability and increased market rivalry to offer consumers with the best deals. Hence, the fuel price variations have been studied over the review period and presented along with the causes as well as market impacts.
- Full-Truck-Load (FTL) Road Freight Transport - The segment captures the external (outsourced) logistics expenditure incurred by the road freight transport service end users on Full-Truck-Load (FTL) services. FTL road freight transport is characterized as a full single load not combined with other shipments. It comprises of shipments (i) devoted to the goods of a single shipper (ii) taken directly from a point of origin to one or more destination points (iii) comprising of bulk mail truck transportation (iv) comprising of both Container (Full Container Load, FCL)/Non-Container trucking services (v)comprsing of goods requiring temperature controlled or non-temperature controlled transportation services (vi) comprising of bulk liquid tankering (vii) invoving trucking of waste (viii) hazardous material trucking. Related value added services (VAS) of sorting, consolidation, deconslidation are included in the other services segment of freight and logistics market.
- GDP Distribution by Economic Activity - Nominal Gross Domestic Product and distribution of the same, across major economic sectors in the geography studied (country or region as per scope of the report) have been studied and presented in this industry trend. As GDP is positively related to the profitability and growth of logistics industry, this data has been used in adjunction to the input-output tables/ supply-use tables for analyzing the potential major contributing sectors towards the logistics demand.
- GDP Growth by Economic Activity - Growth of Nominal Gross Domestic Product across major economic sectors, for the geography studied (country or region as per scope of the report) have been presented in this industry trend. This data has been utilized for assessing the growth of logistics demand from all the market end users (economic sectors considered here).
- Inflation - Variations in both Wholesale Price Inflation (YoY change in producer price index) and Consumer Price Inflation have been presented in this industry trend. This data has been used to assess the inflationary environment as it plays a vital role in smooth functioning of the supply chain, directly impacting the logistics operational cost components e.g., pricing of tyres, driver wages & benefits, energy/fuel prices, maintenace costs, toll charges, warehousing rents, custom brokerage, forwarding rates, courier rates etc. hence impacting the overall freight and logistics market.
- Key Industry Trends - The report section named "Key Industry Trends" include all the key variables/parameters studied to better analyze the market size estimates and forecasts. All the trends have been presented in the form of data points (time series or latest available data points) along with analysis of the paramter in the form of concise market relevant commentary, for the geography studied (country or region as per the scope of report).
- Key Strategic Moves - The action taken by a company to differentiate from its competitor or used as a general strategy is referred to as a key strategic move (KSM). This includes (1) Agreements (2) Expansions (3) Financial Restructuring (4) Mergers and Acquisitions (5) Partnerships, and (6) Product Innovations. Key players (Logistics Service Providers, LSPs) in the market have been shortlisted, their KSM have been studied and presented in this section.
- Less than-Truck-Load (LTL) Road Freight Transport - The segment captures the external (outsourced) logistics expenditure incurred by the road freight transport service end users on Less than-Truck-Load (LTL) services. LTL road freight transport is characterized as multiple shipments combined onto a single truck for multiple deliveries within a network. It comprises of establishments (i) primarily engaged in general and specialized freight trucking of less than complete truck-loads, (ii) characterized by the use of terminals to consolidate shipments, generally from several shippers, into a single truck for haulage between a load assembly terminal and a disassembly terminal, where the load is sorted and shipments are re-routed for delivery (iv) Less than-Container-Load (LCL) shipping/ Groupage Shipping in case of trucking services. The activities in scope include (i) local pick-up, (ii) line-haul, and (iii) local delivery. Related value added services (VAS) of sorting, consolidation, deconslidation are included in the other services segment of freight and logistics market.
- Logistics Performance - Logistics Performance and Logistics Costs are the backbone of trade, and influences trade costs, making countries compete globally. Logistics performance is influenced by market wide adopted supply chain management strategies, government services, investments & policies, fuel/ energy costs, inflationary environment etc. Hence, in this industry trend, the logistics performance of the geography studied (country/ region as per the scope of report) has been analysed and presented over the review period.
- Major Truck Suppliers - Market share of truck brands is influenced by factors like geographical preferences, portfolio of truck types, truck prices, local production, truck repair & maintenance service peneteration, customer support, technological innovations (like electric vehicles, digitalization, autonomous trucks), fuel efficiency, financing options, annual maintenance costs, availability of substitutes, marketing startegies etc. Hence, the distribution (share % for base year of the study) of truck sales volume for leading truck brands and commentary on current market scenario & market anticipation over the forecast period have been presented in this industry trend.
- Manufacturing - This end user industry segment captures the external (outsourced) logistics expenditure incurred by the Manufacturing industry players, on road freight transport service. The end user players considered are the establishments primarily engaged in the chemical, mechanical or physical transformation of materials or substances into new products. Logistics Service Providers (LSPs) play a crucial role in maintaining a smooth flow of raw materials across the supply chain, enabling timely delivery of finished goods to distributors or end customers and storing & supplying the raw materials to clients for just-in-time manufacturing.
- Modal Share - Freight Modal Share is influenced by factors like modal productivity, government regulations, containerization, distance of shipment, temperature control requirements, type of goods, international trade, terrain, speed of delivery, shipment weight, bulk shipments, etc. Also, modal share by tonnage (tons) and modal share by freight turnover (ton-km) differ as per average distance of shipments, weight of major commodity groups transported in the economy and number of trips. This industry trend represents the distribution of freight transported by mode of transport (tons as well as ton-km), for the study base year.
- Oil and Gas, Mining and Quarrying - This end user industry segment captures the external (outsourced) logistics expenditure incurred by the extraction industry players, on road freight transport service. The end user players considered are the establishments that extract naturally occurring mineral solids, such as coal and ores; liquid minerals, such as crude petroleum; and gases, such as natural gas. Logistics Service Providers (LSPs) covers entire phases from upstream to downstream and plays a crucial role in the transportation of machinery, drilling equipments, extracted minerals, crude oil & natural gas and refined/ processed products from one place to another.
- Other End Users - Other end user segment captures the external (outsourced) logistics expenditure incurred by the financial services (BFSI), real estate, educational services, healthcare, and professional services (administrative, waste management, legal, architectural, engineering, design, consulting, scientific R&D), on road freight transport service. Logistics Service Providers (LSPs) plays a crucial role in the reliable movement of supplies and documents to/from these industries such as transporting any equipment or resources required, shipping confidential documents and files, movement of medical goods & supplies (surgical supplies and instruments, including gloves, masks, syringes, equipment) to name a few.
- Producer Price Inflation - It indicates inflation from viewpoint of the producers viz. the average selling price received for their output over a period of time. Annual change (YoY) of producer price index is reported as wholesale price inflation in the "Inflation" industry trend. As WPI captures dynamic price movements in most comprehensive way, it is widely used by governments, banks, industry, business circles and is deemed important in formulation of trade, fiscal and other economic policies. The data has been used in adjunction to consumer price inflation for better understanding the inflationary environment.
- Road Freight Pricing Trends - Freight pricing by mode of transport (USD/tonkm), over the review period, has been presented in this industry trend. The data has been used in assessing the inflationary environment, impact on trade, freight turnover (tonkm), road freight transport market demand and hence the road freight transport market size.
- Road Freight Tonnage Trends - Freight tonnage (weight of goods in tons) handled by mode of transport, over the review period, has been presented in this industry trend. The data has been used as one of the parameters apart from average distance per shipment (km), freight volume (tonkm), and freight pricing (USD/tonkm) to assess the freight transport market size.
- Road Freight Transport - Hiring a road freight transport logistics service provider (LSP) or haulier (outsourced logistics), for the transport of commodities constitutes road freight transport market. The scope of study includes (i) road transport of goods reported by hauliers registered in the reporting countries (ii) transport of raw materials or manufactured goods (solids as well as fluids) (iii) transport using commerical motor vehicles (rigid trucks or tractor-trailers, (iv) Full-Truck-Load (FTL) or Less than-Truck-Load (LTL) transport (v) containerized or non-containerized transport (vi) temperature controlled or non-temperature controlled trasnport, (vii) short haul or long haul (Over-the-road, OTR) transport, (viii) used office or household goods transport (movers and packers), (ix) other specialized cargo transport (dangerous goods, oversized cargo) and (x) outsourced first mile/ middle mile/last mile delivery shipments undertaken by road freight transport players. The scope does not include (i) transport undertaken by hauliers registered in other countries (ii) last mile meal delivery market (iii) grocery delivery market (iv) transportation via road network undertaken/ reported by Courier, Express, and Parcel (CEP) players.
- Road Length - As infrastructure plays a vital role in an economy's logistics performance, variables like length of roads, distribution of road length by surface category (paved v/s unpaved), distribution of road length by road classification (expressways v/s highways v/s other roads), have been analysed and presented in this industry trend.
- Segmental Revenue - Segmental Revenue has been triangulated or computed and presented for all the major players in the market. It refers to the road freight transport market specific revenue earned by the company, over the base year of study, in the geography studied (country or region as per the scope of report). It is computed through the study and analysis of major parameters like financials, service portfolio, employee strength, fleet size, investments, number of countries present in, major economies of concern, etc. that have been reported by the company in its annual reports, webpage. For companies having scarce financial disclosures, paid databases like D&B Hoovers, Dow Jones Factiva have been resorted to and verified through industry/expert interactions.
- Short Haul Road Freight Transport - The segment captures the external (outsourced) logistics expenditure incurred by the road freight transport service end users on local trucking (less than 100 miles). It includes the road transport of goods (i) within a single administrative area and its hinterland, (ii) by smaller trucks and pickup trucks (iii) via containerized as well as dry bulk services (iv) intermodal from ports, container terminals or airports, and (v) outsourced first mile/ last mile delivery shipments undertaken by road freight transport players.
- Transport and Storage Sector GDP - Value and growth of Transport and Storage Sector GDP has a direct relation to the freight and logistics market size, and hence road freight transport market size. Therefore, this variable has been studied and presented over the review period, in value terms (USD) and as share % of total GDP, in this industry trend. The data has been supported by concise and relevant commentary around the investments, developments, and current market scenario.
- Trends in E-Commerce Industry - Enhanced internet connectivity and boom in smartphone penetration, coupled with increasing disposable incomes, has led to a phenomenal growth in the e-commerce market globally. Online shoppers require fast and efficient delivery of their orders leading to an increase in the demand for logistics services especially e-commerce fulfilment services. Hence, the Gross Merchandise Value (GMV), historial and projected growth, breakup of major commodity groups in e-commerce industry for the studied geography (country or region as per scope of the report) have been analysed and presented in this industry trend.
- Trends in Manufacturing Industry - Manufacturing industry involves the transformation of raw materials into finished products, while logistics industry ensures the efficient flow of raw materials to the factory, and the transport of manufactured products to the distributors & consumers. Demand-Supply of both industries are highly cross-linked and critical for a seamless supply chain. Hence, the Gross Value Added (GVA), breakup of GVA into major manufacturing sectors, and growth of manufacturing industry over the review period have been analysed and presented, in this industry trend.
- Trucking Fleet Size By Type - Market share of truck types is influenced by factors like geographical preferences, major end user industries, truck prices, local production, truck repair & maintenance service peneteration, customer support, technological disruptions (like electric vehicles, digitalization, autonomous trucks) etc. Hence, the distribution (share % for base year of study) of truck parc volume by type of truck, market disruptors, truck manufacturing investments, truck specifications, truck use & import regulations, and market anticipation over the forecast period have been presented in this industry trend.
- Trucking Operational Costs - The prime reasons for measuring/ benchmarking logistics performance of any trucking company are to reduce operational costs and increase profitability. On the other hand, measuring operational costs helps to identify whether and where to make operational changes to control expenses and identify areas for improved performance. Hence, in this industry trend, trucking operational costs and the variables involved viz. driver wages & benefits, fuel prices, repairs & maintenance costs, tyre costs etc. have been studied over the base year of study, and presented for the geography studied (country or region as per the scope of report).
- Wholesale and Retail Trade - This end user industry segment captures the external (outsourced) logistics expenditure incurred by the wholesalers and retailers, on road freight transport service. The end user players considered are the establishments primarily engaged in wholesaling or retailing merchandise, generally without transformation, and rendering services incidental to the sale of merchandise. Logistics Service Providers (LSPs) plays a crucial role in the reliable movement of supplies to and finished products from production houses to the distributors and finally to the end customer covering activites like material sourcing, transportation, order fulfillment, warehousing & storage, demand forecasting, inventory management etc.
| Keyword | Definition |
|---|---|
| Cabotage | Road transport by a motor vehicle registered in a country performed on the national territory of another country. |
| Cross Docking | Cross docking is a logistics procedure where products from a supplier or manufacturing plant are distributed directly to a customer or retail chain with marginal to no handling or storage time. Cross docking takes place in a distribution docking terminal; usually consisting of trucks and dock doors on two (inbound and outbound) sides with minimal storage space. The name ‘cross docking’ explains the process of receiving products through an inbound dock and then transferring them across the dock to the outbound transportation dock. |
| Cross Trade | International road transport between two different countries performed by a road motor vehicle registered in a third country. A third country is a country other than the country of loading/embarkation and than the country of unloading/disembarkation. |
| Dangerous Goods | The classes of dangerous goods carried by Road are those defined by the fifteenth revised edition of the UN Recommendations on the Transport of Dangerous Goods, United Nations, Geneva 2007. They include Class 1: Explosives; Class 2: Gases; Class 3: Flammable Liquids; Class 4: Flammable solids- substances liable to spontaneous combustion; substances which, on contact with water, emit flammable gases; Class 5: Oxidizing substances and organic peroxides; Class 6: Toxic and infectious substances; Class 7: Radioactive material and Class 8: Corrosive substances, Class 9: Miscellaneous dangerous substances and articles. |
| Direct Shipment | Direct shipment is a method of delivering goods from the supplier or the product owner to the customer directly. In most cases, the customer orders the goods from the product owner. This delivery scheme reduces transportation and storage costs, but requires additional planning and administration. |
| Drayage | A drayage is a form of trucking service that connects the different modes of shipping (intermodal), such as ocean freight or air freight. It’s a short-haul trip that transports goods from one place to another, usually before or after its long-haul shipping process. Drayage trucks move cargo to and from various destinations, such as container ships, storage lots, order fulfillment warehouses, and rail yards. Typically, drayage only transports goods in short distances and operates only in one metropolitan area. It also requires only one trucker in a single shift. But despite this, but it plays an important role in long-haul shipping because it gets the goods to the cargo and vice versa. It makes intermodal transport much more efficient and enables the seamless transfer of goods to the end customer. |
| Dry van | A dry van is a type of semi-trailer that's fully enclosed to protect shipments from outside elements. Designed to carry palletized, boxed or loose freight, dry vans aren't temperature-controlled (unlike refrigerated “reefer” units) and can't carry oversized shipments (unlike flatbed trailers). |
| Final Demand | Final demand includes all types of commodities (goods as well as services) consumed as final use and might include personal consumption, or consumption by government, by businesses as capital investment, and as exports. includes all types of commodities (goods as well as services) consumed as final use and might include personal consumption, or consumption by government, by businesses as capital investment, and as exports. |
| Flatbed Truck | A flatbed truck is a type of truck with rigid design. It has a back body that is flatly shaped for easy loading and unloading of goods. The flatbed truck is mostly used to transport heavy, oversized, wide and indelicate goods such as machinery, building supplies or equipment. Due to the truck open body, the goods transported with it must not be vulnerable to rain. By functionality, the flatbed truck is comparable to a flatbed trailer. |
| Inbound Logistics | Inbound logistics is the way materials and other goods are brought into a company. This process includes the steps to order, receive, store, transport and manage incoming supplies. Inbound logistics focuses on the supply part of the supply-demand equation. |
| Intermediate Demand | Intermediate demand includes goods, services, and maintenance and repair construction sold to businesses, excluding capital investment. |
| International Loaded | Place of loading of goods in reporting country (i.e., country in which the vehicle performing the transport is registered) and place of unloading in a different country. |
| International Unloaded | Place of unloading of goods in reporting country (i.e., country in which the vehicle performing the transport is registered) and place of loading in a different country. |
| OOG cargo | Out of Gauge (OOG) cargo is any cargo that can not be loaded into six-sided shipping containers simply because it is too large. The term is a very loose classification of all cargo with dimensions beyond the maximum 40HC container dimensions. That is a length beyond 12.05 meters – a width beyond 2.33 meters – or a height beyond 2.59 meters. |
| Pallets | Raised platform, intended to facilitate the lifting and stacking of goods. |
| Part load | A part load describes goods which only fills a truck partially. In essence, the quantity of the shipment is bigger than the Less Than Truckload (LTL) shipment. Also, the shipment cannot fully occupy a truck i.e. its capacity is much lower than a Full Truckload (FTL) shipment. |
| Paved Road | Road surfaced with crushed stone (macadam) with hydrocarbon binder or bituminized agents, with concrete or with cobblestone. |
| Reverse Logistics | Reverse logistics comprises of the sector of supply chains that process anything returning inwards through the supply chain or traveling ‘backward’ through the supply chain. |
| Road Freight Transport Service | Hiring a trucking agency for transport of commodities (raw materials or manufactured goods including both solids and liquids) form the origin to a destination within the country (domestic) or cross-border (international) constitutes road freight transport market. The service might be Full-Truck-Load or Less than-Truck-Load, containerized or non-containerized, temperature controlled or non temperature controlled, short haul or long haul. |
| Tautliner vehicle | Tautliner and curtainsider are used as generic names for curtain sided trucks/trailers. The curtains are permanently fixed to a runner at the top and detachable rails/poles at front and rear, allowing the curtains to be drawn open and forklifts used all along the sides for easy and efficient loading and unloading. When closed for travel, vertical load restraint straps are attached to a rope rail beneath the truck bed, connecting the truck bed and curtain along both sides. Winches at either end of the curtain tension it, hence the 'Tautliner' name. This stops the curtain from flapping or drumming in the wind and can also help retain light loads from slipping sideways. |
| Transport for hire or reward | The carriage for remuneration of goods. |
| Unpaved Road | Road with a stabilized base not surfaced with crushed stone, hydrocarbon binder or bituminized agents, concrete or cobblestone. |


Research Methodology
Mordor Intelligence follows a four-step methodology in all our reports.
- Step-1: Identify Key Variables: In order to build a robust forecasting methodology, the variables and factors identified in Step-1 are tested against available historical market numbers. Through an iterative process, the variables required for market forecast are set and the model is built on the basis of these variables.
- Step-2: Build a Market Model: Market-size estimations for the forecast years are in nominal terms. Inflation is considered to be a part of the pricing, and the average selling price (ASP) is varying throughout the forecast period for each country
- Step-3: Validate and Finalize: In this important step, all market numbers, variables and analyst calls are validated through an extensive network of primary research experts from the market studied. The respondents are selected across levels and functions to generate a holistic picture of the market studied.
- Step-4: Research Outputs: Syndicated Reports, Custom Consulting Assignments, Databases & Subscription Platforms


