
United States Sea Freight Forwarding Market Size and Share
Market Overview
| Study Period | 2020 - 2031 |
|---|---|
| Forecast Data Period | 2026 - 2031 |
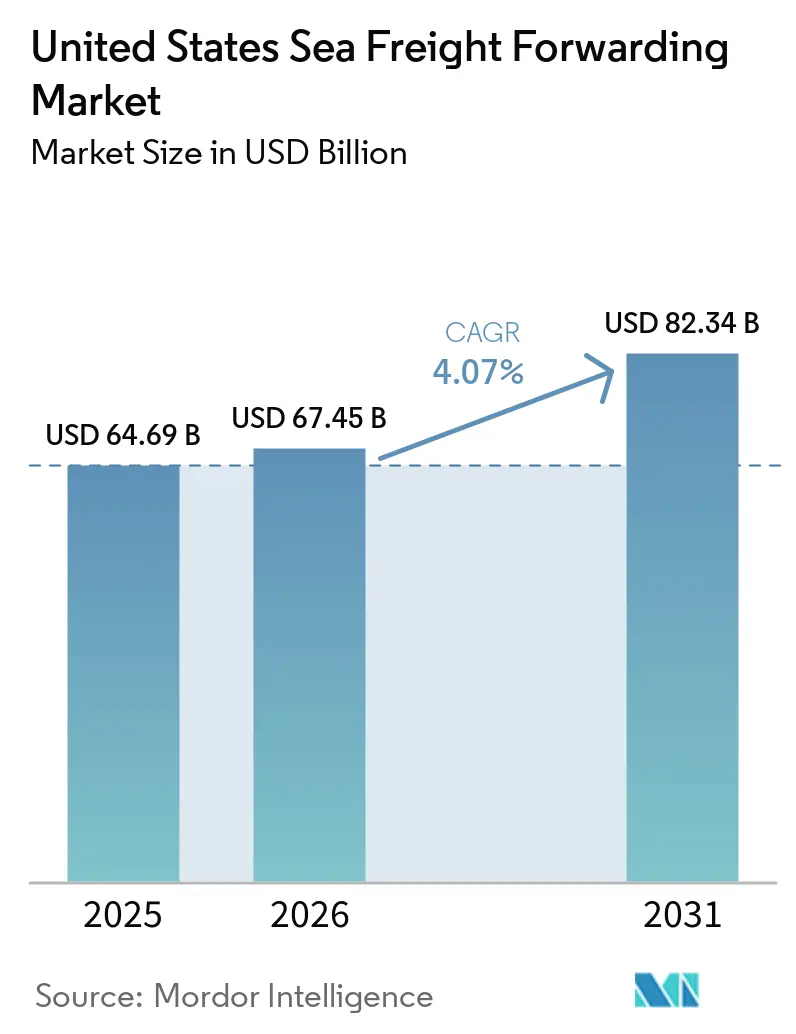
| Base Year Market Size (2025) | USD 64.69 Billion |
| Market Size (2026) | USD 67.45 Billion |
| Market Size (2031) | USD 82.34 Billion |
| Growth Rate (2026 - 2031) | 4.07 % |
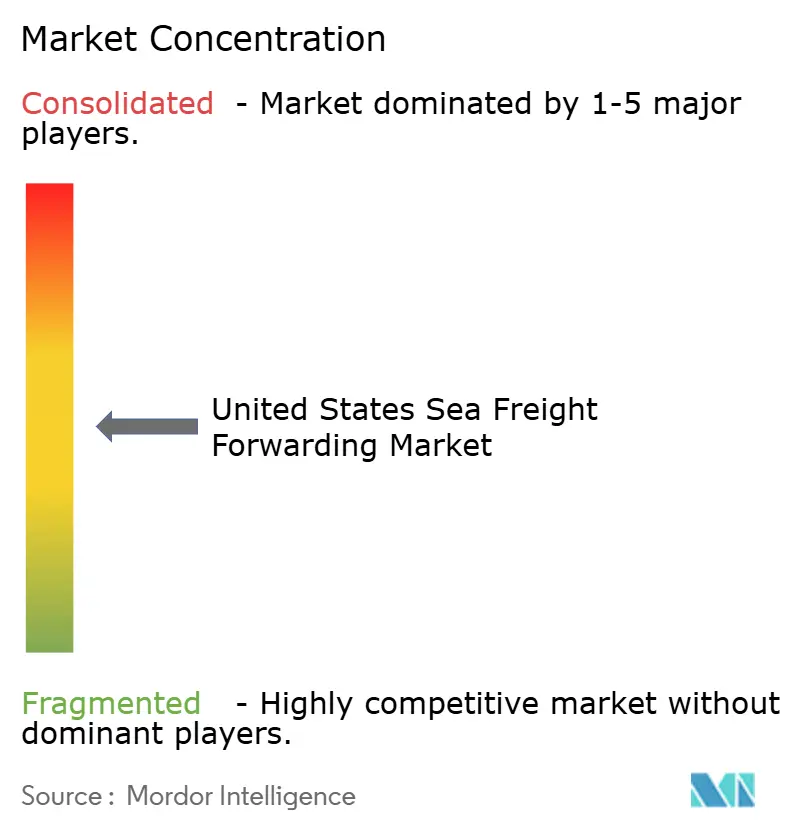
| Market Concentration | Medium |
Major Players *Disclaimer: Major Players sorted in no particular order Image © Mordor Intelligence. Reuse requires attribution under CC BY 4.0. | |
United States Sea Freight Forwarding Market Analysis by Mordor Intelligence
The United States sea freight forwarding market size is projected to expand from USD 64.69 billion in 2025 and USD 67.45 billion in 2026 to USD 82.34 billion by 2031, registering a CAGR of 4.07% between 2026 and 2031.
Persistent demand for Asia-origin imports, gradual port automation, and a growing preference for flexible shipping options underpin the expansion. Forwarders that provide digital self-service tools and multi-gateway routing capture incremental volumes as shippers seek visibility and resilience. Rising interest in cold-chain solutions for pharmaceuticals and perishables widens margin opportunities, while high bunker-fuel prices and labor-linked surcharges compress yields for operators with limited cost-pass-through ability. The interplay of these factors keeps growth moderate yet steady across the United States sea freight forwarding market.[1]
Key Report Takeaways
- By service, full-container-load services accounted for 73.11% of the United States sea freight forwarding market share in 2025; less-than-container-load services are projected to expand at a 6.79% CAGR between 2026 and 2031.
- By cargo type, dry and general cargo accounted for 68.2% of the United States sea freight forwarding market size in 2025, while reefer cargo is advancing at a 7.98% CAGR to 2031.
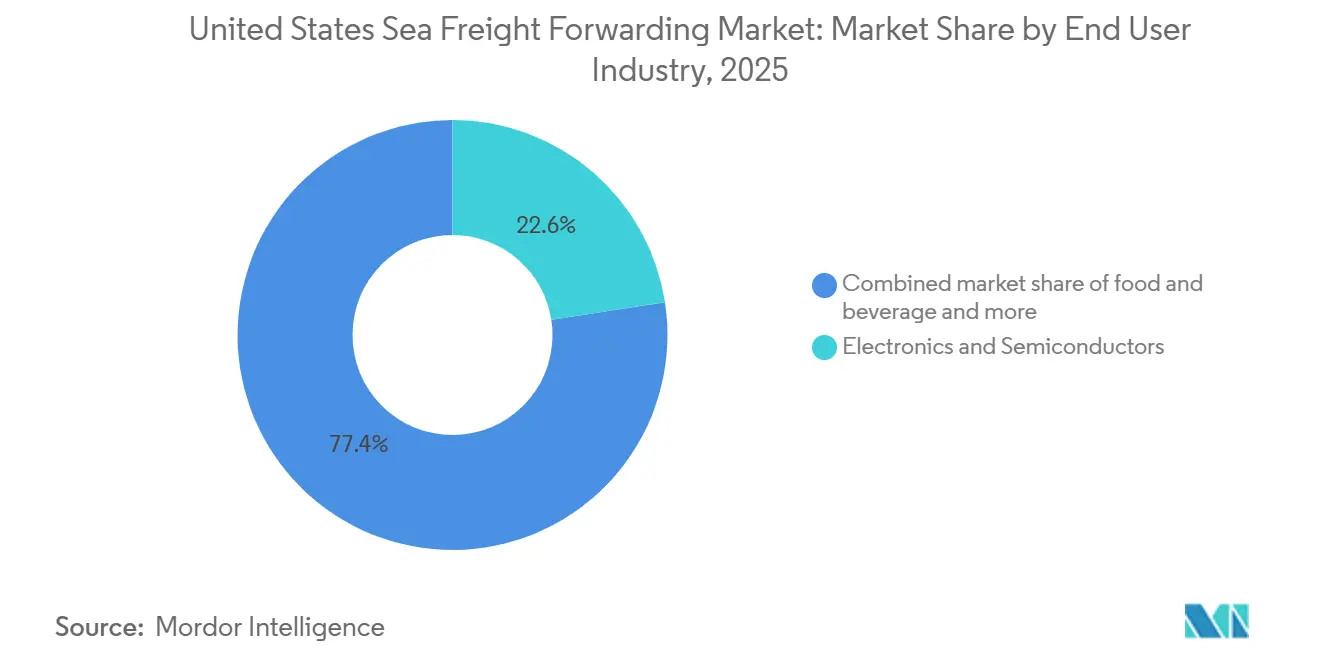
- By end user industry, electronics and semiconductors accounted for 22.56% of revenue in 2025; pharmaceuticals and healthcare is forecast to post an 8.61% CAGR through 2031.
- By region, the West accounted for 27.47% of revenue in 2025; the Southeast is the fastest-growing region, with a 6.25% CAGR forecast to 2031.
Note: Market size and forecast figures in this report are generated using Mordor Intelligence’s proprietary estimation framework, updated with the latest available data and insights as of January 2026.
United States Sea Freight Forwarding Market Trends and Insights
Drivers Impact Analysis*
| Drivers | (~) % Impact on CAGR Forecast | Geographic Relevance | Impact Timeline |
|---|---|---|---|
| Expansion of US Import Volumes from Asia | +1.2% | National, with a concentration in the West and Southeast coastal gateways | Medium term (2-4 years) |
| Improvements in Port Infrastructure and Automation Projects | +0.9% | Southeast, West, and Northeast port clusters | Long term (≥ 4 years) |
| Rising Adoption of Digital Freight Platforms | +0.7% | National, with early adoption in major metropolitan trade lanes | Short term (≤ 2 years) |
| E-Commerce Demand for Bulky Goods Logistics | +0.6% | National, with a pronounced impact in the Southeast and West regions | Medium term (2-4 years) |
| Shipper Preference for ESG-Certified Forwarders | +0.4% | National, with the strongest demand from Fortune 500 shippers in the Northeast and the West | Medium term (2-4 years) |
| Offshore-Wind Project-Cargo Opportunities (East Coast) | +0.3% | Southeast and Northeast coastal states, particularly Virginia, North Carolina, Massachusetts, and New York | Long term (≥ 4 years) |
| Source: Mordor Intelligence | |||
Expansion of US Import Volumes from Asia
Containerized imports from Asia keep the revenue engine running for the United States sea freight forwarding market. Cargo now skews toward semiconductors, medical devices, and electric-vehicle parts that tolerate premium rates for schedule reliability. Forwarders that diversify beyond the traditional Los Angeles-Long Beach complex to Savannah, Houston, and New York relieve congestion risk for customers. A multi-gateway strategy secures market share when labor or weather disrupts any single coast.
Improvements in Port Infrastructure and Automation Projects
Automated cranes and 24-hour gate operations reduce dwell times and lift terminal throughput. The Port of Savannah’s Garden City upgrade and Pier 400’s robotic handling in Los Angeles give forwarders with preferred slot access measurable velocity gains. The Infrastructure Investment and Jobs Act earmarks USD 17 billion to modernize waterways, but early movers reap benefits sooner, while competitors reliant on legacy facilities face longer truck turn times.
Rising Adoption of Digital Freight Platforms
Application programming interfaces connect shipper enterprise systems with forwarder booking tools, automating quotes, confirmations, and tracking. Routine FCL moves shift to online marketplaces, yet complex loads, such as hazardous chemicals or cold-chain pharmaceuticals, still require human oversight. Mid-tier players invest in proprietary platforms to retain customer intimacy and pricing power. The Federal Maritime Commission’s scrutiny of detention and demurrage is accelerating demand for systems that maintain audit trails.
E-Commerce Demand for Bulky-Goods Logistics
Furniture, appliances, and do-it-yourself products need ocean freight for cost efficiency but require deconsolidation and last-mile services once ashore. LCL consolidation hubs positioned near Gulf and East Coast ports shorten final-delivery miles. Predictive analytics optimize container loading, keeping LCL margins healthy even as average shipment sizes fall. This dynamic supports the 6.79% growth outlook for LCL services through 2031.
Restraints Impact Analysis*
| Restraints | (~) % Impact on CAGR Forecast | Geographic Relevance | Impact Timeline |
|---|---|---|---|
| Port Congestion and Labor Disruptions | -0.8% | West Coast ports, with spillover to the Gulf and East Coast during peak seasons | Short term (≤ 2 years) |
| Volatile Bunker-Fuel Prices | -0.5% | National, affecting all ocean freight lanes | Medium term (2-4 years) |
| Stricter IMO Environmental Regulations | -0.4% | National, with higher compliance costs on trans-Pacific and trans-Atlantic routes | Long term (≥ 4 years) |
| Limited US Marine-Insurance Capacity for High-Risk Cargo | -0.2% | National, with acute constraints for project cargo, hazardous materials, and high-value electronics | Medium term (2-4 years) |
| Source: Mordor Intelligence | |||
Port Congestion and Labor Disruptions
The 2024 strikes and the subsequent 61.5% wage increase embedded higher costs into every container that moves through East and Gulf Coast docks. Average truck dwell times at Los Angeles and Long Beach stabilized at under three days in late 2025, helping forwarders manage per-diem bills. Diversifying port calls helps mitigate future risk but adds complexity and reduces economies of scale. Shippers watch congestion metrics closely, rewarding partners that reroute quickly when bottlenecks emerge.[2]
Volatile Bunker-Fuel Prices
Marine fuel prices ranged from USD 400 to USD 650 per metric ton in 2025, driven by geopolitical shifts and refinery outages. Low-sulfur mandates under the International Maritime Organization’s 2020 rules keep the cost baseline elevated. Carriers slow-steam to conserve fuel, lengthening transit times and eroding the value proposition for time-sensitive cargo. Forwarders with hedging programs or indexed pass-through clauses fare better than smaller rivals that absorb sudden surcharges.[3]
*Our forecasts treat driver/restraint impacts as directional, not additive. The impact forecasts reflect baseline growth, mix effects, and variable interactions.
Segment Analysis
By Service: Consolidation Gains Share
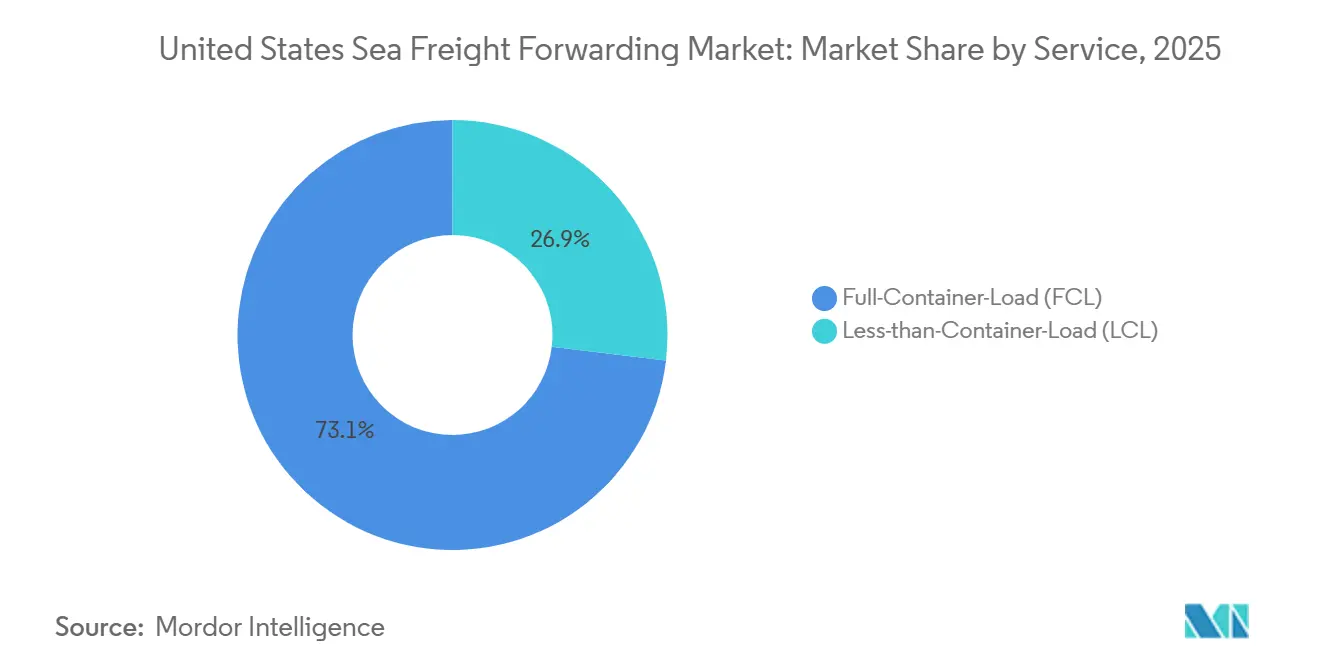
Full-container-load services accounted for 73.11% of revenue in the United States sea freight forwarding market in 2025. FCL dominates where predictable demand lets shippers fill a 40-foot box with electronics, machinery, or auto parts. Less-than-Container-Load services, while smaller, are climbing at a 6.79% CAGR, reflecting retail’s pivot to frequent, smaller replenishment cycles.
Forwarders that master LCL consolidation blend multiple shipper orders, lowering per-unit costs while capturing premium handling fees. Warehouse management systems link with transportation management systems to automate load planning and reduce errors. Successful providers also integrate customs brokerage and domestic trucking, offering a seamless door-to-door proposition for e-commerce sellers. Digital booking portals lower administrative workload, allowing staff to focus on exception management. The result is steady LCL margin expansion even as cargo pieces proliferate.

By Cargo Type: Reefer Segment Accelerates
Dry and general cargo made up 68.2% of the United States sea freight forwarding market size in 2025, spanning apparel to industrial machinery. Reefer cargo, however, is expanding at 7.98% a year as biopharmaceuticals, fresh produce, and frozen foods rely on temperature-controlled transit.
Reefer containers demand continuous monitoring, validated equipment, and compliance with Good Distribution Practice. Forwarders that deploy Internet of Things sensors and blockchain-based temperature logs provide shippers with end-to-end visibility. A single temperature excursion can spoil a USD 1 million vaccine consignment, so the value of reliability trumps price sensitivity. Meanwhile, dry-cargo operators optimize equipment repositioning to cut empty-box miles, preserving profitability. A balanced cargo mix helps diversified forwarders smooth revenue swings between high-margin reefer and high-volume dry commodities.
By End-User Industry: Pharma Outpaces Electronics
Electronics and semiconductors accounted for 22.56% of revenue in 2025, reflecting the United States appetite for consumer gadgets and data-center hardware. Pharmaceuticals and healthcare, although smaller, are on track for an 8.61% CAGR through 2031, the fastest within the United States sea freight forwarding market.
Biologic drugs, vaccines, and gene-therapy materials require validated cold-chain corridors, strict documentation, and staff trained in Food and Drug Administration regulations. Forwarders invest in GDP-certified processes, reefer fleets, and ISO 9001 quality systems to capture this premium demand. Chemical, food, and retail shippers remain volume anchors but face tighter margins due to competitive pressure. Specialized handling capabilities give pharma-focused operators a defensive moat against commoditization.
Geography Analysis
The West Coast commanded 27.47% revenue in 2025, thanks to the twin ports of Los Angeles and Long Beach, Oakland, and Seattle-Tacoma. Congestion, scarce expansion land, and labor volatility, however, are nudging shippers toward alternative gateways. The Southeast is projected to outpace the national growth rate with a 6.25% CAGR through 2031. Investments in Savannah, Charleston, and Jacksonville add berth depth, rail spurs, and yard automation, shortening cargo release times.
The Northeast, anchored by the Port of New York and New Jersey, benefits from direct access to the country's densest consumer corridor. Efficient double-stack rail services extend this reach into the Midwest, turning the interior into a derived-demand region for ocean freight. Houston and other Gulf ports serve the Southwest, handling petrochemical exports and project cargo for offshore wind farms scheduled along the Atlantic seaboard. Forwarders that maintain operations across all coasts provide shippers with the flexibility to reroute quickly when congestion or storms threaten any single region.
Regional diversification cushions the United States sea freight forwarding market against localized disruptions. Southeast and Gulf gateways expand capacity earlier than West Coast rivals, drawing discretionary cargo despite slightly longer ocean transits from Asia. Shippers increasingly prioritize predictability over minimal transport cost, a shift that benefits forwarders with granular real-time congestion data and the authority to shift bookings on short notice.[4]
Competitive Landscape
Competition in the United States sea freight forwarding market centers on digital capabilities, industry specialization, and carrier relationships rather than ship ownership. The top ten forwarders control roughly 40-50% of revenue, leaving space for regional specialists. Kuehne + Nagel, DHL Global Forwarding, and DSV leverage global contracts and enterprise technology to serve multinational importers, while Expeditors International and C.H. Robinson emphasize customized solutions for mid-sized shippers.
Mergers and acquisitions accelerate scale and unlock new vertical capabilities. DSV’s purchase of DB Schenker in 2025 created a powerhouse with stronger bargaining clout when bidding for carrier capacity. BDP International’s integration into PSA International bridges terminal operations with forwarding know-how, granting priority berth access that shortens dwell times. Digital-native entrant Flexport courts technology-savvy brands through an API-first model yet faces profitability pressure as it expands beyond early adopters.
Sustainability mandates move from rhetoric to tender requirements. Forwarders adopt carbon-calculation tools, develop offset programs, and advise clients on modal shifts that curb scope 3 emissions. Operators offering verified emissions reports and detention-billing transparency gain an edge as the Federal Maritime Commission cracks down on opaque surcharge practices. Investment in predictive analytics and robotic document processing separates leaders from laggards, especially when volatile fuel or labor costs force rapid rate recalculations.
United States Sea Freight Forwarding Industry Leaders
-
Kuehne + Nagel
-
DHL Global Forwarding
-
DSV (incl. DB Schenker)
-
Expeditors International
-
CMA CGM Group (Inclusing CEVA Logistics)
- *Disclaimer: Major Players sorted in no particular order
Recent Industry Developments
- April 2026: DSV announced that the ongoing integration of its DB Schenker acquisition had reached 45% completion by the end of the first quarter. The integration is rapidly reshaping the company's operational footprint, with operations now combined in over 50 countries.
- April 2026: Nippon Express Holdings finalized a CAD 1.8 billion (USD 1.3 billion) acquisition of Metro Supply Chain Group to rapidly scale its third-party logistics and distribution footprint. This strategic investment enhances the firm's end-to-end sea freight forwarding operations and cross-border supply chain integration throughout the United States market.
- February 2026: Hapag-Lloyd executed a definitive agreement to acquire ocean carrier ZIM, driving significant market consolidation and fleet optimization within the maritime logistics sector. This strategic buyout fundamentally restructures vessel capacity allocation and forwarder alliance networks servicing vital United States import-export trade lanes.
- November 2025: Maersk inaugurated a new ground freight station and linehaul operations hub in Georgia to optimize the efficiency of its regional distribution network. This strategic facility directly bolsters the company's end-to-end ocean freight routing and value-added supply chain capabilities across the Southeastern United States.
United States Sea Freight Forwarding Market Report Scope
| Full-Container-Load (FCL) |
| Less-than-Container-Load (LCL) |
| Dry/General |
| Reefer |
| Electronics and Semiconductors |
| Chemicals and Petrochemicals |
| Food and Beverage |
| Pharmaceuticals and Healthcare |
| Retail and E-commerce |
| Others |
| Northeast |
| Southeast |
| Midwest |
| Southwest |
| West |
| By Service | Full-Container-Load (FCL) |
| Less-than-Container-Load (LCL) | |
| By Cargo Type | Dry/General |
| Reefer | |
| By End User Industry | Electronics and Semiconductors |
| Chemicals and Petrochemicals | |
| Food and Beverage | |
| Pharmaceuticals and Healthcare | |
| Retail and E-commerce | |
| Others | |
| By Region | Northeast |
| Southeast | |
| Midwest | |
| Southwest | |
| West |
Key Questions Answered in the Report
How large is the United States sea freight forwarding market in 2026?
The United States sea freight forwarding market size stands at USD 67.45 billion in 2026.
Which service type is growing fastest in the United States sea forwarding?
Less-than-container-Load is the fastest, projected at a 6.79% CAGR to 2031.
Which cargo category adds the most value growth?
Reefer cargo, driven by the pharmaceutical cold chain, is advancing at a 7.98% CAGR through 2031.
Which region will outpace national growth?
The Southeast is forecast to grow at a 6.25% CAGR between 2026 and 2031.
What drives digital platform adoption among US forwarders?
Shippers demand real-time visibility and automated documentation, spurring API integration within booking tools.
How are bunker-fuel price swings managed?
Large forwarders use indexed fuel surcharges and hedging contracts, while smaller firms diversify carriers to limit exposure.