North America Cat Food Market Size and Share
Market Overview
| Study Period | 2018 - 2031 |
|---|---|
| Forecast Data Period | 2026 - 2031 |
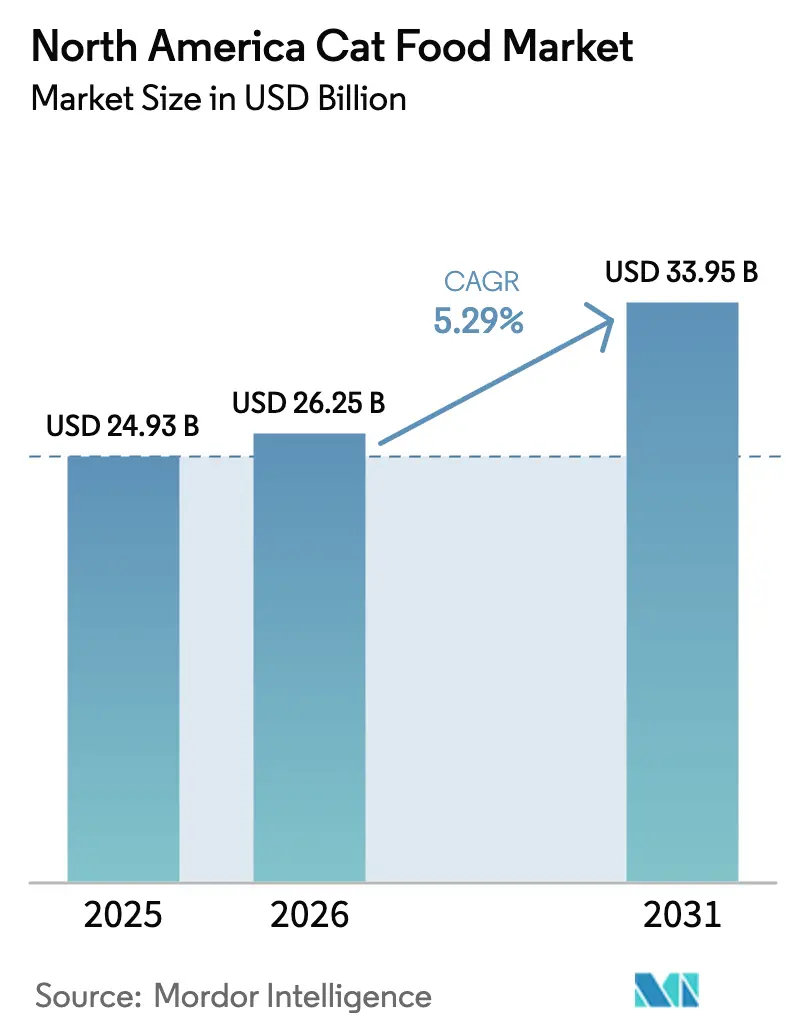
| Base Year Market Size (2025) | USD 24.93 Billion |
| Market Size (2026) | USD 26.25 Billion |
| Market Size (2031) | USD 33.95 Billion |
| Growth Rate (2026 - 2031) | 5.29% CAGR |
| Market Concentration | Low |
Major Players *Disclaimer: Major Players sorted in no particular order Image © Mordor Intelligence. Reuse requires attribution under CC BY 4.0. | |
North America Cat Food Market Analysis by Mordor Intelligence
The North America cat food market size was valued at USD 24.93 billion in 2025 and estimated to grow from USD 26.25 billion in 2026 to reach USD 33.95 billion by 2031, at a CAGR of 5.29% during the forecast period (2026-2031). Demand resilience stems from rising urban cat ownership, rapid adoption of e-commerce, and sustained efforts to premiumize products. Manufacturers are channeling digital investments toward supply-chain visibility and predictive analytics, which reduce out-of-stock incidents, strengthen retailer collaboration, and cut logistics costs. Functional ingredient momentum dovetails with human-grade positioning as consumers seek probiotic, omega-3, and low-glycemic recipes that mirror their own dietary ideals. Direct-to-consumer subscription platforms are compressing reorder cycles while harvesting shopper insights that guide innovation and targeted promotions. Sustainability initiatives, including the approval of insect protein, reflect the alignment of regulators and consumers on environmental stewardship, adding a fresh layer of product differentiation.
Key Report Takeaways
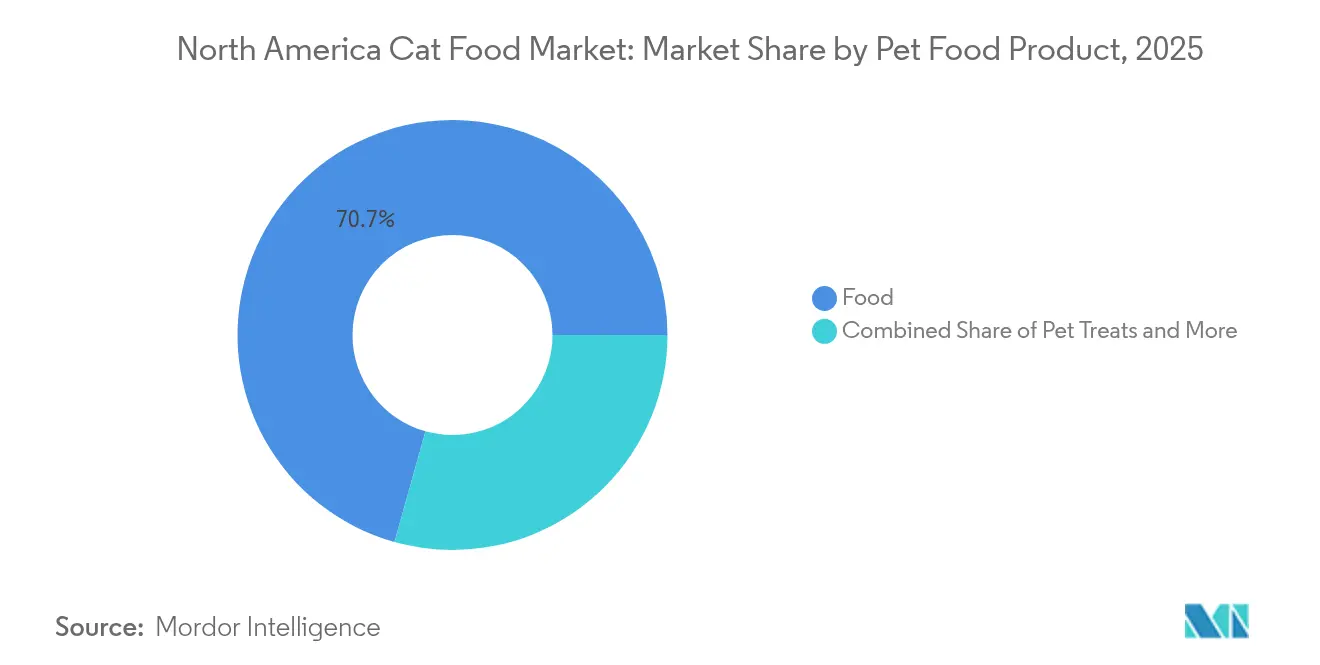
- By cat food product, food accounted for 70.65% of the North America cat food market share in 2025, while treats are forecast to expand at a 6.53% CAGR through 2031.
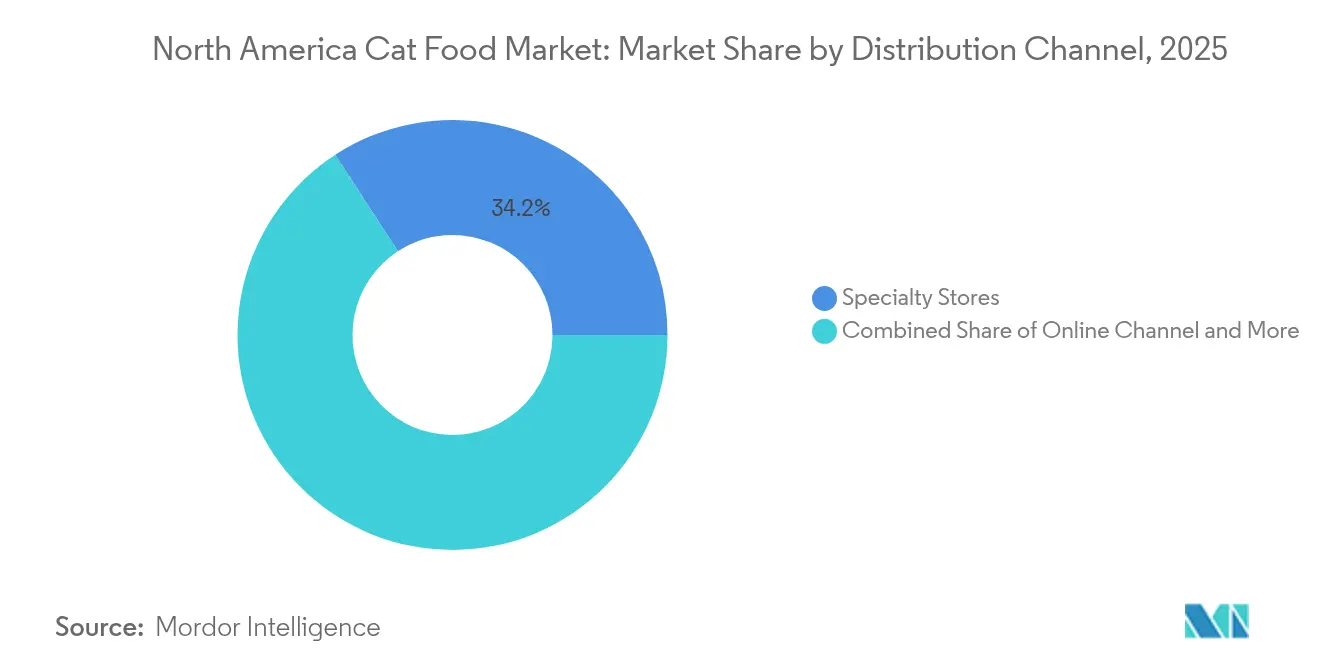
- By distribution channel, specialty stores held 34.18% of the North America cat food market share in 2025, while Online channels are projected to register a 7.12% CAGR to 2031.
- By geography, the United States commanded 87.90% revenue share in 2025, while Mexico is set to grow at a 5.35% CAGR through 2031.
- The top five players, including Mars, Incorporated, Nestle S.A. (Purina), Colgate-Palmolive Company (Hill's Pet Nutrition, Inc.), General Mills Inc., and Schell & Kampeter, Inc. (Diamond Pet Foods), controlled 31.2% of 2024 revenue, underscoring a fragmented environment that favors niche challengers.
Note: Market size and forecast figures in this report are generated using Mordor Intelligence’s proprietary estimation framework, updated with the latest available data and insights as of 2026.
North America Cat Food Market Trends and Insights
Drivers Impact Analysis*
| Driver | (~) % Impact on CAGR Forecast | Geographic Relevance | Impact Timeline |
|---|---|---|---|
| Surging Adoption of Companion Cats | +1.2% | North America, with the strongest gains in urban centers | Medium term (2-4 years) |
| Human-Grade and Functional Ingredient Demand | +0.9% | The United States and Canada, with limited Mexico penetration | Long term (≥ 4 years) |
| Proliferation of Direct-to-Consumer (D2C) Subscription Models | +0.7% | North America, concentrated in metropolitan areas | Short term (≤ 2 years) |
| Nutrigenomics-Driven Personalized Formulas | +0.4% | The United States and Canada, the veterinary channel focus | Long term (≥ 4 years) |
| Commercialization of Insect-Based Protein Diets | +0.3% | North America, pending broader regulatory acceptance | Long term (≥ 4 years) |
| AI-Enabled Inventory Forecasting Cuts Retail Out-of-Stock Rates | +0.2% | North America, major retailer adoption first | Medium term (2-4 years) |
| Source: Mordor Intelligence | |||


Surging Adoption of Companion Cats
Urban demographic shifts and evolving household structures are fundamentally reshaping pet ownership patterns across North America. Single-person households and apartment-dwelling millennials increasingly favor cats over dogs due to space constraints and lifestyle compatibility. The American Pet Products Association's 2024 survey reported a 3.2% increase in cat-owning households, with urban areas exhibiting the strongest adoption rates[1]Source: American Pet Products Association, “2024 Pet Industry Trends and Statistics,” americanpetproducts.org. This trend accelerates spending per cat as owners treat pets as family members, driving premiumization across all product categories. The demographic shift creates sustained demand for convenient, high-quality nutrition solutions that align with busy urban lifestyles.
Human-Grade and Functional Ingredient Demand
Consumer expectations for pet food now mirror human food trends, with clean-label formulations and functional ingredients becoming purchase drivers rather than differentiators. Hill's Pet Nutrition's 2024 clinical research demonstrated measurable improvements in metabolic markers for senior cats through targeted nutritional interventions, validating the science behind functional ingredient claims. Manufacturers are responding by incorporating probiotics, omega-3 fatty acids, and bioactive compounds that address specific health concerns. This trend extends beyond premium segments as mass-market brands introduce functional variants to capture health-conscious consumers willing to pay premiums for perceived nutritional benefits.
Proliferation of Direct-to-Consumer (D2C) Subscription Models
E-commerce penetration in the pet food industry has accelerated beyond convenience to become a strategic tool for customer acquisition and retention. Subscription models reduce purchase friction while generating predictable revenue streams and valuable consumer data for personalization. Freshpet's partnership with Petco for fresh food subscription services exemplifies that manufacturers are leveraging direct relationships to bypass traditional retail limitations. The model's success stems from its ability to optimize delivery frequency based on consumption patterns while introducing customers to higher-margin specialty products. This channel evolution pressures traditional retailers to enhance their digital capabilities and value propositions.
Nutrigenomics-Driven Personalized Formulas
Genetic testing and microbiome analysis are transitioning from research tools to commercial applications in companion animal nutrition. Royal Canin's veterinary-exclusive Genetic Health Analysis service now provides actionable dietary recommendations based on individual cat DNA profiles and health predispositions. The technology enables precision nutrition that addresses breed-specific sensitivities and metabolic requirements. While currently limited to veterinary channels, the approach creates differentiated value propositions that justify premium pricing and strengthen veterinarian-client relationships through science-based recommendations.
Restraints Impact Analysis*
| Restraint | (~) % Impact on CAGR Forecast | Geographic Relevance | Impact Timeline |
|---|---|---|---|
| Volatility in Meat and Grain Ingredient Prices | -0.8% | North America, with Mexico most vulnerable to currency fluctuations | Short term (≤ 2 years) |
| Stricter Labeling and Claims Regulations | -0.5% | The United States and Canada, with FDA (Food and Drug Administration) enforcement intensifying | Medium term (2-4 years) |
| Supply-Chain Bottlenecks for Novel Proteins | -0.3% | North America, affecting premium and specialty segments | Medium term (2-4 years) |
| Consumer Skepticism Toward Lab-Grown Meat Inclusion | -0.2% | United States and Canada, limited Mexico impact | Long term (≥ 4 years) |
| Source: Mordor Intelligence | |||
Volatility in Meat and Grain Ingredient Prices
Raw material cost fluctuations continue to pressure manufacturer margins and retail pricing stability across the North America cat food market. Chicken meal and fish meal prices experienced 15-20% volatility in 2024, driven by global supply disruptions and currency fluctuations that affected imported ingredients [2]Source: USDA Economic Research Service, “Livestock, Dairy, and Poultry Outlook,” ers.usda.gov. Grain ingredient costs remain elevated due to weather-related variations in crop yields and increased export demand from international markets. Manufacturers are implementing ingredient diversification strategies and forward contracting to mitigate price risk, though these measures limit formulation flexibility and increase working capital requirements. The volatility particularly impacts smaller manufacturers with limited purchasing power and financial resources to weather cost spikes.
Stricter Labeling and Claims Regulations
Regulatory compliance costs are escalating as FDA (Food and Drug Administration) enforcement priorities emphasize substantiation of nutritional and health claims in pet food marketing. The FDA's updated guidance on AAFCO (Association of American Feed Control Officials) defined ingredients requires enhanced documentation for novel components and functional additives. Manufacturers must invest in clinical studies and regulatory expertise to support product claims, creating barriers for smaller companies while favoring established players with regulatory resources. The regulatory environment particularly affects functional ingredient claims and premium positioning strategies that rely on health benefit messaging to justify price premiums.
*Our forecasts treat driver/restraint impacts as directional, not additive. The impact forecasts reflect baseline growth, mix effects, and variable interactions.
Segment Analysis
By Cat Food Product: Treats Drive Innovation Beyond Core Nutrition
Food products maintain a commanding market leadership position with a 70.65% share in 2025, reflecting their essential role in daily feline nutrition and the segment's maturity across all price points. Manufacturers are focusing on developing specialized formulations that cater to different life stages, breed sizes, and specific health conditions. The segment's growth is further supported by the increasing trend of pet humanization, where owners are willing to spend more on high-quality cat food products for their cats. Additionally, the availability of various options through multiple distribution channels, including specialty stores, supermarkets, and online platforms, has made cat food more accessible to pet owners across the region.
Treats emerge as the fastest-growing segment, with a 6.53% CAGR through 2031, driven by humanization trends and functional positioning that extends beyond basic rewards. The pet treats and pet nutraceuticals/supplements segments play vital roles in the North American cat food market. The treats segment offers a variety of options, including dental treats, freeze-dried treats, and soft chews, catering to different preferences and providing functional benefits. Freeze-dried and jerky treats are experiencing particularly strong growth as premium alternatives to traditional baked options, while dental treats are gaining traction through veterinary channel recommendations.


By Distribution Channel: Specialty Stores Defend Against Digital Disruption
Specialty stores are projected to command a 34.18% market share in 2025, owing to expert consultation and premium product curation that mass retailers cannot replicate. These channels excel at introducing novel products and educating consumers about functional ingredients, creating value beyond mere transaction processing. Independent pet retailers leverage personal relationships and specialized knowledge to maintain customer loyalty despite the pressures of online pricing. Specialty stores have also adapted to changing consumer preferences by introducing innovative products such as grain-free options, novel protein sources, and organic varieties, while maintaining strong relationships with veterinarians and pet nutritionists to provide informed recommendations to pet owners.
Online channels are the fastest-growing distribution channel, with a 7.12% CAGR through 2031, driven by the proliferation of subscription models and direct-to-consumer brand strategies. The channel's growth extends beyond convenience to encompass personalized recommendations and auto-replenishment services that reduce purchase friction. Major online retailers, such as Chewy, Amazon, and Walmart, have strengthened their positions by offering subscription-based services, automated delivery options, and exclusive online-only products.
Geography Analysis
The United States dominates the North American cat food market, with an 87.90% revenue share in 2025, reflecting its large cat population, high per-pet spending levels, and mature distribution infrastructure. The market benefits from strong veterinary channel penetration and consumer willingness to pay premiums for specialized nutrition solutions. Premium segment growth accelerates in metropolitan areas where disposable income levels support the adoption of functional ingredients and the uptake of subscription services.
Canada represents a stable secondary market with growth patterns closely aligned with those of the United States, although with a greater emphasis on natural and organic positioning that reflects broader Canadian consumer preferences. The market shows particular strength in premium dry food segments and veterinary diets distributed through independent specialty retailers. Currency fluctuations against the US dollar periodically impact import costs for ingredients and finished products, creating pricing pressures that manufacturers manage through local sourcing initiatives, where feasible.
Mexico emerges as the fastest-growing geography, with a 5.35% CAGR through 2031, driven by urbanization trends and rising middle-class pet ownership rates. The market remains price-sensitive with mass-market segments dominating volume, though premium categories are gaining traction in major metropolitan areas. Distribution infrastructure development lags more mature markets, creating opportunities for manufacturers who can establish effective route-to-market strategies. Local manufacturing capacity remains limited, making the market dependent on imports and vulnerable to currency and trade policy fluctuations.
Competitive Landscape
Consolidated Market Led By Global Players
The top five players, including Mars, Incorporated, Nestle S.A. (Purina), Colgate-Palmolive Company (Hill's Pet Nutrition, Inc.), General Mills Inc., and Schell & Kampeter, Inc. (Diamond Pet Foods), controlled 31.2% of 2024 revenue, underscoring a fragmented environment that favors niche challengers. These market leaders leverage their extensive research and development capabilities, established distribution networks, and strong brand recognition to maintain their market positions. The competitive landscape is primarily shaped by large conglomerates that have established their presence over decades of operation and strategic acquisitions, while smaller specialists focus on niche segments, such as premium natural products and specialized dietary solutions.
The market has witnessed significant merger and acquisition activity as major players seek to strengthen their market position and expand their product offerings. Large companies are particularly interested in acquiring smaller, innovative brands that have established themselves in premium and specialized segments. This consolidation trend is driven by the need to access new technologies, expand geographic presence, and capitalize on emerging consumer trends in natural and premium pet food segments.
Technology adoption patterns reveal strategic differentiation opportunities as established players invest in AI-powered demand forecasting and supply chain optimization while emerging brands focus on direct-to-consumer engagement and personalized nutrition platforms. In 2024, Mars Incorporated's USD 1 billion digital transformation investment exemplifies how market leaders are leveraging technology to defend market position through operational efficiency gains[3]Source: Mars Incorporated, “Mars Invests USD 1 Billion in Digital Transformation and AI Capabilities,” mars.com.
North America Cat Food Industry Leaders
Mars, Incorporated
Colgate-Palmolive Company (Hill's Pet Nutrition, Inc.)
General Mills Inc.
Schell & Kampeter, Inc. (Diamond Pet Foods)
Nestle S.A. (Purina)
- *Disclaimer: Major Players sorted in no particular order

Recent Industry Developments
- November 2024: General Mills acquired Whitebridge Pet Brands for USD 1.45 billion to strengthen its Blue Buffalo cat food portfolio and expand manufacturing capacity in premium segments, particularly wet food formulations.
- June 2023: Mars Incorporated launched its premium cat brand SHEBA in Canada, offering cat parents wet formulas through its SHEBA BISTRO line.
- May 2023: Nestle Purina launched new cat treats under the Friskies "Friskies Playfuls - treats" brand. These treats are round in shape and are available in chicken and liver and salmon and shrimp flavors for adult cats.


North America Cat Food Market Report Scope
Food, Pet Nutraceuticals/Supplements, Pet Treats, and Pet Veterinary Diets are covered as segments by Pet Food Product. Convenience Stores, Online Channel, Specialty Stores, and Supermarkets/Hypermarkets are covered as segments by the Distribution Channel. Canada, Mexico, United States are covered as segments by Country.
| Food | By Sub Product | Dry Pet Food | By Sub Dry Pet Food | Kibbles |
| Other Dry Pet Food | ||||
| Wet Pet Food | ||||
| Pet Nutraceuticals/Supplements | By Sub Product | Milk Bioactives | ||
| Omega-3 Fatty Acids | ||||
| Probiotics | ||||
| Proteins and Peptides | ||||
| Vitamins and Minerals | ||||
| Other Nutraceuticals | ||||
| Pet Treats | By Sub Product | Crunchy Treats | ||
| Dental Treats | ||||
| Freeze-dried and Jerky Treats | ||||
| Soft & Chewy Treats | ||||
| Other Treats | ||||
| Pet Veterinary Diets | By Sub Product | Diabetes | ||
| Digestive Sensitivity | ||||
| Oral Care Diets | ||||
| Renal | ||||
| Urinary tract disease | ||||
| Obesity Diets | ||||
| Derma Diets | ||||
| Other Veterinary Diets |
| Convenience Stores |
| Online Channel |
| Specialty Stores |
| Supermarkets/Hypermarkets |
| Other Channels |
| Pet Food Product | Food | By Sub Product | Dry Pet Food | By Sub Dry Pet Food | Kibbles |
| Other Dry Pet Food | |||||
| Wet Pet Food | |||||
| Pet Nutraceuticals/Supplements | By Sub Product | Milk Bioactives | |||
| Omega-3 Fatty Acids | |||||
| Probiotics | |||||
| Proteins and Peptides | |||||
| Vitamins and Minerals | |||||
| Other Nutraceuticals | |||||
| Pet Treats | By Sub Product | Crunchy Treats | |||
| Dental Treats | |||||
| Freeze-dried and Jerky Treats | |||||
| Soft & Chewy Treats | |||||
| Other Treats | |||||
| Pet Veterinary Diets | By Sub Product | Diabetes | |||
| Digestive Sensitivity | |||||
| Oral Care Diets | |||||
| Renal | |||||
| Urinary tract disease | |||||
| Obesity Diets | |||||
| Derma Diets | |||||
| Other Veterinary Diets | |||||
| Distribution Channel | Convenience Stores | ||||
| Online Channel | |||||
| Specialty Stores | |||||
| Supermarkets/Hypermarkets | |||||
| Other Channels | |||||


Market Definition
- FUNCTIONS - Pet foods are usually intended to provide complete and balanced nutrition to the pet but are primarily used as functional products. The scope includes the food and supplements consumed by pets including veterinary diets. Supplements/nutraceuticals that are directly supplied to pets are considered within the scope.
- RESELLERS - Companies engaged in reselling of pet food without value addition have been excluded from the market scope, in order to avoid double counting.
- END CONSUMERS - Pet owners are considered to be the end-consumers in the market studied.
- DISTRIBUTION CHANNELS - Supermarkets/hypermarkets, specialty stores, convenience stores, online channels and other channels are considered within the scope. The stores which are exclusively providing pet related basic and custom products are considered within the scope of specialty stores.
| Keyword | Definition |
|---|---|
| Pet Food | The scope of pet food includes the food that is eatable by pets including food, treats, veterinary diets, and nutraceuticals/supplements. |
| Food | Food is animal feed intended for consumption by pets. It is formulated to provide essential nutrients and meet the dietary needs of various types of pets, including dogs, cats, and other animals. These are generally segmented into dry and wet pet foods. |
| Dry Pet Food | Dry pet foods may be extruded/baked (kibbles) or flaked. They have a lower moisture content, typically around 12-20%. |
| Wet Pet Food | Wet pet food, also known as canned pet food or moist pet food, generally has a higher moisture content compared to dry pet food, often ranging from 70-80%. |
| Kibbles | Kibbles are dry, processed pet food in small, bite-sized pieces or pellets. They are specifically formulated to provide balanced nutrition for various domestic animals, such as dogs, cats, and other animals. |
| Treats | Pet Treats are special food items or rewards given to pets, to show affection, and encourage good behavior. They are especially used during training. Pet treats are made from various combinations of meat or meat-derived materials with other ingredients. |
| Dental Treats | Pet dental treats are specialized treats that are formulated to promote good oral hygiene in pets. |
| Crunchy Treats | It is a type of pet treat that has a firm and crispy texture which can be a good source of nutrition for pets. |
| Soft and chewy treats | Soft and Chewy pet treats are a type of pet food product that is formulated to be easy to chewy and digest. They are usually made from soft and pliable ingredients, such as meat, poultry, or vegetables, that have been blended and formed into bite-sized pieces or strips. |
| Freeze-dried & Jerky Treats | Freeze-dried and jerky treats are snacks given to pets, that are prepared through a special preservation process, without damaging the nutritional content, resulting in long-lasting, nutrient-rich treats. |
| Urinary Tract Disease Diets | These are commercial diets that are specifically formulated to promote urinary health and reduce the risk of urinary tract infections and other urinary problems. |
| Renal Diets | These are specialized pet foods formulated to support the health of pets with kidney disease or renal insufficiency. |
| Digestive Sensitivity Diets | Digestive-sensitive diets are specially formulated to meet the nutritional needs of pets with digestive issues such as food intolerances, allergies, and sensitivities. These diets are designed to be easily digestible and to reduce the symptoms of digestive problems in pets. |
| Oral Care Diets | Oral care diets for pets are specially formulated diets produced to promote oral health and hygiene in pets. |
| Grain-Free Pet Food | Pet food that does not contain common grains like wheat, corn, or soy. Grain-free diets are often preferred by pet owners seeking alternative options or if their pets have specific dietary sensitivities. |
| Premium Pet Food | High-quality pet food formulated with superior ingredients often offers additional nutritional benefits compared to standard pet food. |
| Natural Pet Food | Pet food made from natural ingredients, with minimal processing and without artificial preservatives. |
| Organic Pet Food | Pet food is produced using organic ingredients, free from synthetic pesticides, hormones, and genetically modified organisms (GMOs). |
| Extrusion | A manufacturing process used to produce dry pet food, where ingredients are cooked, mixed, and shaped under high pressure and temperature. |
| Other Pets | Other pets include birds, fish, rabbits, hamsters, ferrets, and reptiles. |
| Palatability | The taste, texture, and aroma of pet food influence its appeal and acceptance by pets. |
| Complete and Balanced Pet Food | Pet food that provides all essential nutrients in appropriate proportions to meet the nutritional needs of pets without additional supplementation. |
| Preservatives | These are the substances that are added to pet food to extend its shelf life and prevent spoilage. |
| Nutraceuticals | Food products that offer health benefits beyond basic nutrition, often contain bioactive compounds with potential therapeutic effects. |
| Probiotics | Live beneficial bacteria that promote a healthy balance of gut flora, supporting digestive health and immune function in pets. |
| Antioxidants | Compounds that help neutralize harmful free radicals in the body, promoting cellular health and supporting the immune system in pets. |
| Shelf-Life | The duration of which pet food remains safe and nutritionally viable for consumption after its production date. |
| Prescription diet | Specialized pet food formulated to address specific medical conditions under veterinary supervision. |
| Allergen | A substance that can cause allergic reactions in some pets, leading to food allergies or sensitivities. |
| Canned food | Wet pet food that is packed in cans and contains higher moisture content than dry food. |
| Limited ingredient diet (LID) | Pet food formulated with a reduced number of ingredients to minimize potential allergens. |
| Guaranteed Analysis | The minimum or maximum levels of certain nutrients present in pet food. |
| Weight management | Pet food designed to help pets maintain a healthy weight or support weight loss efforts. |
| Other Nutraceuticals | It includes prebiotics, antioxidants, digestive fiber, enzymes, essential oils and herbs. |
| Other Veterinary Diets | It includes weight management diets, skin and coat health, cardiac care, and joint care. |
| Other Treats | It includes rawhides, mineral blocks, lickables, and catnips. |
| Other Dry Foods | It includes cereal flakes, mixers, meal toppers, freeze-dried foods, and air-dried foods. |
| Other Animals | It includes birds, fish, reptiles, and small animals (rabbits, ferrets, hamsters). |
| Other Distribution Channels | It includes veterinary clinics, local unregulated stores, and feed and farm stores. |
| Proteins and Peptides | Proteins are large molecules composed of basic units called amino acids which help in the growth and development of pets. Peptides are the short string of 2 to 50 amino acids. |
| Omega-3 fatty acids | Omega-3 fatty acids are essential polyunsaturated fats that play a crucial role in the overall health and well-being of Pets |
| Vitamins | Vitamins are the essential organic compounds that are essential for vital physiological functioning. |
| Minerals | Minerals are naturally occurring inorganic substances that are essential for various physiological functions in pets. |
| CKD | Chronic Kidney Disease |
| DHA | Docosahexaenoic Acid |
| EPA | Eicosapentaenoic Acid |
| ALA | Alpha-linolenic Acid |
| BHA | Butylated Hydroxyanisol |
| BHT | Butylated Hydroxytoluene |
| FLUTD | Feline Lower Urinary Tract Disease |


Research Methodology
Mordor Intelligence follows a four-step methodology in all our reports.
- Step-1: IDENTIFY KEY VARIABLES: In order to build a robust forecasting methodology, the variables and factors identified in Step-1 are tested against available historical market numbers. Through an iterative process, the variables required for market forecast are set and the model is built on the basis of these variables.
- Step-2: Build a Market Model: Market-size estimations for the forecast years are in nominal terms. Inflation is not a part of the pricing, and the average selling price (ASP) is kept constant throughout the forecast period.
- Step-3: Validate and Finalize: In this important step, all market numbers, variables and analyst calls are validated through an extensive network of primary research experts from the market studied. The respondents are selected across levels and functions to generate a holistic picture of the market studied.
- Step-4: Research Outputs: Syndicated Reports, Custom Consulting Assignments, Databases & Subscription Platforms


