United States And Europe Reusable Plastic Returnable Transport Packaging Market Size and Share
Market Overview
| Study Period | 2020 - 2031 |
|---|---|
| Forecast Data Period | 2026 - 2031 |
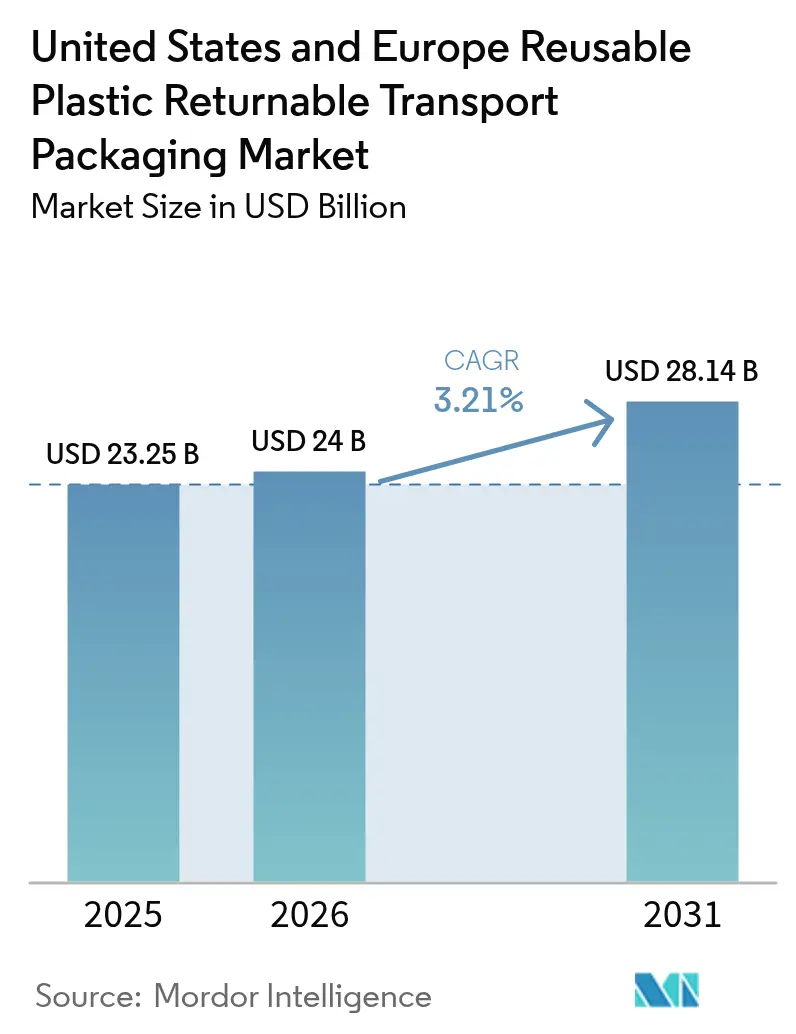
| Base Year Market Size (2025) | USD 23.25 Billion |
| Market Size (2026) | USD 24 Billion |
| Market Size (2031) | USD 28.14 Billion |
| Growth Rate (2026 - 2031) | 3.21% CAGR |
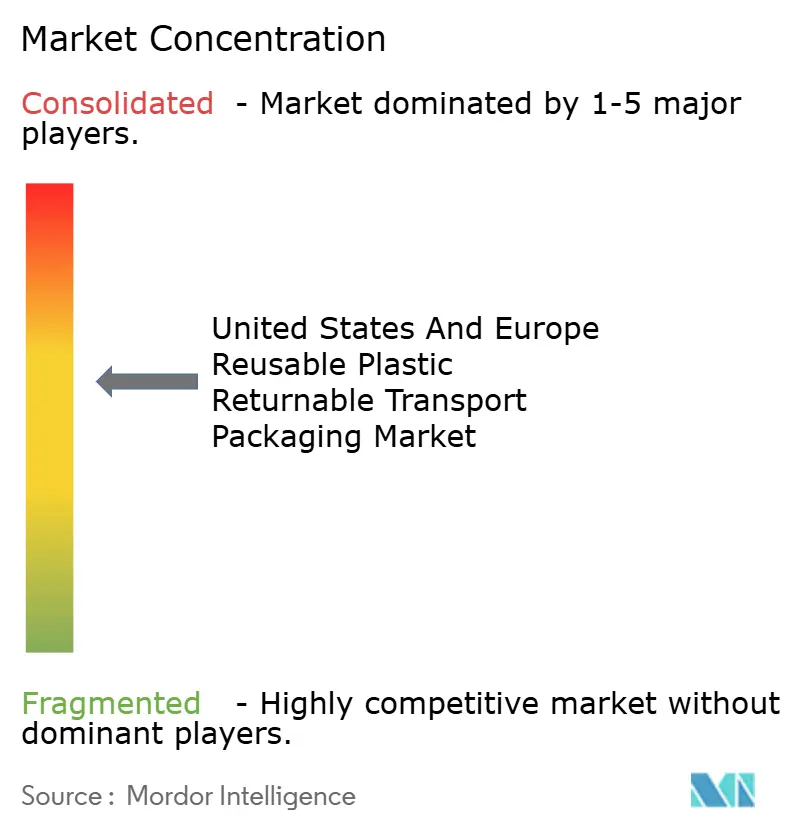
| Market Concentration | Medium |
Major Players *Disclaimer: Major Players sorted in no particular order Image © Mordor Intelligence. Reuse requires attribution under CC BY 4.0. | |
United States And Europe Reusable Plastic Returnable Transport Packaging Market Analysis by Mordor Intelligence
United States and Europe reusable plastic returnable transport packaging market size in 2026 is estimated at USD 24 billion, growing from 2025 value of USD 23.25 billion with 2031 projections showing USD 28.14 billion, growing at 3.21% CAGR over 2026-2031. Midsized cost-efficient cycles, expanding circular-economy rules, and ESG-linked financing programs keep adoption on an upward trajectory. Warehouse and distribution-center automation pushes standardization, while AI-enabled asset tracking lowers shrinkage rates to below 2%, reinforcing the financial logic of reuse. E-grocery penetration, scope-3-emission reporting, and pooled rental platforms combine to create steady demand for containers that last 50 or more trips. Fiber-based single-use innovations and labor tightness in reverse logistics temper momentum but have yet to slow the sector’s structural shift toward repeat-use systems.
Key Report Takeaways
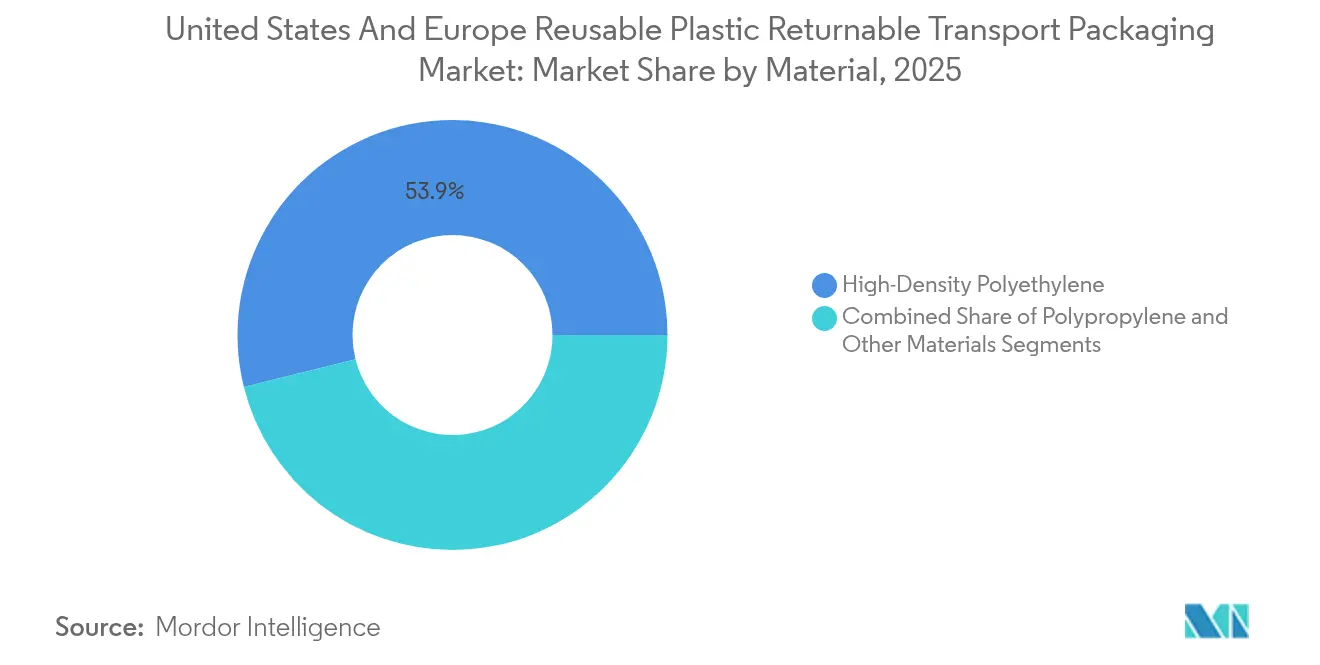
- By material, high-density polyethylene captured 53.88% of reusable plastic returnable transport packaging market share in 2025, while polypropylene logged the fastest 4.23% CAGR through 2031.
- By product type, pallets led with 37.74% revenue share in 2025, whereas intermediate bulk containers are expanding at a 4.66% CAGR to 2031.
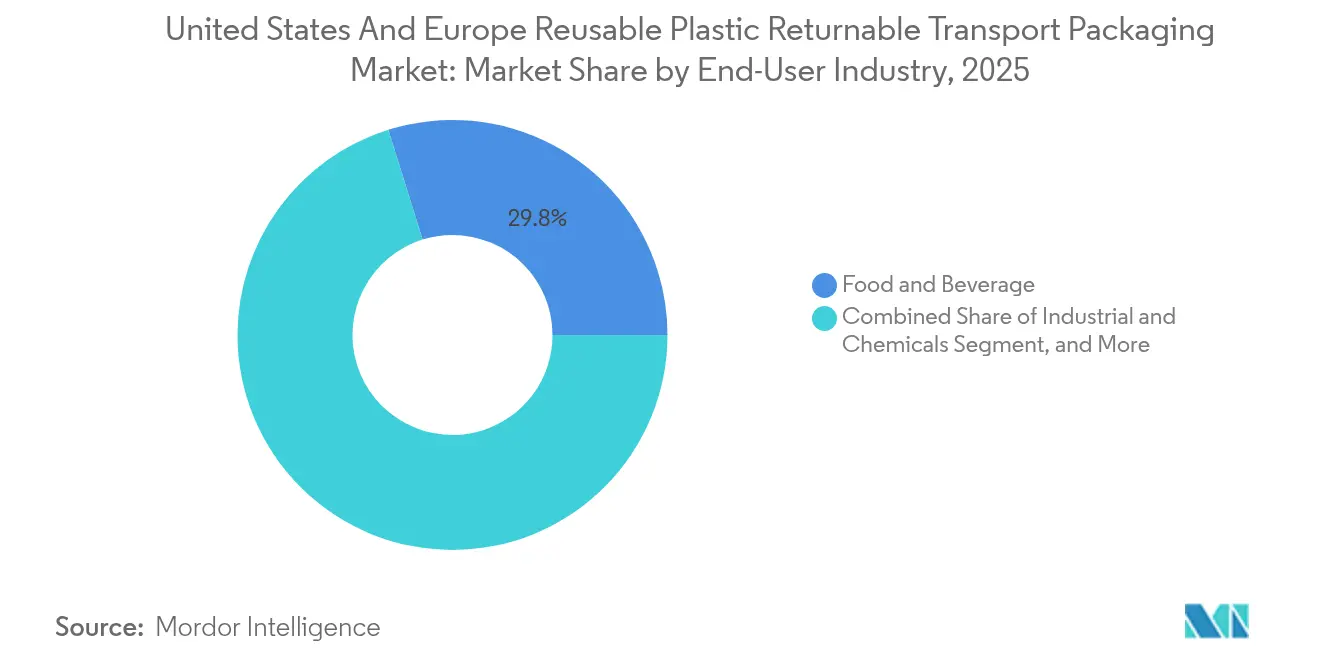
- By end-user industry, food and beverage held 29.83% of the reusable plastic returnable transport packaging market size in 2025, and industrial and chemicals are advancing at a 4.88% CAGR through 2031.
- By distribution model, pooled rental platforms controlled 61.74% share in 2025 and are on course for a 4.08% CAGR through 2031.
- By geography, the United States commanded 50.87% market share in 2025, while Spain is projected to grow at a 5.11% CAGR to 2031.
Note: Market size and forecast figures in this report are generated using Mordor Intelligence’s proprietary estimation framework, updated with the latest available data and insights as of 2026.
United States And Europe Reusable Plastic Returnable Transport Packaging Market Trends and Insights
Drivers Impact Analysis*
| Driver | (~) % Impact on CAGR Forecast | Geographic Relevance | Impact Timeline |
|---|---|---|---|
| Favourable governmental regulations on circular packaging | +0.8% | Global, with early gains in EU, California, Canada | Medium term (2-4 years) |
| Warehouse and DC automation accelerating RTP uptake | +0.6% | North America and EU core markets | Short term (≤ 2 years) |
| E-grocery and meal-kit boom driving crate demand | +0.5% | Global urban centers, APAC spill-over | Short term (≤ 2 years) |
| ESG-linked retailer financing programmes | +0.4% | North America and EU, expanding to APAC | Medium term (2-4 years) |
| AI-enabled asset-tracking reduces shrinkage | +0.3% | Global deployment by major pooling operators | Short term (≤ 2 years) |
| Scope-3-emission disclosure mandates | +0.2% | Global, led by SEC and EU taxonomy requirements | Long term (≥ 4 years) |
| Source: Mordor Intelligence | |||
Favorable Governmental Regulations on Circular Packaging
Royal Decree 1055/2022 in Spain imposes a EUR 0.45 per kilogram (USD 0.50 per kilogram) tax on non-reusable plastic and mandates 65% reuse by 2030, prompting rapid container conversion. California’s Senate Bill 54 requires a 25% cut in single-use formats by 2032, influencing procurement across the state’s USD 3.6 trillion economy. The EU Packaging and Packaging Waste Regulation sets a 10% reuse goal for transport packaging by 2030, reinforcing investments by multinational shippers. Federal procurement rules under the U.S. Environmental Protection Agency now prioritize reusable options, expanding demand from public-sector contractors. Collectively, these policies supply a durable tailwind for the reusable plastic returnable transport packaging market.
Warehouse and Distribution-Center Automation Accelerating RTP Uptake
Automated storage and retrieval systems prefer uniform containers with RFID tags, pushing enterprises toward reusable units. General Motors achieved a 23% drop in material-handling expense after standardizing containers across 15 plants in 2024. IEEE guidelines for IoT sensor installation in containers have lifted 98.5% asset visibility, enabling lights-out warehouse shifts. Multichannel fulfillment centers that ship 10,000 SKUs or more have reported 15-20% efficiency gains from reusable container use. Amazon fulfillment case work shows 40% higher robotic throughput with standardized totes, underscoring automation’s multiplier effect.
E-Grocery and Meal-Kit Boom Driving Crate Demand
Online grocery accounted for 12.3% of food retail in 2024, and meal-kit services continued 18% annual growth, raising the need for durable, temperature-controlled crates. IFCO containers recorded 40% stronger insulation versus corrugated boxes, with spoilage held under 1.2%. HelloFresh eliminated 2.3 million pounds of single-use packaging in 2024 and saved USD 0.85 per shipment through reusable insulation. Robotics-heavy grocery facilities such as Ocado report 99.2% order accuracy when relying on uniform reusable crates, illustrating how digital fulfillment and reuse are mutually reinforcing.
ESG-Linked Retailer Financing Programs
Sustainability-linked loans equal roughly 15% of corporate credit, and packaging waste metrics shape interest rates. Walmart’s Project Gigaton grants suppliers better financing for verifiable packaging reduction. BNP Paribas and Deutsche Bank now embed circular metrics in credit scoring, with reusable investments qualifying for EU green-taxonomy status. Unilever secured a 0.25-percentage-point rate discount on EUR 500 million (USD 560 million) of sustainability bonds by expanding reusable fleets in 2024. Lower capital cost accelerates fleet rollout, cementing the reusable plastic returnable transport packaging market’s growth loop.
Restraints Impact Analysis*
| Restraint | (~) % Impact on CAGR Forecast | Geographic Relevance | Impact Timeline |
|---|---|---|---|
| Stakeholder resistance to process change | -0.4% | Global, particularly in traditional manufacturing regions | Medium term (2-4 years) |
| Competition from fibre-based alternatives | -0.3% | North America and EU, expanding globally | Short term (≤ 2 years) |
| Reverse-logistics labour shortages | -0.2% | Global supply chain networks | Short term (≤ 2 years) |
| Antimicrobial compliance cost escalation | -0.1% | Global, with stricter requirements in food applications | Long term (≥ 4 years) |
| Source: Mordor Intelligence | |||
Stakeholder Resistance to Process Change
Switching to reusable systems requires cross-enterprise coordination, and plants often endure 8-12% temporary productivity dips during the 6-18-month ramp-up. Many warehouse-management solutions cannot natively track reusable pools, forcing costly upgrades. Small and midsized companies struggle with minimum-volume thresholds imposed by pooling operators. Training expenses further dampen adoption, as staff must learn inspection and return protocols unfamiliar in single-use workflows. Mid-tier automotive suppliers have spent USD 150,000-300,000 on warehouse retrofits and training for reusable rollouts, illustrating the transition hurdle
Competition from Fibre-Based Alternatives
Coated corrugated boxes and molded-fiber forms offer lower upfront costs for shipments that lack an easy return path. International Paper’s water-resistant coating provides moisture performance near that of plastic crates while remaining recyclable, attracting eco-conscious brands. Dell uses wheat-straw fiber packaging in electronics, avoiding costly reverse logistics. Cost models show corrugated units run 15-25% cheaper per trip when reuse cycles stay under eight, carving out niches where plastics cannot yet compete.
*Our forecasts treat driver/restraint impacts as directional, not additive. The impact forecasts reflect baseline growth, mix effects, and variable interactions.
Segment Analysis
By Material : HDPE Dominance Faces PP Innovation Push
HDPE accounts for 53.88% of the reusable plastic returnable transport packaging market. Its proven ruggedness across -40 °C to +60 °C keeps it the default for automotive and food logistics, even as price swings of 18% in 2024 triggered scrutiny of lifecycle cost spreads. Polypropylene claims the fastest 4.23% CAGR on the back of lightweighting and tight chemical-resistance needs. Ford cut container weight 23% by switching engine-part carriers to PP in 2024. Recycled-content mandates tilt in HDPE’s favor because established streams can meet 25-30% content without property loss, shielding users from virgin-resin volatility.
Second-order trends include rising clarity requirements for pharmaceutical lines that give polycarbonate a toehold. Silver-ion antimicrobial mandates lift resin costs by 15-20%, yet users accept premiums when food-contact rules tighten. Overall, material choice now weighs total-cost-per-trip, recyclability, and regulatory compliance rather than resin sticker price alone, ensuring HDPE retains leadership while PP builds share in high-performance niches.


By Product Type : Pallets Lead While IBCs Accelerate
Pallets supplied 37.74% of sector revenue in 2025 and remain the bedrock of fast-moving consumer goods flows. Standard footprint, automated handling compatibility, and global pooling coverage cement their dominant position. The reusable plastic returnable transport packaging market size tied to pallets will keep pace with industrial-production growth rather than outpace it, reflecting a near-saturation environment.
Intermediate bulk containers show the highest 4.66% CAGR as chemical and food-ingredient shippers abandon steel due to corrosion and weight. Dow Chemical trimmed container mass by 35% and saved EUR 1.8 million (USD 2.0 million) annually in 2024 after switching to plastic IBCs. UN performance tests and hazardous-goods mandates favor certified suppliers, raising barriers for late entrants but supporting premium pricing for incumbents. Totes and crates continue to benefit from e-commerce automation but remain subscale relative to pallets and IBCs.
By End-User : Food Dominance Meets Industrial Growth
Food and beverage logistics held 29.83% of 2025 revenue thanks to hygiene protocols that fit wash-and-reuse cycles. FDA-approved resin costs sit 12-15% above industrial grades, yet spoilage avoidance justifies the gap. Industrial and chemical clients log the sharpest 4.88% CAGR because hazardous-material rules require sealed, trackable containers. Specialty chemical makers have documented 25-30% cost cuts through reusable IBC uptake, underlining the value proposition.
Consumer-electronics and automotive lines lean on reusable racks for part protection inside robotic plants. Nestlé absorbed EUR 3.2 million (USD 3.6 million) extra HDPE cost in 2024 but offset it by extending container life and optimizing lanes. The mix points to a future where food maintains scale while industrial users supply incremental growth.
By Distribution Model : Pooled Rental Platforms Gain Ground
Pooled networks held 61.74% share in 2025, scaling at 4.08% CAGR. Network effects produce wider coverage, quicker availability, and thinner per-use cost curves, reinforcing leadership. IFCO’s 2024 Southeast Asia rollout of 12 depots shows the model’s transferability to high-growth regions. Captive ownership works best where lanes are closed and volumes predictable; BMW documented an 18% per-trip savings on captive automotive containers along fixed intra-EU routes. Even so, capital-light preferences among logistics managers suggest pooled fleets will keep expanding faster than company-owned stock.
Geography Analysis
The United States contributed 50.87% of global revenue in 2025, spring-boarding off mature pooling hubs and RFID-enabled warehousing that delivers 95% asset visibility. State-level extended producer responsibility laws, led by California Senate Bill 54, add regulatory urgency. Transport cost over long return legs can dilute savings, yet dense regional corridors on the East and West coasts mitigate this effect.
Spain posts the quickest 5.11% CAGR to 2031. Royal Decree 1055/2022 taxes non-reusable plastic and sets a 65% reuse target, causing a rapid pivot to pooled crates. IFCO’s new Barcelona hub and Carrefour’s EUR 8.3 million (USD 9.3 million) annual saving on fresh-produce crates confirm early-mover advantage. Spain is therefore the proving ground for stringent reuse mandates in practice.
Germany and France advance steadily under the EU Packaging and Packaging Waste Regulation. German automotive output keeps specialized container demand high, while France’s agriculture-to-retail cold chain embraces pooled plastic crates. Post-Brexit, the United Kingdom is re-regionalizing supply flows, giving domestic pooling firms a chance to grow volumes without cross-channel complexity.
Elsewhere in Europe, synchronized policy but staggered implementation leads to patchy adoption. Nevertheless, EU-wide rules create certainty for multinationals investing in containers that can travel across borders without regulatory surprises, supporting long-run uptake of reusable plastic returnable transport packaging market solutions.
Competitive Landscape
Market concentration is moderate. IFCO Systems and Brambles (CHEP) own dense global depots and cleaning stations, securing scale economies that new entrants struggle to match. Technology upgrades are the new battleground. In January 2025 IFCO rolled out an AI fleet-optimization engine that predicts returns 94% accurately and cuts empty miles 15% .[2]IFCO Systems N.V., “AI-Powered Container Tracking Announcement,” IFCO, ifco.com CHEP invested EUR 85 million (USD 95 million) in extra European processing capacity in December 2024, shrinking turnaround time and raising asset turns.[3]Brambles Limited, “Annual Report 2024 – Technology Investments,” Brambles, brambles.com
Regional specialists fight back by tailoring containers to niche use cases, such as Conteyor’s temperature-controlled boxes for pharmaceuticals or ORBIS’s modular totes for automated storage systems. Intellectual-property filings center on antimicrobial coatings, lightweighting, and IoT locks. Partnerships with cloud and analytics providers Schoeller Allibert with Amazon Web Services for instance underscore the data-driven evolution of container fleets.
Pricing competition intensifies in commoditized pallet rentals but remains rational for high-spec IBCs and food-grade crates where certification costs are steep. Overall, integrated service bundles that mix hardware, cleaning, tracking, and analytics form the cornerstone of differentiation in the reusable plastic returnable transport packaging market.
United States And Europe Reusable Plastic Returnable Transport Packaging Industry Leaders
IFCO Systems N.V.
Brambles Limited (CHEP)
Schoeller Allibert Services B.V.
Orbis Corporation (Menasha Corporation)
CABKA N.V.
- *Disclaimer: Major Players sorted in no particular order

Recent Industry Developments
- January 2025: IFCO Systems launched an AI-powered tracking platform across North America, processing 2.3 million container moves daily and cutting empty miles 15%.
- December 2024: Brambles expanded its EU cleaning network by 35% after spending EUR 85 million (USD 95 million) on eight new facilities.
- November 2024: IFCO opened a EUR 12 million (USD 13.4 million) digital hub in Barcelona to build blockchain-ready asset-tracking tools.
- October 2024: Schoeller Allibert teamed with Amazon Web Services to release cloud container-management software for automated warehouses.


United States And Europe Reusable Plastic Returnable Transport Packaging Market Report Scope
Reusable plastic returnable transport packaging (RTP) is a kind of packaging that can be used for more than one cycle. The market study comprises various products, such as pallets, IBCs, and reusable plastic containers.
The United States and European Reusable Plastic Returnable Transport Packaging Market is Segmented by Product (Reusable Plastic Containers, Pallets, Corrugated Boxes and Panels, IBCs, Crates, and Totes), End-user Vertical (Food and Beverage, Automotive, Consumer Durables, Industrial (including Chemicals)), and Geography.
| High-Density Polyethylene |
| Polypropylene |
| Other Materials |
| Reusable Plastic Containers (RPCs) |
| Pallets |
| Crates and Totes |
| Intermediate Bulk Containers (IBCs) |
| Other Product Types |
| Food and Beverage |
| Automotive |
| Consumer Durables and Electronics |
| Industrial and Chemicals |
| Other End-user Industries |
| Pooled / Rental |
| Captive Ownership |
| United States | |
| Europe | United Kingdom |
| Germany | |
| France | |
| Spain | |
| Rest of Europe |
| By Material | High-Density Polyethylene | |
| Polypropylene | ||
| Other Materials | ||
| By Product Type | Reusable Plastic Containers (RPCs) | |
| Pallets | ||
| Crates and Totes | ||
| Intermediate Bulk Containers (IBCs) | ||
| Other Product Types | ||
| By End-User Industry | Food and Beverage | |
| Automotive | ||
| Consumer Durables and Electronics | ||
| Industrial and Chemicals | ||
| Other End-user Industries | ||
| By Distribution Model | Pooled / Rental | |
| Captive Ownership | ||
| By Geography | United States | |
| Europe | United Kingdom | |
| Germany | ||
| France | ||
| Spain | ||
| Rest of Europe | ||


Key Questions Answered in the Report
How large is the United states and europe reusable plastic returnable transport packaging market in 2026?
It is valued at USD 24 billion and is projected to grow to USD 28.14 billion by 2031 at a 3.21% CAGR.
Which material holds the biggest share in reusable containers?
High-density polyethylene leads with 53.88% share because of its durability and established recycling streams.
Why are pooled rental models gaining popularity?
Asset-light rental platforms lower upfront costs, offer wide depot coverage, and deliver 4.08% CAGR growth through 2031.
Which region is the fastest-growing market?
Spain is expanding at 5.11% CAGR, spurred by plastic-tax legislation and 65% reuse targets.
What technology trends most affect container fleets?
AI asset-tracking, RFID integration, and blockchain verification cut shrinkage below 2% and optimize fleet positioning.
How do reusable containers help meet ESG goals?
Typical 50-cycle lifespans reduce lifecycle emissions 60-75% versus single-use options, aiding scope-3 reporting compliance.
Page last updated on:


