Urinalysis Market Size and Share
Market Overview
| Study Period | 2020 - 2031 |
|---|---|
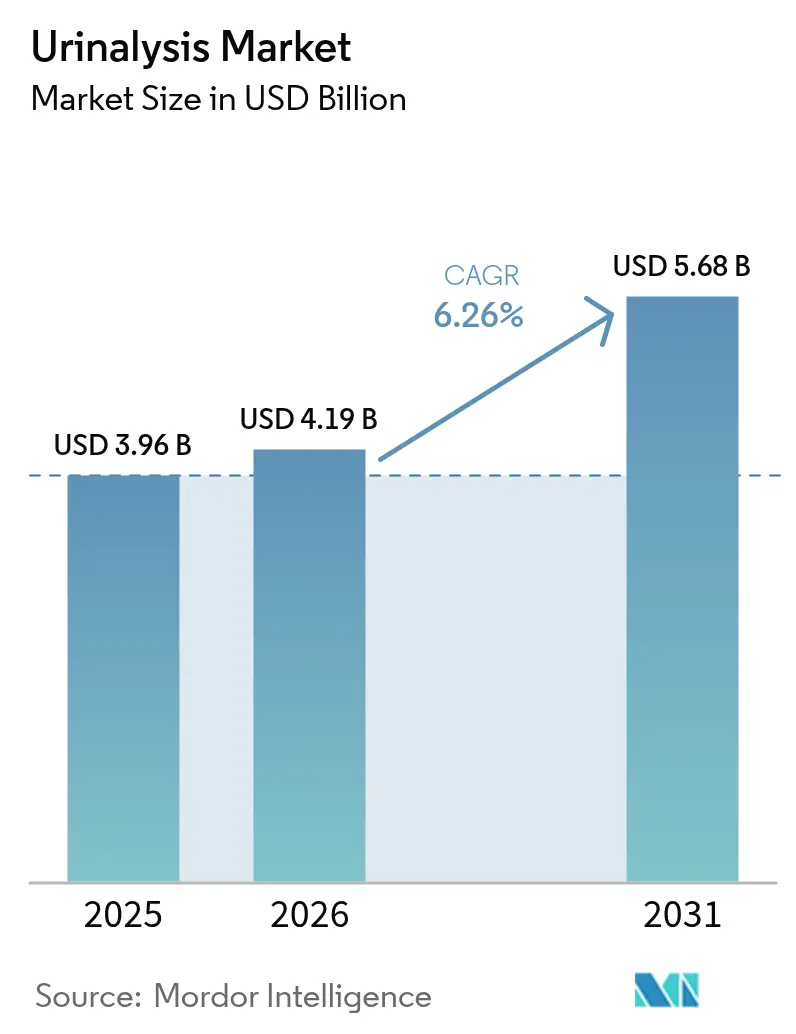
| Market Size (2026) | USD 4.19 Billion |
| Market Size (2031) | USD 5.68 Billion |
| Growth Rate (2026 - 2031) | 6.26% CAGR |
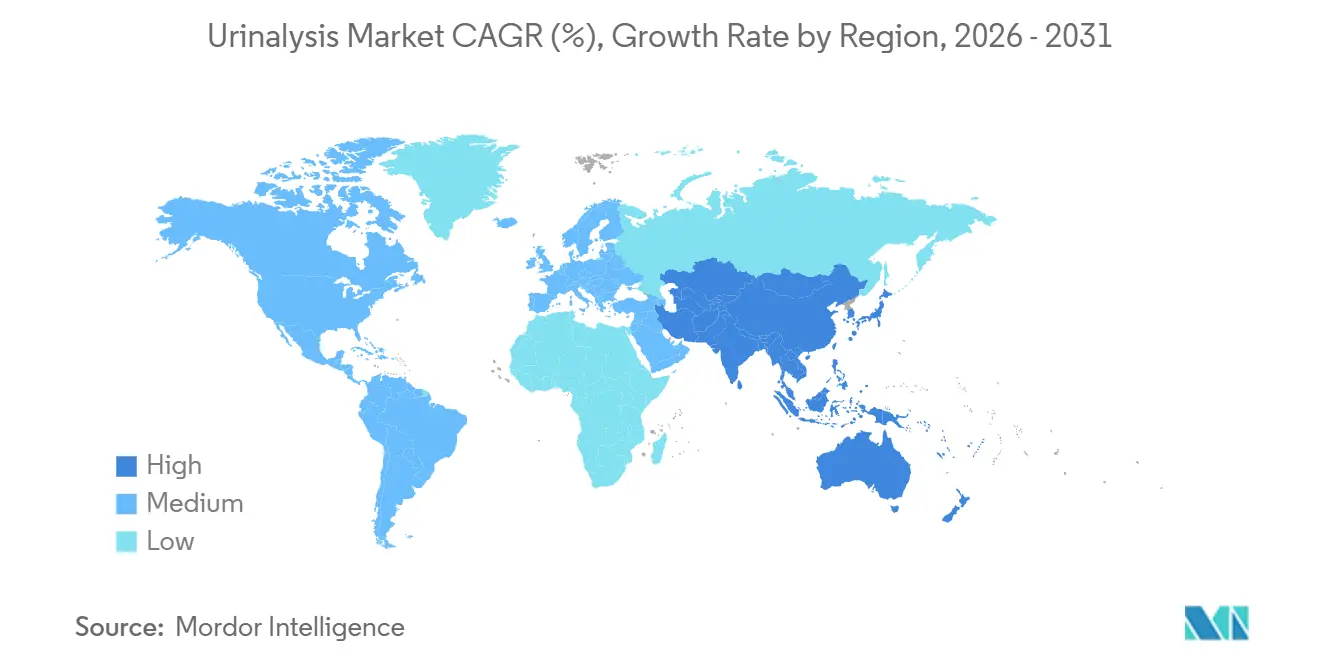
| Fastest Growing Market | Asia Pacific |
| Largest Market | North America |
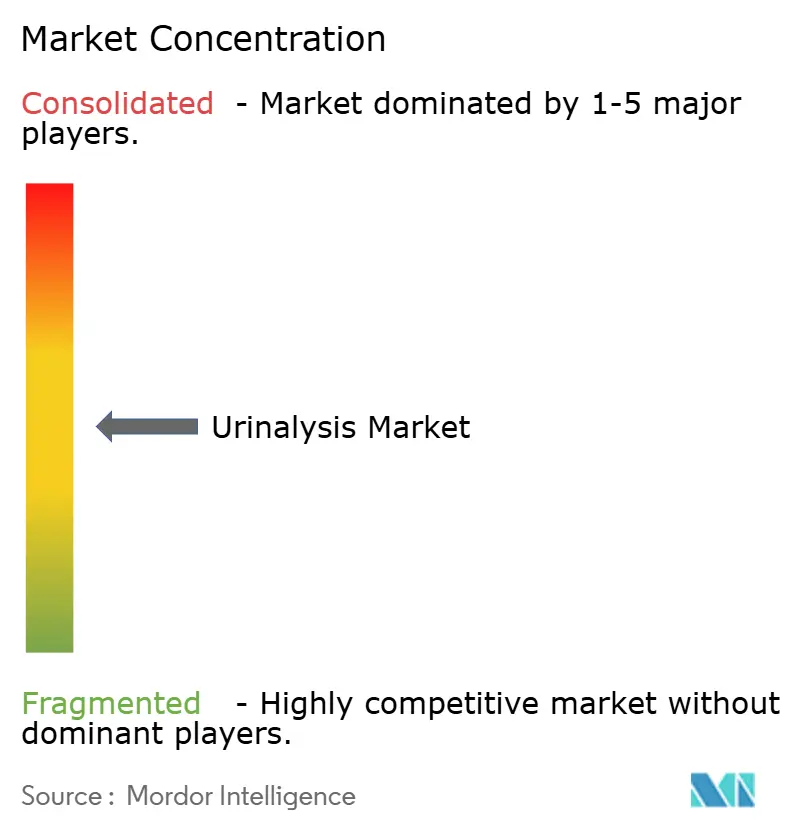
| Market Concentration | Medium |
Major Players *Disclaimer: Major Players sorted in no particular order Image © Mordor Intelligence. Reuse requires attribution under CC BY 4.0. | |
Urinalysis Market Analysis by Mordor Intelligence
The Urinalysis Market size was valued at USD 3.96 billion in 2025 and is estimated to grow from USD 4.19 billion in 2026 to reach USD 5.68 billion by 2031, at a CAGR of 6.26% during the forecast period (2026-2031).
Clinical demand stems from an expanding chronic-kidney-disease population, broader diabetes screening mandates, and hospital investments in automated, high-throughput analyzers that reduce manual review rates to below 3%. Artificial intelligence modules now interpret urinary sediment images in near real time, adding consistency to a historically subjective test step. Point-of-care systems and connected home devices are growing fastest as payers push services closer to patients and regulatory agencies clarify cybersecurity and data privacy expectations. At the same time, centralized procurement programs in China and DRG-based tariffs in Europe are squeezing consumable margins, prompting suppliers to emphasize reagent–analyzer bundles and cloud analytics that add measurable value.
Key Report Takeaways
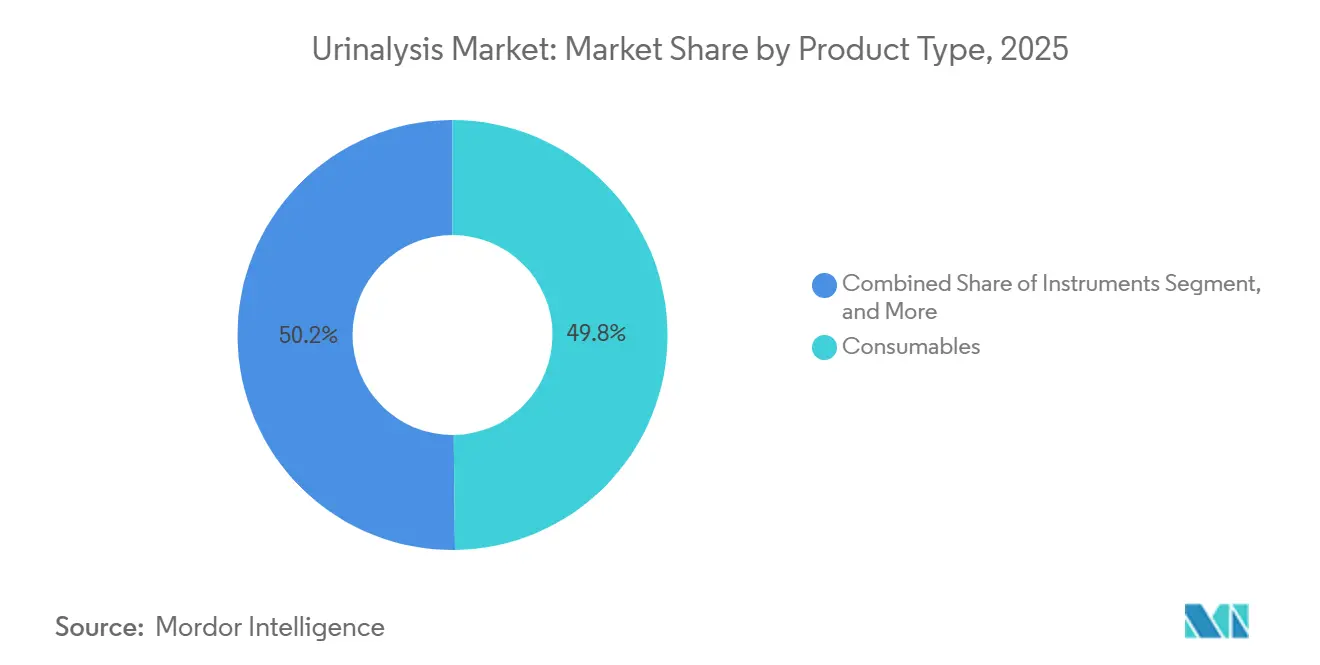
- By product, consumables led with 49.82% of the urinalysis market share in 2025, while point-of-care devices are forecast to advance at a 7.06% CAGR through 2031.
- By test type, biochemical panels accounted for 46.27% of the urinalysis market size in 2025, whereas infectious-disease detection is projected to expand at a 9.63% CAGR to 2031.
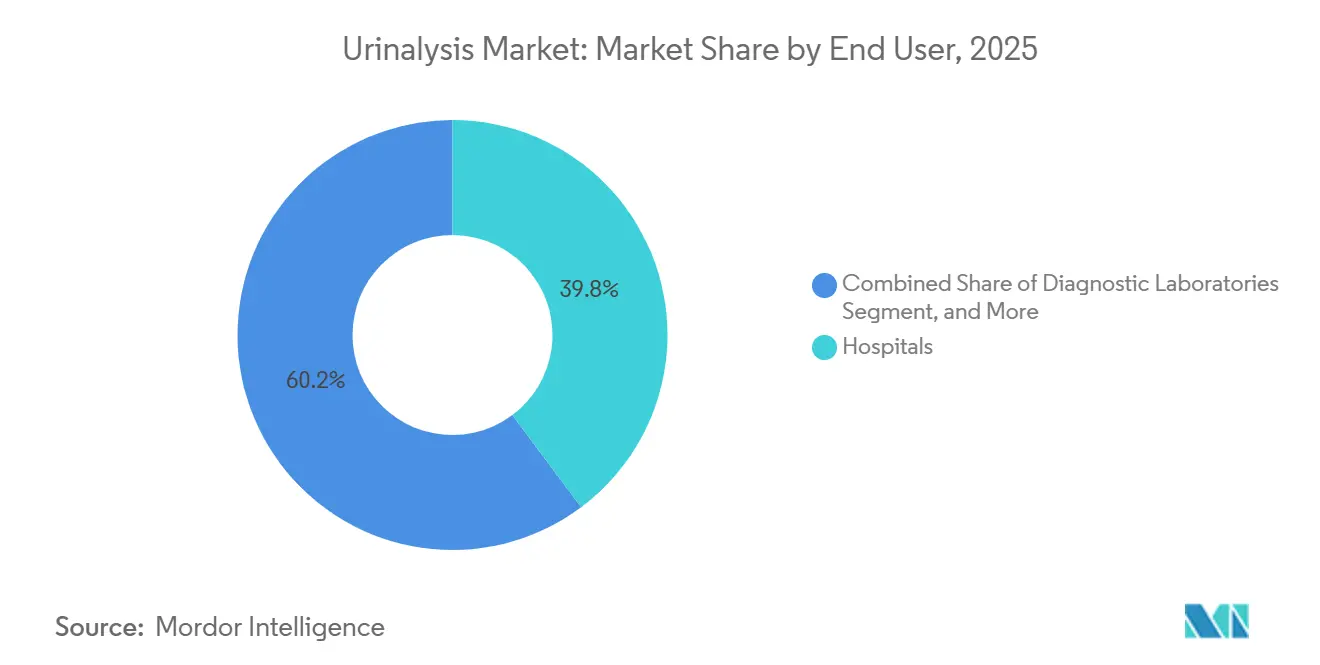
- By end user, hospitals captured 39.79% of the urinalysis market share in 2025, yet home-care settings are poised for an 8.18% CAGR over 2026-2031.
- By geography, North America retained 36.78% of the urinalysis market share in 2025; Asia-Pacific is anticipated to record the fastest regional growth at a 9.28% CAGR through 2031.
Note: Market size and forecast figures in this report are generated using Mordor Intelligence’s proprietary estimation framework, updated with the latest available data and insights as of 2026.
Global Urinalysis Market Trends and Insights
Drivers Impact Analysis*
| Driver | (~) % Impact on CAGR Forecast | Geographic Relevance | Impact Timeline |
|---|---|---|---|
| Rising prevalence of chronic kidney diseases | +1.2% | Global with high incidence in North America, Europe, urban Asia-Pacific | Medium term (2-4 years) |
| Growing diabetic population necessitating routine urine testing | +1.0% | South Asia, Middle East, North America | Long term (≥4 years) |
| Shift toward automated, high-throughput platforms | +0.9% | North America, Europe, tier-1 hospitals in China and India | Short term (≤2 years) |
| Integration of AI-powered image analysis | +0.7% | North America, Europe, Japan; early use in South Korea and Australia | Medium term (2-4 years) |
| Expansion of self-testing and tele-urinalysis kits | +0.6% | North America, Western Europe, affluent urban Asia-Pacific | Medium term (2-4 years) |
| Increasing adoption of urinary oncology biomarkers | +0.5% | North America, Europe, Japan; emerging China and India | Long term (≥4 years) |
| Source: Mordor Intelligence | |||
Rising Prevalence of Chronic Kidney Diseases
Worldwide, an estimated 788 million people live with CKD, and 14% of U.S. adults carried a diagnosis in 2024.[1]National Kidney Foundation, “Chronic Kidney Disease,” kidney.org Quarterly or semi-annual urine screening for proteinuria and hematuria has therefore become standard for diabetics and hypertensives. Hospitals and diagnostic chains rely on analyzers that process 240–480 samples per hour, reducing labor costs and enabling same-day clinical intervention. Rapid hub-and-spoke expansion in India’s tier-2 and tier-3 cities channels additional volumes to centralized labs. Recurring reagent revenue rises with every mandated follow-up but faces reimbursement caps when public insurers fix per-test fees.
Growing Diabetic Population Necessitating Routine Urine Testing
The International Diabetes Federation counted 537 million adults with diabetes in 2024 and expects the figure to top 640 million by 2030.[2]International Diabetes Federation, “IDF Diabetes Atlas,” idf.org Urinalysis detects microalbuminuria early in diabetic nephropathy and monitors glycosuria in uncontrolled patients. Public insurers favor preventive testing to avoid late-stage complications, yet India’s Ayushman Bharat program under-reimburses private hospitals, prompting a shift toward lower-cost pharmacy and home testing. Vendors pairing glucose and albumin strips with Bluetooth readers have secured contracts in community health centers across South Asia and the Middle East.
Shift Toward Automated, High-Throughput Platforms
Fully automatic analyzers, such as Siemens Healthineers’ CLINITEK Novus, cleared in Europe in 2025, process 240 specimens per hour and self-validate strip integrity. U.S. laboratories purchase these systems to offset wage inflation and to address a projected 2% growth in technician headcount amid looming retirements. Chinese hospitals prefer domestically made units, buying at an average RMB 53,300 (USD 7,400) and bundling reagents to meet centralized tender rules. Mid-tier facilities still choose semi-automated units ranging from 60 to 240 tests per hour, balancing capital budgets with daily volume.
Integration of AI-Powered Image Analysis for Sediment Examination
IBM and Beckman Coulter have demonstrated convolutional neural networks that identify cells, crystals, and casts with accuracy rivalling expert technicians. Beckman’s DxU Iris Workcell cuts manual review below 3%, improving consistency across shifts.[3]Beckman Coulter, “DxU Iris Workcell,” beckmancoulter.com The U.S. FDA’s 2024 software cybersecurity guidance accelerated 510(k) submissions by defining threat-mitigation protocols. Japan’s 2024 reimbursement handbook for software-as-a-medical-device signals Asia-Pacific support, although capital intensity remains a barrier for rural hospitals.
Restraints Impact Analysis*
| Restraint | (~) % Impact on CAGR Forecast | Geographic Relevance | Impact Timeline |
|---|---|---|---|
| Reimbursement gaps across emerging markets | −0.8% | India, Southeast Asia, Sub-Saharan Africa, Latin America | Medium term (2-4 years) |
| Shortage of skilled laboratory technicians | −0.6% | North America, Europe, urban Asia-Pacific | Short term (≤2 years) |
| Data-privacy concerns in at-home devices | −0.4% | Europe, North America, Australia | Short term (≤2 years) |
| Supply-chain vulnerability in reagents | −0.5% | Global with exposure in North America and Europe | Short term (≤2 years) |
| Source: Mordor Intelligence | |||
Reimbursement Gaps Across Emerging Markets
Public insurance programs often reimburse below the cost of reagents, discouraging private investment. Only 13% of private hospitals in a 2025 Maharashtra survey accepted Ayushman Bharat rates, pushing patients toward public facilities or cash payments. WHO noted that low- and middle-income countries spend less than 5% of their health budgets on diagnostics. Suppliers pivot to low-cost strips, but margins remain tight and distribution fragmented.
Shortage of Skilled Laboratory Technicians
The U.S. had 351,200 technologists in 2024, with 44% of staff experiencing burnout. Vacancy rates force hospitals to outsource or delay reporting, harming patient throughput. Automation reduces repetitive tasks yet still needs qualified operators for maintenance. Europe and Japan face similar staffing gaps, complicated by aging workforces and restrictive immigration policies.
*Our forecasts treat driver/restraint impacts as directional, not additive. The impact forecasts reflect baseline growth, mix effects, and variable interactions.
Segment Analysis
By Product: Consumables Anchor Revenue, Point-of-Care Devices Accelerate
Consumables generated 49.82% of urinalysis market revenue in 2025, underscoring the lock-in created by proprietary reagent strips calibrated for specific analyzers. Automated analyzers split into fully automatic workcells serving core laboratories and semi-automatic benchtop units addressing 60–240 daily tests. The urinalysis market for consumables is projected to grow steadily, even as pricing pressure from centralized procurement compresses per-test margins. Hospitals in China paid an average of RMB 53,300 (USD 7,400) for fully automatic analyzers during 2024 tenders, favoring domestic brands that bundled reagents and service contracts.
Point-of-care devices grow at a 7.06% CAGR through 2031 as pharmacies and home-health programs adopt smartphone-linked readers and microfluidic cartridges. Instruments segment revenue benefits from capital purchases of CLINITEK Novus and DxU Iris platforms, which integrate strip analysis with digital microscopy and AI particle recognition. Semi-automated analyzers remain relevant in tier-2 hospitals across India and Latin America, where budgets are tight. Veterinary clinics and companion-animal hospitals are a niche but expanding outlet, adding incremental demand for consumables as pet ownership rises.


By Test Type: Biochemical Dominance Meets Infectious-Disease Surge
Biochemical panels accounted for 46.27% of the urinalysis market share in 2025, driven by glucose, protein, and pH strips ordered for routine diabetes and renal assessment. However, infectious-disease detection is the fastest-growing category, expected to reach a 9.63% CAGR through 2031 as antimicrobial-resistance surveillance mandates rapid pathogen identification. The urinalysis market for infectious-disease applications is growing rapidly as primary-care clinics deploy 30-minute UTI point-of-care kits that reduce empirical antibiotic use.
Sediment analysis still commands meaningful revenue but shifts toward AI-enabled digital microscopy that standardizes findings and reduces technician variability. Pregnancy and fertility tests retain volume but face commoditization, with retail prices under USD 10 per kit. Drug-of-abuse testing received a policy boost when SAMHSA added oral-fluid alongside urine in May 2024 guidelines, yet employers continue to favor multi-panel urine screens for cost and historical comparability.
By End User: Hospitals Lead, Home-Care Settings Gain Momentum
Hospitals accounted for 39.79% of the urinalysis market revenue in 2025, supported by mandatory pre-operative screening and emergency-room triage protocols. Diagnostic laboratories form the next-largest group, processing outsourced samples from physician offices through hub-and-spoke networks. The urinalysis market size in home-care settings is forecast to expand fastest at an 8.18% CAGR through 2031 as connected devices like Withings U-Scan achieve FDA 510(k) clearance and GDPR compliance. Academic and research institutes consume smaller volumes but propel biomarker discovery for oncology.
Veterinary clinics contribute incremental growth, with IDEXX Laboratories booking USD 941 million in diagnostic revenue in Q3 2024. Hospitals invest in CLINITEK Novus workcells to manage morning surges, while reference laboratories compete on test menus and ISO 15189 accreditation to attract physician referrals. Home adoption is restrained by privacy legislation, but vendors that encrypt data and offer cloud dashboards capture early adopters.
Geography Analysis
North America accounted for 36.78% of the urinalysis market share in 2025, owing to established reimbursement pathways and early uptake of AI sediment platforms. The FDA’s 2024 cybersecurity guidance clarified 510(k) routes, speeding commercial launches. Workforce shortages drive hospitals to automate, aligning with capital spend on high-throughput analyzers. Canada invests through provincial screening initiatives, whereas Mexico increases private-sector laboratory chains focused on diabetes monitoring. Reimbursement cuts temper revenue, but rising preventive-health volumes partly offset price erosion.
Asia-Pacific is the fastest-growing region, with a 9.28% CAGR projected for 2026-2031. China’s centralized tenders shifted volumes toward domestically produced analyzers from Youlite, Dirui, and Mindray, whose integrated reagent offers secured 73.61% of 2024 contract value. Japan maintains a mature market with 11% of Eiken Chemical’s 2023 revenue from urinalysis strips, and the 2024 MoH guidebook supports software-as-a-medical-device reimbursement. Australia and South Korea are quickly adopting connected home devices due to their robust telemedicine infrastructure.
Europe holds a significant stake thanks to universal coverage and the enforcement of ISO 15189. Germany and the United Kingdom lead automated-analyzer uptake, while GDPR raises compliance hurdles for cloud-connected devices. Eastern European hospitals modernize under EU health-fund grants, yet constrained budgets limit premium analyzer penetration. Latin America and the Middle East & Africa contribute smaller portions but register steady growth as private hospitals expand diagnostics capacity, although currency volatility and fragmented reimbursement pose ongoing risks.

Competitive Landscape
Sysmex, Roche, Siemens Healthineers, and Danaher’s Beckman Coulter protect positions through integrated workcells that lock in proprietary reagent sales. Sysmex recorded 8% of FY 2024 revenue from urinalysis and renewed a partnership with Roche to extend reach in North America and Europe. Siemens Healthineers obtained CE Mark for CLINITEK Novus in 2025, strengthening its European hospital bid strategy.
Domestic Chinese makers Youlite, Dirui, and Mindray expand beyond county hospitals by bundling reagents and offering lifecycle service at lower prices, reducing import share from 13.5% in 2021 to 12.0% in 2024. Niche opportunities arise in veterinary and tele-urinalysis software. IDEXX reported 6.6% organic growth in Q3 2024, while IBM introduced a cloud-based AI sediment tool that can be licensed to smaller labs without the capital for full analyzers. Future competition will center on AI accuracy, cybersecurity credentials, and the ability to align with reimbursement reforms.
Urinalysis Industry Leaders
Cardinal Health Inc.
Sysmex Corporation
Beckman Coulter Inc.
Arkray Inc.
F. Hoffmann-La Roche Ltd
- *Disclaimer: Major Players sorted in no particular order

Recent Industry Developments
- May 2025: PHASE Scientific secured USD 34 million to advance its urine-based diagnostics platform.
- February 2025: Vanderbilt University and University of Michigan validated the MyProstateScore 2.0 at-home urine test, potentially reducing unnecessary biopsies by up to 53%.
- January 2025: Korean researchers unveiled BLOOM, an at-home bladder-cancer device showing 90% accuracy in unprocessed urine.
- January 2024: Vivoo launched a digital UTI test that integrates with telemedicine apps, expanding consumer urinalysis access.


Research Methodology Framework and Report Scope
Market Definitions and Key Coverage
Our study defines the urinalysis market as every instrument and consumable used to examine urine's physical, chemical, or microscopic properties for disease screening or monitoring across clinical laboratories, hospitals, point-of-care sites, and home healthcare settings.
Scope Exclusion: veterinary urinalysis and standalone drug-of-abuse cup tests are outside this report's boundary.
Segmentation Overview
- By Product
- Consumables (Reagents & Strips)
- Instruments
- Automated Analyzers
- Semi-Automated Analyzers
- Point-of-Care Devices
- By Test Type
- Biochemical Urinalysis
- Sediment Analysis
- Pregnancy & Fertility Testing
- Drug-of-Abuse Testing
- Infectious Disease Detection
- By End User
- Hospitals
- Diagnostic Laboratories
- Home-Care Settings
- Academic & Research Institutes
- Veterinary Clinics
- By Geography
- North America
- United States
- Canada
- Mexico
- Europe
- Germany
- United Kingdom
- France
- Italy
- Spain
- Rest of Europe
- Asia-Pacific
- China
- Japan
- India
- Australia
- South Korea
- Rest of Asia-Pacific
- Middle East & Africa
- GCC
- South Africa
- Rest of Middle East & Africa
- South America
- Brazil
- Argentina
- Rest of South America
- North America
Detailed Research Methodology and Data Validation
Primary Research
Our team interviews lab managers, nephrologists, procurement officers, and regional distributors across North America, Europe, Asia-Pacific, Latin America, and MEA. Conversations validate utilization ratios, price dispersion, and replacement cycles, while short surveys with instrument manufacturers capture capacity additions and export mix shifts.
Desk Research
We begin with structured reviews of publicly available datasets, national renal registries, Centers for Disease Control health surveys, and World Kidney Day epidemiology notes, plus trade association outputs such as the International Federation of Clinical Chemistry guidelines. Company 10-Ks, FDA 510(k) clearances, and peer-reviewed journals like the Journal of Clinical Laboratory Analysis enrich baseline volumes and average selling prices.
Subscription services, for example, D&B Hoovers for company revenues and Dow Jones Factiva for global shipment news, let our analysts trace corporate share swings and product launches. These sources are illustrative only; many additional publications, filings, and databases inform the evidence pool.
Market-Sizing & Forecasting
Mordor analysts anchor 2025 demand with a top-down prevalence-to-test calculation that scales diagnosed UTI, diabetes, and chronic kidney disease populations to annual urine test encounters, which are then filtered through setting-specific test menus and discard rates. Select bottom-up checks, sampled instrument installed-base roll-ups and consumable pull-through audits, align volumes to reality. Key drivers built into our model include inpatient UTI admission trends, dipstick-to-automated analyzer substitution rates, average reagent strip usage per test, and regional healthcare expenditure growth. Forecasts to 2030 employ multivariate regression blended with ARIMA to project test volumes, while expert consensus steers price trajectories and scenario weights.
Data Validation & Update Cycle
Outputs pass variance scans against import statistics, customs codes, and insurance claim tallies before double review by senior analysts. Models refresh annually; mid-cycle updates trigger when regulatory or recall events materially alter market math.
Why Mordor's Urinalysis Baseline Earns Decision-Makers' Trust
Published figures differ because firms pick dissimilar product baskets, price ladders, and refresh cadences.
We acknowledge these gaps upfront.
Benchmark comparison
| Market Size | Anonymized source | Primary gap driver |
|---|---|---|
| USD 3.89 B (2025) | Mordor Intelligence | |
| USD 4.70 B (2025) | Global Consultancy A | Adds home fertility and drug-screen kits; minimal price deflation for low-income regions |
| USD 2.52 B (2025) | Industry Journal B | Excludes point-of-care analyzers; relies only on hospital procurement data |
These contrasts show why our disciplined scope, dual-track modeling, and yearly refresh give clients a balanced, transparent baseline they can retrace and update with confidence.


Key Questions Answered in the Report
How large will the urinalysis market be by 2031?
It is projected to reach USD 5.68 billion, growing at a 6.26% CAGR over 2026-2031.
Which product category dominates spending today?
Consumables account for 49.82% of 2025 revenue thanks to recurring reagent purchases tied to installed analyzers.
What is the fastest-growing test type?
Infectious-disease detection leads with a projected 9.63% CAGR as antimicrobial-resistance surveillance expands.
Why is Asia-Pacific the growth hotspot?
Hospital capacity additions in India and China, plus domestic analyzer manufacturing, drive a 9.28% regional CAGR.
How are vendors addressing technician shortages?
Suppliers roll out fully automatic analyzers with AI sediment imaging that lower manual review below 3% and ease staffing burdens.
Page last updated on:


