Unmanned Ground Vehicle Market Size and Share
Market Overview
| Study Period | 2019 - 2031 |
|---|---|
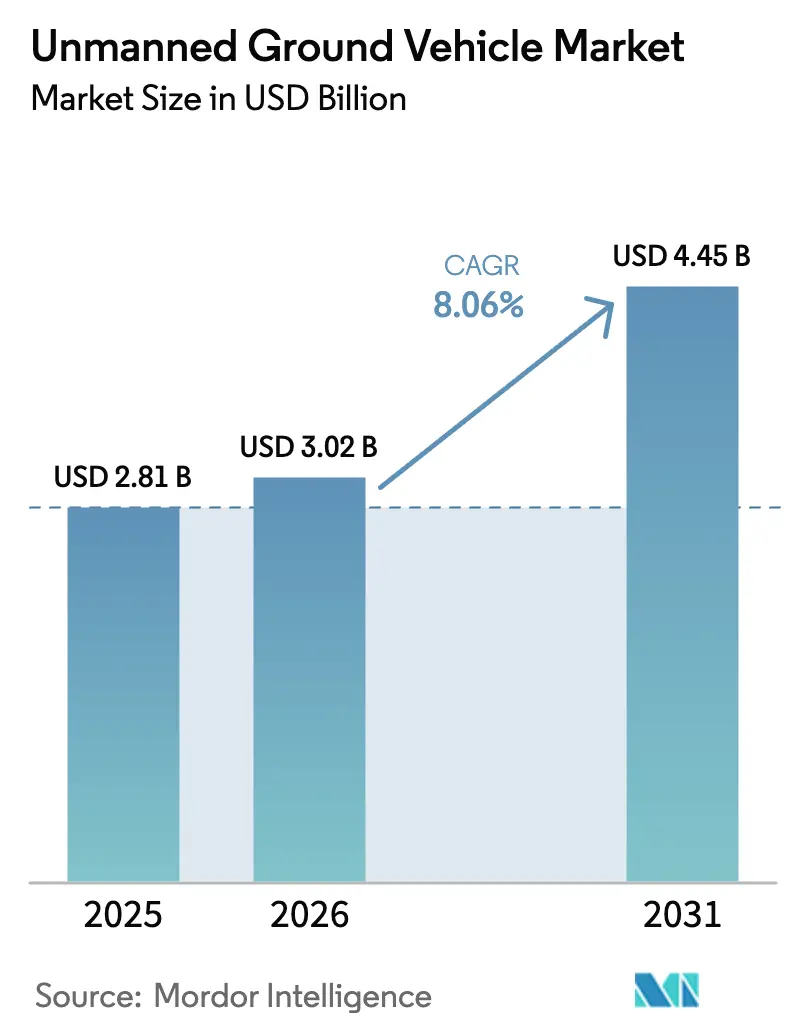
| Market Size (2026) | USD 3.02 Billion |
| Market Size (2031) | USD 4.45 Billion |
| Growth Rate (2026 - 2031) | 8.06% CAGR |
| Fastest Growing Market | Europe |
| Largest Market | North America |
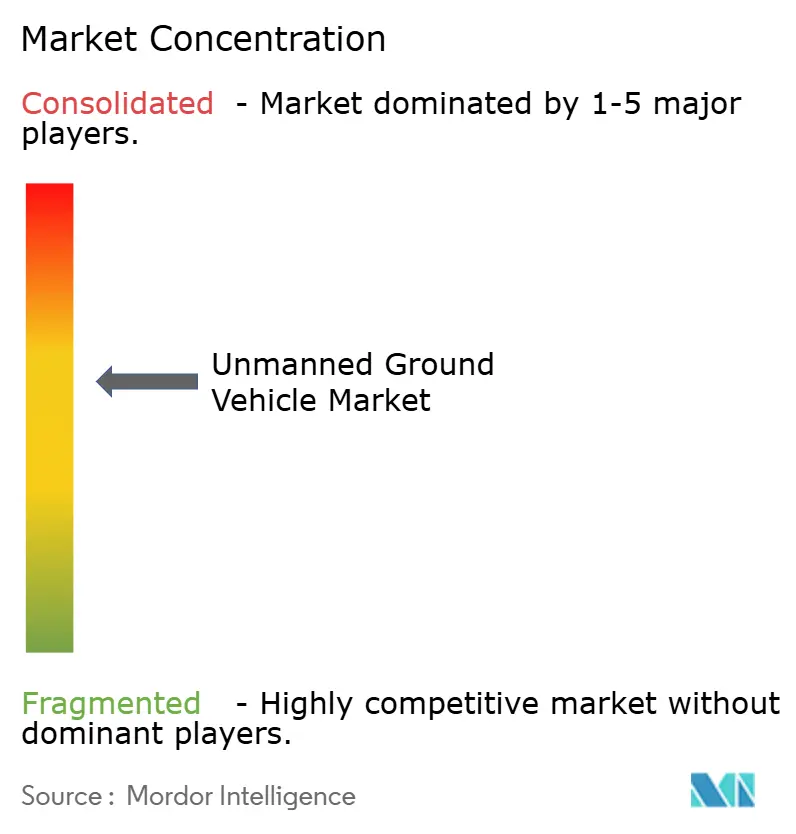
| Market Concentration | Medium |
Major Players *Disclaimer: Major Players sorted in no particular order Image © Mordor Intelligence. Reuse requires attribution under CC BY 4.0. | |
Unmanned Ground Vehicle Market Analysis by Mordor Intelligence
The unmanned ground vehicle market size is expected to grow from USD 2.81 billion in 2025 to USD 3.02 billion in 2026 and is forecasted to reach USD 4.45 billion by 2031 at an 8.06% CAGR over 2026-2031. Momentum stems from widening defense procurement pipelines, accelerating warehouse and mining automation, lower solid-state LiDAR prices, and steady improvements in autonomy middleware. Military demand for casualty evacuation and counter-IED robots continues to drive volumes, while commercial buyers, particularly those in e-commerce, mining, and agriculture, account for the fastest incremental gains. Competitive advantages increasingly concentrate around software stacks, interoperability credentials, and robotics-as-a-service (RaaS) pricing, which together reduce switching costs for mid-tier logistics firms. On the supply side, falling sensor and battery costs, coupled with modest barriers to mechanical integration, provide smaller entrants with room to target niche white spaces. However, cybersecurity vulnerabilities, fragmented command-and-control standards, and power-density constraints still temper adoption in long-endurance and BVLOS missions.
Key Report Takeaways
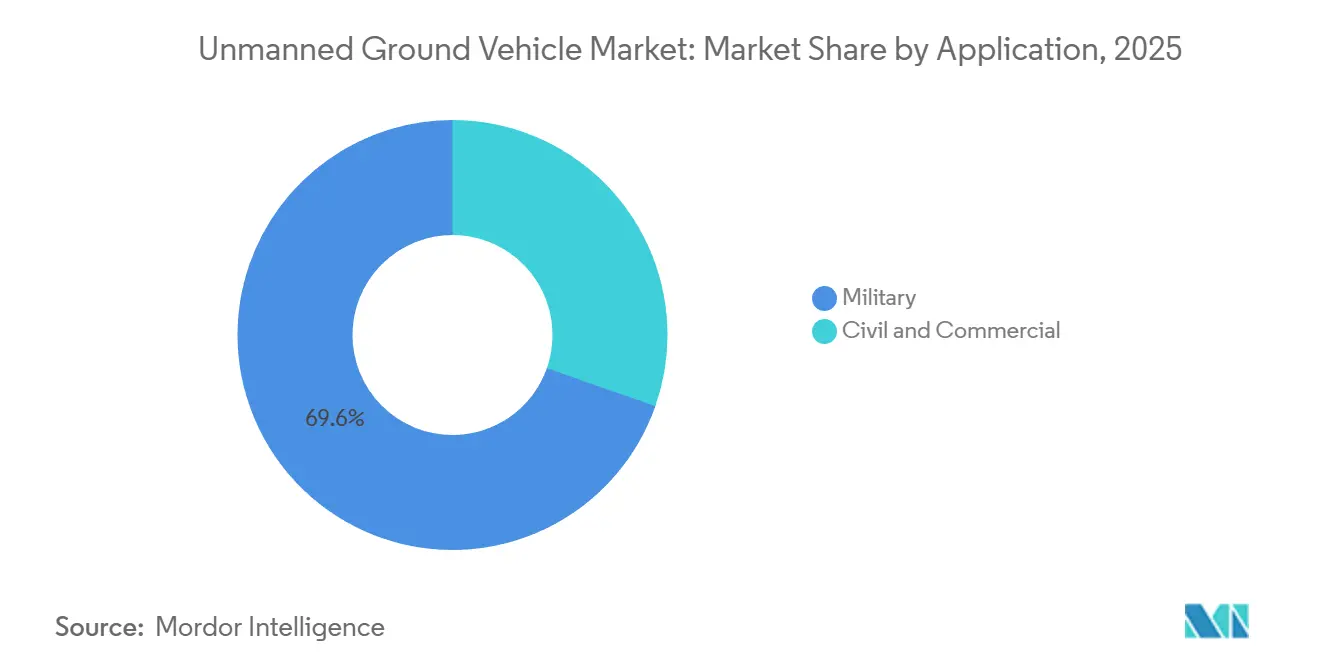
- By application, military platforms led with 69.63% revenue share in 2025, while civil and commercial use cases are projected to expand at an 8.27% CAGR through 2031.
- By mobility, wheeled vehicles captured 50.89% of 2025 deployments; tracked configurations are expected to register the highest forecast growth at a 9.11% CAGR.
- By size class, medium UGVs (200 to 500 kg) held 36.21% of 2025 spending; micro robots, less than 10 kg, are advancing at a 10.04% CAGR.
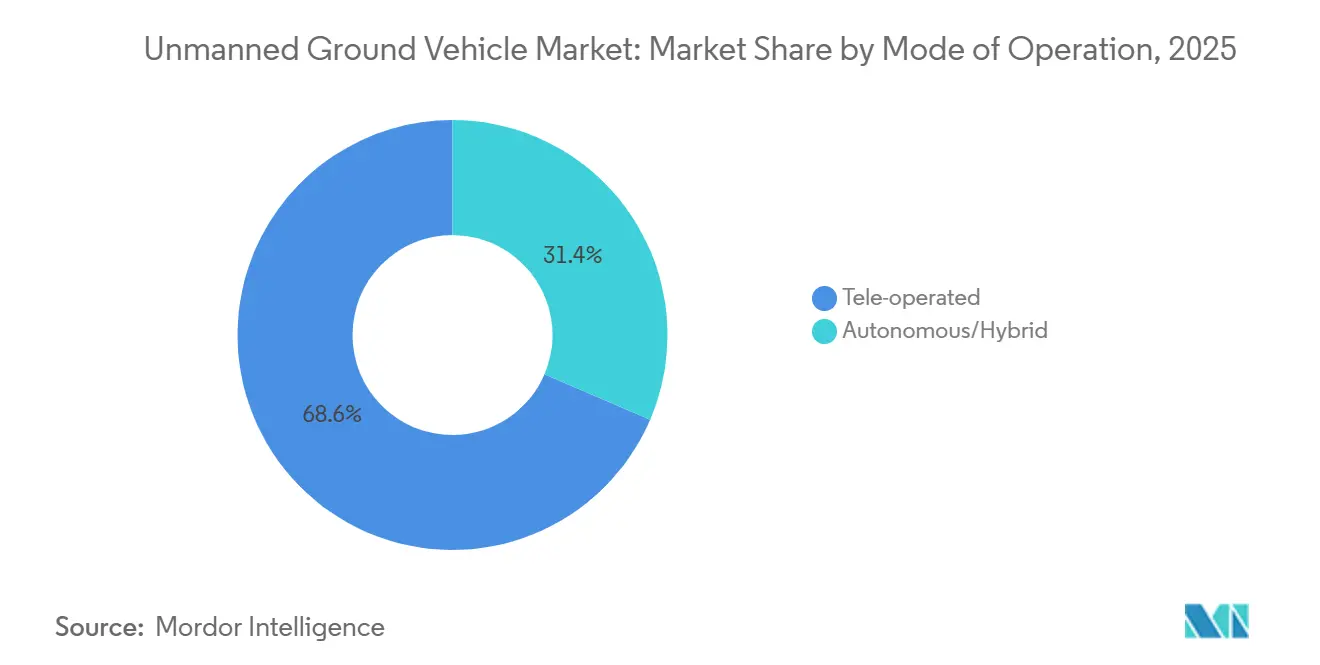
- By mode of operation, tele-operated systems accounted for 68.56% of 2025 installations; autonomous and hybrid modes are projected to rise at a 10.85% CAGR.
- By component, hardware dominated with 64.87% of the 2025 expenditure; software and AI stacks exhibited the fastest growth at a 12.21% CAGR.
- By power source, battery-electric solutions accounted for 52.67% of 2025 sales; hybrid-electric drivetrains are expanding at an 11.75% CAGR.
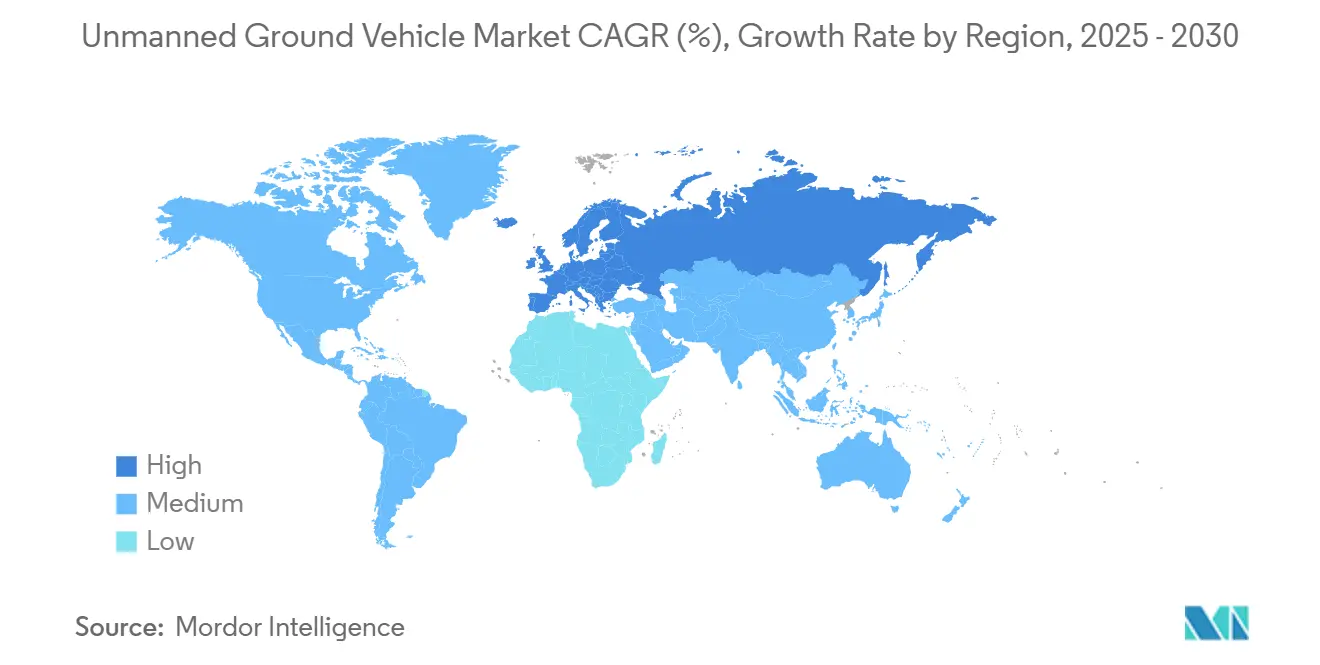
- By geography, North America accounted for 39.12% of the 2025 revenue, while Europe is the fastest-growing region, with a 10.19% CAGR.
Note: Market size and forecast figures in this report are generated using Mordor Intelligence’s proprietary estimation framework, updated with the latest available data and insights as of January 2026.
Global Unmanned Ground Vehicle Market Trends and Insights
Drivers Impact Analysis*
| Driver | (~) % Impact on CAGR Forecast | Geographic Relevance | Impact Timeline |
|---|---|---|---|
| Military demand for casualty evacuation UGVs in contested environments | +1.2% | North America, Europe, Middle East | Medium term (2–4 years) |
| Deployment of counter-IED robot fleets for route clearance missions | +0.9% | North America, Middle East, Asia-Pacific | Short term (≤ 2 years) |
| Rapid adoption of autonomous logistics carts in e-commerce warehouses | +1.8% | Global, early uptake in North America, Europe, Asia-Pacific | Short term (≤ 2 years) |
| Mining sector's shift toward unmanned haulage for zero-harm initiatives | +1.5% | Australia, Chile, Canada, South Africa | Medium term (2–4 years) |
| Advancements in solid-state LiDAR lowering navigation sensor costs | +1.3% | Global | Medium term (2–4 years) |
| Defense funding for MUM-T concepts | +1.0% | North America, Europe, Asia-Pacific | Long term (≥ 4 years) |
| Source: Mordor Intelligence | |||


Military Demand for Casualty-Evacuation UGVs in Contested Environments
Armed forces are fielding tracked and wheeled robots designed to rescue wounded personnel without exposing medics to direct fire. The US Army allocated USD 92.5 million in its fiscal 2025 budget for the Tactical Unmanned Ground Vehicle effort, specifying the ability to haul a 250 kg casualty across 10 km of rubble-strewn terrain.[1]U.S. Army, “Tactical Unmanned Ground Vehicle Program,” army.mil European partners follow suit; Milrem Robotics delivered stretcher-equipped THeMIS units to Ukraine, where field feedback indicates a 30% reduction in combat medic casualties during urban engagements. Increasing lethality in peer-level conflicts elevates the priority of personnel preservation, which outweighs the higher costs associated with robot acquisition. Interoperability remains a hurdle because proprietary data links must be able to connect with command-and-control suites, such as the Integrated Visual Augmentation System. As urban warfare proliferates and NATO doctrines emphasize force protection, medium- and large-casualty-evacuation UGVs will occupy a larger share of the unmanned ground vehicle market.
Deployment of Counter-IED Robot Fleets for Route-Clearance Missions
Explosive-ordnance-disposal (EOD) units are shifting from single-robot tactics to multi-UGV fleets that scout, mark, and neutralize threats along convoy routes. The UK MoD awarded L3Harris Technologies, Inc., a contract in 2024 for up to 50 T4 robots equipped with manipulator arms and disruptor charges. Fleet tactics reduce route-clearance time by 40% because operators can supervise several robots from a standoff position. Micro robots such as ReconRobotics’ Throwbot enable infantry squads to inspect culverts before vehicles advance. Regulatory treatment of disruptive munitions varies, with the US ATF classifying tele-operated disruptors as destructive devices, favoring established defense integrators. As insurgent tactics evolve toward vehicle-borne explosives, the demand for micro and small EOD platforms is expected to persist throughout the decade.
Rapid Adoption of Autonomous Logistics Carts in E-commerce Warehouses
Amazon has deployed more than 1 million autonomous mobile robots (AMRs) across its fulfillment network, including the Proteus platform, which navigates without physical guides and collaborates safely with human pickers. DHL and other third-party logistics providers are scaling similar fleets, citing double-digit improvements in order-picking productivity. Subscription-based RaaS pricing from vendors such as Locus Robotics and Fetch Robotics lowers up-front costs for mid-tier customers. Integration remains complex because warehouse-management systems from SAP, Oracle, and Manhattan Associates employ differing API schemas. As same-day delivery becomes the baseline, software-defined fleets capable of overnight re-tasking will drive the next leg of growth within the unmanned ground vehicle market.
Mining Sector’s Shift Toward Unmanned Haulage for Zero-Harm Initiatives
Komatsu’s FrontRunner system is expected to surpass 10 billion metric tons moved by 2025, with more than 750 driverless trucks operating worldwide.[2]Komatsu Ltd., “FrontRunner: 10 Billion Tonnes Hauled,” komatsu.com BHP’s Spence mine in Chile achieved full autonomy across 33 haul trucks and five drills, cutting haulage cost per tonne by 15%. Nevada Gold Mines launched 300-tonne Komatsu driverless trucks in July 2025, marking the United States’ first large-scale adoption of autonomous haulage. ISO 23725:2024 provides interoperability requirements, reducing integration overhead when mines mix fleets from multiple OEMs. With labor shortages and safety mandates intensifying, unmanned haulage is becoming a baseline rather than a pilot in hard-rock and bulk material operations.
Restraints Impact Analysis*
| Restraint | (~) % Impact on CAGR Forecast | Geographic Relevance | Impact Timeline |
|---|---|---|---|
| Interoperability gaps across proprietary UGV C2 protocols | -0.8% | Global | Medium term (2–4 years) |
| Challenging SWaP trade-offs for long-endurance missions | -0.6% | Global, acute in expeditionary operations | Short term (≤ 2 years) |
| Cyber-security vulnerabilities in remote tele-operation links | -0.5% | Global, heightened in defense | Medium term (2–4 years) |
| Regulatory lag for BVLOS ground autonomy on public roads | -0.7% | North America, Europe, Asia-Pacific | Long term (≥ 4 years) |
| Source: Mordor Intelligence | |||
Interoperability Gaps Across Proprietary UGV Command-and-Control Protocols
There is no major universal standard governing the command interfaces of UGVs. NATO STANAG 4586 covers unmanned aircraft, but ground-vehicle annexes remain in draft form.[3]NATO, “STANAG 4586 Unmanned Aircraft Systems,” nato.int As a result, brigades operating General Dynamics TRX, Teledyne FLIR PackBot, and Milrem THeMIS robots must train on multiple control tablets, doubling operator workload. Mining operators experience similar friction; ISO 23725 improves truck interoperability, yet legacy Komatsu, Caterpillar, and Hitachi platforms still require middleware layers that increase latency. Support for parallel protocols consumes up to 20% of software development budgets within prime contractors, quickly limiting the unmanned ground vehicle market's ability to scale multivendor fleets.
Challenging SWaP Trade-offs for Long-Endurance Missions
Micro and small UGVs typically operate two to four hours on lithium-ion packs, curbing their utility for persistent reconnaissance. Increasing battery capacity adds mass and reduces payload space, while hybrid generators increase acoustic and thermal signatures that compromise stealth. The US Army’s 350 kg S-MET platform uses a hybrid-electric drivetrain to extend range to 60 miles, but field reports flag noise as a limiting factor. Solar augmentation only adds 10-15% endurance in optimal conditions. Until solid-state batteries mature or hydrogen fuel cell logistics become routine, SWaP constraints will push demand toward larger chassis or mission-specific endurance compromises.
*Our forecasts treat driver/restraint impacts as directional, not additive. The impact forecasts reflect baseline growth, mix effects, and variable interactions.
Segment Analysis
By Application: Military Dominance Faces Commercial Disruption
Military programs retained 69.63% of 2025 revenue, underscoring the centrality of defense budgets to the unmanned ground vehicle market. Civil and commercial buyers, however, are set to record an 8.27% CAGR through 2031, narrowing the gap as warehouse operators and mining majors expand autonomous fleets. Amazon’s fulfillment centers alone host more than 1 million robots, a scale dwarfing any single defense project. Mining houses such as Rio Tinto and BHP rely on around-the-clock unmanned trucks that eliminate driver exposure to hazardous slopes. Regulatory frameworks diverge sharply: military UGVs enjoy national security exemptions, while the European AI Act imposes conformity assessments on civilian platforms, favoring established integrators.
Defense remains tethered to roles such as counter-IED, casualty evacuation, and reconnaissance, evidenced by the UK’s T4 EOD contract in 2024. Civil adoption benefits from quicker payback periods, since warehouse robots often amortize in two years when wage inflation tops 4%. Agriculture, construction, and inspection add fresh verticals, stretching the unmanned ground vehicle market into new addressable volumes. As capital expenditure shifts toward autonomous software, the civil segment’s share of the unmanned ground vehicle market size is expected to surpass the 35% threshold by 2031.

By Mobility: Tracked Systems Emerge for Specialized Applications
Wheeled platforms constituted 50.89% of 2025 deployments, which were favored for paved surfaces and simplified maintenance. Tracked units are forecast to expand at a 9.11% CAGR, as militaries and mining operators require low-ground-pressure vehicles that can traverse mud, sand, and rubble. Milrem Robotics’ THeMIS demonstrated trench crossing agility in the conflict zones of Ukraine. Although autonomous haul trucks remain wheeled due to haul road conditions, tracked dozers now integrate autonomy kits for overburden removal.
Legged mobility remains a nascent yet strategic capability; Ghost Robotics’ Vision 60 quadruped can climb stairs and operate on rocky slopes. Tracked systems incur higher maintenance costs, as track pads often need to be replaced every 1,500 hours; yet, operators accept this expense in exchange for tactical mobility. As urban warfare intensifies and new mines open in topographically complex regions, the share of tracked vehicles inside the unmanned ground vehicle market is expected to approach one-third by 2031.
By Size Class: Micro Platforms Surge on Urban Reconnaissance and Last-Mile Delivery
Medium UGVs (200 to 500 kg) captured 36.21% of the 2025 expenditure, offering a balance between payload and transportability. Micro robots weighing less than 10 kg, however, are accelerating at a 10.04% CAGR, driven by the demand for throwable reconnaissance and emerging last-mile delivery pilots. ReconRobotics’ 1.2 kg Throwbot is fielded by US and allied forces for culvert inspection.[4]ReconRobotics, “Throwbot Overview,” reconrobotics.com
Small robots (10 to 200 kg) dominate EOD operations through platforms such as Teledyne FLIR PackBot. Large and heavy classes serve niche roles, from General Dynamics’ 700 kg TRX anti-armor scout to Komatsu’s 100,000 kg driverless haul trucks. Micro-segment endurance rarely exceeds 90 minutes, but unit costs below USD 10,000 enable expendable usage. As autonomy software and battery density improve, the micro share of the unmanned ground vehicle market size is likely to double by the close of the decade.
By Mode of Operation: Autonomy Chips Away at Human-In-The-Loop Dominance
Tele-operated systems accounted for 68.56% of the 2025 units, but autonomous and hybrid modes are forecast to rise at a 10.85% CAGR, driven by LiDAR prices now below USD 500 per sensor. Mining haul fleets already run near-continuous autonomous cycles, having moved more than 10 billion metric tons by 2025.
Military rules of engagement keep humans in the loop for lethal decisions. Yet, supervised autonomy where robots execute planned routes, and humans intervene for exceptions, is gaining ground in the Robotic Combat Vehicle program. Warehouse AMRs, such as Proteus, operate almost fully autonomously, requiring human assistance only when anomalies arise. As safety cases accumulate and zero-trust communication protocols mature, autonomous deployments are expected to account for more than one-third of the unmanned ground vehicle market by 2031.

By Component: Software Value Migration Accelerates
Hardware accounted for 64.87% of the 2025 spend, but software and AI stacks are expanding at a 12.21% CAGR, mirroring the value shifts seen in smartphones and vehicles. General Dynamics Mission Systems supplies autonomy middleware to the US Army, while Anduril’s Lattice OS offers a vendor-agnostic orchestration layer.
Mining software subsidiaries such as Modular Mining and Hexagon capture subscription revenues for fleet optimization. NVIDIA’s Isaac platform reduces time-to-market for startups by bundling perception models and simulation tools. As sensor and drivetrain components turn into commodities, software intellectual property will anchor competitive moats across the unmanned ground vehicle industry.
By Power Source: Hybrid-Electric Systems Address Endurance Constraints
Battery-electric UGVs led the market with 52.67% of 2025 sales, primarily due to their low acoustic signatures and simplified maintenance requirements. Hybrid-electric drivetrains, however, are expanding at 11.75% CAGR because military patrols and mining trucks require missions longer than the typical two-hour lithium-ion window.
The US Army’s S-MET leverages hybrid propulsion to offer a 60-mile range and 72-hour silent-watch capability. Komatsu’s 930E diesel-electric haul truck works around the clock with 12-hour refueling intervals. Hydrogen and solid-state batteries promise higher energy density, but until infrastructure scales, hybrid-electric vehicles will remain the bridge technology within the unmanned ground vehicle market.
Geography Analysis
North America accounted for 39.12% of the 2025 turnover in the unmanned ground vehicle market, bolstered by USD 13.4 billion in the US DoD's autonomous-system allocations and Canadian mining automation. Robust R&D ecosystems and stable procurement budgets sustain domestic integrators, while Amazon's warehouse robot fleet adds large commercial volumes.
Europe is projected to grow strongly, supported by Germany's, France's, and the UK's robotic-platoon programs, as well as the EU's AI Act conformity assessments, which favor contracts going to incumbents with compliance capacity. Rheinmetall's Mission Master family secured multi-country orders, and the UK Connected and Automated Vehicles Bill, set to become law in 2026, establishes a clear BVLOS pathway for public road UGVs.
The Asia-Pacific region is witnessing rapid defense modernization: China fields domestically developed Sharp Claw and Lynx UGVs, India is trialing Bharat Forge's Kalyani M4, and Japan and South Korea are prioritizing perimeter-security robots. The Middle East purchases counter-IED and perimeter robots from Israel Aerospace Industries and Elbit Systems. South American adoption centers on autonomous haulage in Chile and Peru, while Africa's early market focuses on South African mines and North African EOD contracts. As Eastern Europe counters regional threats and Asia-Pacific nations fortify their borders, geographic dispersion will likely lessen North America's share, even as global volumes rise.

Competitive Landscape
The unmanned ground vehicle market shows moderate concentration. General Dynamics Corporation, Teledyne FLIR LLC, and Rheinmetall AG control core defense programs and collectively exceed 60% of military deliveries. This is supported by General Dynamics’ USD 89 billion backlog and 22.4% defense earnings growth in the first quarter of 2025. Their scale secures supply chain priority, and funds sustain research and development.
M&A remains selective: Zebra’s acquisition of Fetch Robotics embeds AMRs into warehouse solutions, and Teledyne’s purchase of FLIR merges sensing with mobility. Compliance costs tied to Europe’s AI Act favor capitalized incumbents, potentially slowing consolidation. As ISO 23725 and future STANAG annexes mature, differentiation will migrate from hardware to services, data analytics, and ecosystem lock-in. Firms capable of bundling autonomy algorithms, fleet management, and RaaS financing are best positioned to expand their share.
Price competition is limited because mission risk and uptime take precedence over upfront cost, yet buyers demand evidence of open standards compliance. Vendors answering that call with modular software and transparent APIs will likely capture the next growth wave, shifting competitive advantage from metal bending to code shipping across the unmanned ground vehicle industry.
Unmanned Ground Vehicle Industry Leaders
Rheinmetall AG
L3Harris Technologies, Inc.
QinetiQ Group plc
Teledyne FLIR LLC (Teledyne Technologies Corporation)
General Dynamics Corporation
- *Disclaimer: Major Players sorted in no particular order

Recent Industry Developments
- June 2025: Sweden’s FMV granted Rheinmetall a EUR 488,536 (approximately USD 563,000) contract to evaluate the Mission Master UGV under its DAMM program.
- May 2025: Huawei deployed 100 5G-A autonomous electric mining trucks at the Yimin mine in China, achieving 120% efficiency versus manual fleets.
- March 2025: Ukraine conducted the first combat assault using UGVs and FPV drones exclusively, demonstrating the viability of autonomous combined arms.
- January 2025: France’s DGA launched the DROIDE program, in collaboration with KNDS and Safran, to field multi-mission ground robots by 2035.


Research Methodology Framework and Report Scope
Market Definitions and Key Coverage
Our study defines the unmanned ground vehicle (UGV) market as the annual value of newly manufactured, self-propelled robotic platforms that travel on wheels, tracks, legs, or hybrid mechanisms and operate without an onboard human. Platforms covered span military, law enforcement, mining, agriculture, logistics, and public safety use cases, provided the vehicle carries its own propulsion, navigation, sensing, and payload subsystems and is sold as an integrated unit. According to Mordor Intelligence, kits that retrofit legacy vehicles have been excluded from the baseline.
Scope exclusion: warehouse automated guided vehicles, purely tethered bomb squad manipulators, and consumer hobby robots are outside this estimate.
Segmentation Overview
- By Application
- Military
- Civil and Commerical
- By Mobility
- Wheeled
- Tracked
- Legged
- By Size Class
- Micro (Less than 10 kg)
- Small (10 to 200 kg)
- Medium (200 to 500 kg)
- Large (500 to 1,000 kg)
- Heavy (Greater than 1,000 kg)
- By Mode of Operation
- Tele-operated
- Autonomous/Hybrid
- By Component
- Hardware (Chassis, Sensors, Powertrain, Payloads)
- Software and AI Stack
- Services (Integration, MRO)
- By Power Source
- Electric Battery
- Hybrid-Electric
- Internal Combustion
- By Geography
- North America
- United States
- Canada
- Mexico
- Europe
- United Kingdom
- France
- Germany
- Russia
- Rest of Europe
- Asia-Pacific
- China
- India
- Japan
- South Korea
- Rest of Asia-Pacific
- South America
- Brazil
- Rest of South America
- Middle East and Africa
- Middle East
- Saudi Arabia
- United Arab Emirates
- Israel
- Rest of Middle East
- Africa
- South Africa
- Rest of Africa
- Middle East
- North America
Detailed Research Methodology and Data Validation
Primary Research
Mordor analysts interviewed brigade robotics officers in the United States, European border security planners, APAC mining supervisors, and component suppliers across Li-ion battery, lidar, and drive train niches. These conversations validated service life assumptions, average selling prices, and deployment pacing that public data alone could not clarify.
Desk Research
We anchored secondary estimates with open access defense budget outlays, UGV procurement notices, and customs shipment codes released by sources such as SIPRI, NATO's annual defense statistics, the US Federal Procurement Data System, and Eurostat trade files. Industry-specific journals like Army AL&T and Robotics & Automation Magazine helped map upcoming field trials, while standards from ISO 8373 guided the technical boundary. To profile commercial uptake, our team scanned OSHA incident logs, FAA ground robot waivers, and filings within SEC 10-Ks that itemize autonomous ground systems revenue. Subscriber databases, including D&B Hoovers for company financials and Dow Jones Factiva for press coverage, supplied firm level splits. The sources cited above are illustrative; many additional publications informed our fact base.
Market-Sizing & Forecasting
A top down reconstruction starts with region level defense and civil robotics spending, which is then filtered through adoption ratios by application and mobility class. Select bottom up cross checks, sampled manufacturer shipments and reseller channel volumes, temper the totals. Key variables include active duty modernization budgets, average unit replacement cycles, sensor cost per watt, lithium-ion energy density progression, and regulation counts approving autonomous operations. Five year outlooks use multivariate regression that links UGV uptake to those drivers alongside GDP and commodity price indicators; scenario bands incorporate expert consensus on conflict intensity and battery supply stability. Data gaps in supplier roll ups are bridged using interpolated ASP trends corroborated during interviews.
Data Validation & Update Cycle
Every draft model passes variance checks against independent fleet counts, with anomalies re queried. A senior analyst signs off after peer review. We refresh numbers yearly and trigger interim updates when large tenders, regulatory shifts, or technology inflections emerge.
Why Mordor's Unmanned Ground Vehicle Baseline Commands Reliability
Published estimates often diverge because firms mix mobile robots with warehouse AGVs, apply different base years, or freeze currency at outdated exchange rates.
Key gap drivers include scope creep toward retrofit kits, reliance on single source supplier roll ups without civil deployment checks, static ASP assumptions despite rapid sensor price declines, and longer refresh cadences than Mordor's annual cycle.
Benchmark comparison
| Market Size | Anonymized source | Primary gap driver |
|---|---|---|
| USD 3.44 B (2025) | Mordor Intelligence | - |
| USD 3.33 B (2024) | Global Consultancy A | Excludes civil/commercial fleets and uses biennial updates |
| USD 3.05 B (2024) | Industry Journal B | Top down defense budget roll up only; counts AGVs as UGVs |
| USD 2.70 B (2022) | Regional Consultancy C | Outdated base year, conservative scenario, constant currency 2021 conversion |
The comparison shows that once differences in scope, refresh cadence, and price progression are stripped out, Mordor delivers a balanced, traceable baseline grounded in clearly cited variables and a repeatable validation loop that decision makers can rely on.


Key Questions Answered in the Report
What is the 2026 value of the unmanned ground vehicle market?
The unmanned ground vehicle market size reached USD 3.02 billion in 2026.
Which segment is growing the fastest by application?
Civil and commercial deployments, led by warehouse and mining automation, are forecasted to expand at an 8.27% CAGR through 2031.
How large is North America’s share of global revenue?
North America held 39.12% of total revenue in 2025, supported by sizable US defense budgets and Canadian mining projects.
Why are hybrid-electric drivetrains gaining popularity?
Hybrid configurations extend endurance beyond battery only limits, meeting mission requirements that span 8 to 24 hours for defense patrols and mining haulage.
What standards aim to improve UGV interoperability?
ISO 23725:2024 governs autonomous haulage systems, while draft NATO STANAG 4586 annexes seek to harmonize military ground vehicle command protocols.
What is the main technical restraint for long-range missions?
SWaP trade-offs limit battery endurance, prompting interest in hybrid-electric and fuel-cell solutions.
Page last updated on:


