
Market Overview
| Study Period | 2020 - 2031 |
|---|---|
| Forecast Data Period | 2026 - 2031 |
| Base Year Market Size (2025) | USD 10.13 Billion |
| Market Size (2026) | USD 10.57 Billion |
| Market Size (2031) | USD 13.48 Billion |
| Growth Rate (2026 - 2031) | 4.98 % |
| Market Concentration | High |
Major Players *Disclaimer: Major Players sorted in no particular order Image © Mordor Intelligence. Reuse requires attribution under CC BY 4.0. | |
United States Household Refrigerators Market Analysis by Mordor Intelligence
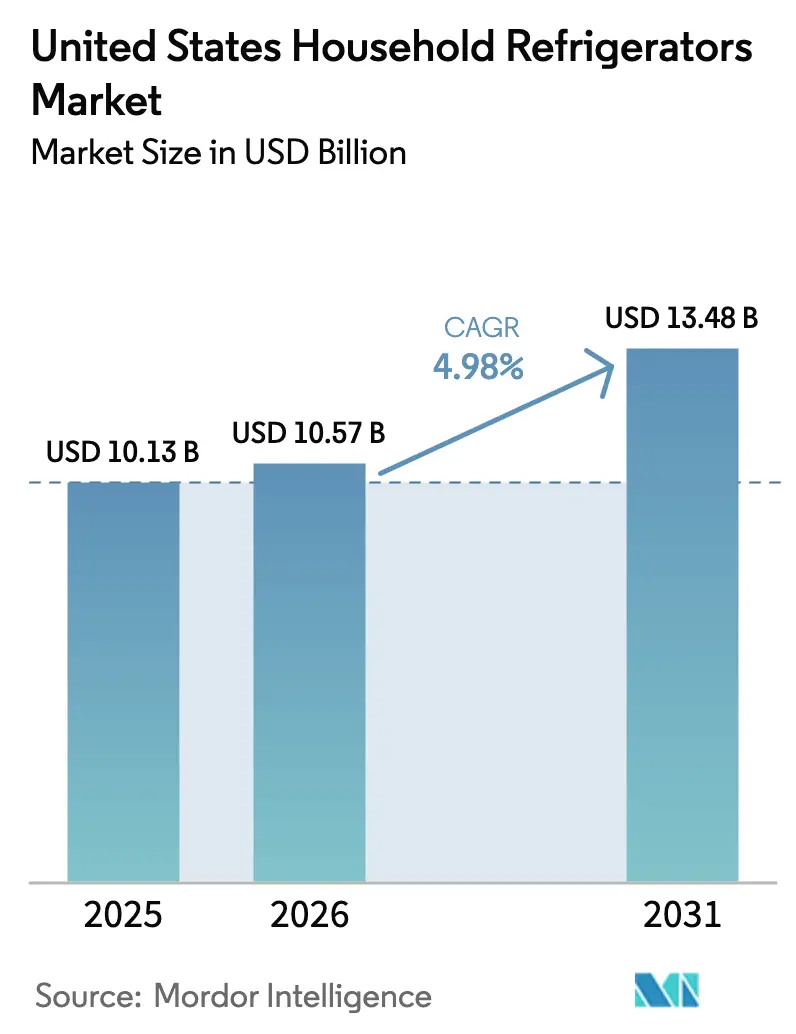
The United States Household Refrigerators Market size was valued at USD 10.13 billion in 2025 and is estimated to grow from USD 10.57 billion in 2026 to reach USD 13.48 billion by 2031, at a CAGR of 4.98% during the forecast period (2026-2031).
Growth is driven by housing-linked replacement cycles, as older units are phased out and new homes are equipped with modern appliances. Premiumization trends, including larger capacities, smart features, and energy-efficient technologies, are encouraging consumers to invest in higher-end models. Regional population growth, particularly in the Southeast and Southwest, fuels household formation, supporting increased refrigerator sales. French-door models are gaining popularity in new construction homes, where larger kitchens demand counter-depth, high-capacity units. Smart and IoT-enabled refrigerators are expanding rapidly, driven by features like touchscreens, WiFi, and voice control, appealing to tech-savvy consumers. Online retail growth, combined with multi-channel strategies from major retailers, is increasing accessibility and convenience for buyers. Supply-chain resilience, including dual sourcing and domestic manufacturing investments, supports consistent product availability despite lingering freight and component pressures.
Key Report Takeaways
- By product type, top-freezer refrigerators accounted for 31.92% of the United States household refrigerators market share in 2025, while French-door models are expanding at a 5.85% CAGR through 2031.
- By capacity, the 19–22.9 cubic-foot range captured 38.91% of the United States household refrigerators market share in 2025, while units of 23 cubic feet or more are advancing at a 5.46% CAGR.
- By technology, Conventional models represented 83.91% of the United States household refrigerators market share in 2025, while Smart / IoT-Enabled models are accelerating at a 6.24% CAGR.
- By distribution channel, online sales are growing at a 6.56% CAGR to 2031, even as multi-brand stores retained 54.43% of the United States household refrigerators market share in 2025.
- By geography, the Southwest is the fastest-growing region at a 6.20% CAGR, whereas the Southeast led with 28.26% of the United States household refrigerators market share in 2025.
Note: Market size and forecast figures in this report are generated using Mordor Intelligence’s proprietary estimation framework, updated with the latest available data and insights as of January 2026.
United States Household Refrigerators Market Trends and Insights
Drivers Impact Analysis*
| Driver | (~) % Impact on CAGR Forecast | Geographic Relevance | Impact Timeline |
|---|---|---|---|
| Large-capacity French-door demand | +1.2% | Southeast, Southwest, West | Medium term (2–4 years) |
| Energy-efficiency rebate programs by United States utilities | +0.6% | California, Northeast, Pacific Northwest | Short to Medium term (1–3 years) |
| Rising smart-home appliance adoption (Wi-Fi & voice) | +0.7% | Urban metros nationwide | Medium term (2–4 years) |
| Millennial household formation surge in Sunbelt states | +0.9% | Texas, Florida, Arizona, Georgia, Carolinas | Medium term (2–5 years) |
| Shift toward premium finishes (stainless & matte black) | +0.4% | Nationwide (higher in affluent suburbs) | Short term (1–2 years) |
| Growth of grocery e-commerce requiring backup storage | +0.5% | Urban & suburban metros | Medium term (2–4 years) |
| Source: Mordor Intelligence | |||
Soaring Demand for Large-Capacity French-Door Models
French-door formats are growing at a 5.85% CAGR, outpacing the United States household refrigerators market by 87 basis points. Builders of homes larger than 2,500 square feet routinely specify counter-depth, 23-plus cubic-foot units that integrate seamlessly with open-plan kitchens. Samsung’s Bespoke series, available with customizable panel finishes and a 32-inch Family Hub+ screen that tracks inventory, underpins premium-segment gains[1]Samsung Newsroom, “Samsung Unveils Bespoke AI Home Appliances at CES 2024,” news.samsung.com. LG reinforces the trend with InstaView doors that illuminate contents on a double-knock and cut cold-air loss by 41%[2]LG Electronics, “LG Refrigerators,” lg.com. Retailers capitalize by dedicating end-cap displays to French-door models, shifting shelf space away from legacy top-freezer units. The format’s larger interior width also accommodates food-service-style sheet pans and bulk purchases from warehouse clubs, dovetailing with consumer stock-up behavior that intensified during the pandemic.
Energy-Efficiency Rebate Programs by United States Utilities
State and utility incentives worth USD 100–250 per qualifying unit accelerate replacement demand for Energy Star-certified refrigerators. The federal Home Energy Rebates initiative authorizes payments up to USD 14,000 for low-income households, compressing payback periods on high-efficiency models. Ohio and Hawaii offer some of the richest utility-level rebates, prompting retailers to increase inventory of 19–22.9 cubic-foot models that exceed federal baselines by at least 15%[3]Energy Star, “Rebate Finder,” energystar.gov. California’s more stringent Title 20 standards require dual-spec designs, raising logistics complexity but positioning compliant manufacturers for an early-mover advantage. Multi-brand stores benefit from in-house energy advisers who guide paperwork, helping them defend their dominant channel share despite rapid e-commerce growth.
Rising Smart-Home Appliance Adoption (Wi-Fi & Voice)
Smart refrigerators are becoming increasingly popular due to Wi-Fi connectivity, voice control, and automated consumables replenishment. These features offer convenience, turning connectivity into a practical benefit rather than a novelty. For instance, GE Appliances unveiled its most advanced smart refrigerator at CES 2026, featuring a built-in barcode scanner that tracks items and automatically updates a digital shopping list. It also includes an AI-powered kitchen assistant for meal planning and expiration alerts, interior cameras for remote inventory checks, and a large touchscreen interface for added convenience[4]Tom’s Guide, “GE Profile just released its smartest fridge yet, with a built-in barcode scanner for seamless grocery shopping,” tomsguide.com. Enhanced security and reliability have reduced consumer concerns about data privacy. Integration with smart-home ecosystems allows users to control temperature and perform tasks via voice commands. Builders are pre-wiring new homes to support connected devices, creating a structural demand for smart appliances. This integration encourages households to adopt smart refrigerators earlier in their replacement cycle.
Millennial Household Formation Surge in Sunbelt States
Industry data shows that the United States household growth averaged about 1.7 million per year between 2019 and 2021, with millennials contributing roughly 640,000 new households annually. By 2023, household formation remained strong at around 1.7 million, highlighting continued demand for housing and related products. A significant share of this growth is concentrated in Sunbelt states like Florida, Texas, Arizona, and Nevada, which attract millennials with affordable housing, job opportunities, and a favorable climate. Millennials moving into these regions often purchase new or upgraded homes, driving demand for modern household appliances, especially refrigerators. Their preferences for energy-efficient, smart, and multifunctional refrigerators align with sustainability and lifestyle trends. Additionally, many millennials are forming families, increasing the need for larger-capacity refrigerators in suburban homes. The shift from rentals to owned homes also contributes to replacement cycles, boosting appliance sales.
Restraints Impact Analysis*
| Restraint | (~) % Impact on CAGR Forecast | Geographic Relevance | Impact Timeline |
|---|---|---|---|
| Supply-chain volatility in compressor and chipsets | –0.6% | Nationwide | Short term (0–2 years) |
| Housing-market slowdown dampening replacement cycles | –0.8% | West Coast, Northeast, high-rate metros | Short to Medium term (1–3 years) |
| Rising average selling prices due to inflationary costs | –0.5% | Nationwide | Short term (0–2 years) |
| Municipal right-to-repair legislation affecting margins | –0.3% | California, New York, Massachusetts | Medium term (2–4 years) |
| Source: Mordor Intelligence | |||
Supply-Chain Volatility in Compressors and Chipsets
Supply-chain challenges continue to impact the United States household refrigerators market. Lead times for compressors and semiconductors remain sensitive to freight costs and geopolitical factors. Many manufacturers rely on multiple suppliers, which can create variability in appliance noise and energy performance. This variability complicates quality control and consistency across product lines. Regulatory shifts toward natural refrigerants are driving the need for new compressor designs. Developing these new designs extends production timelines and adds pressure on manufacturers.
Housing-Market Slowdown Dampening Replacement Cycles
A cooling housing market is affecting refrigerator demand, particularly through the builder and remodel channels. Slower new home construction is reducing orders for major appliance installations in new properties. Existing homeowners are delaying remodels, which traditionally drive a significant share of refrigerator replacements. In higher-priced coastal markets, consumers are extending the lifespan of their appliances, aided by right-to-repair regulations that make replacement less urgent. Builders are also slowing speculative housing starts due to elevated material costs, further reducing appliance demand. These trends limit the frequency of refrigerator upgrades and replacements. Combined, slower new construction and delayed remodels are restraining short- to medium-term market growth.
*Our forecasts treat driver/restraint impacts as directional, not additive. The impact forecasts reflect baseline growth, mix effects, and variable interactions.
Segment Analysis
By Product Type: French-Door Surge Reshapes Portfolio Mix
In 2025, top-freezer units accounted for 31.92% of the United States household refrigerator market share, while French-door models are witnessing significant growth, with a CAGR of 5.85%, driven by builder specifications and consumer demand for full-width shelving. Premium offerings, such as Samsung’s Bespoke and LG’s InstaView, enhance the appeal of high-end French-door units through customizable finishes and smart inventory management features. Meanwhile, side-by-side refrigerators are losing relevance due to their narrow compartments, which are unsuitable for larger platters and cookware. Bottom-freezer models continue to experience stable demand, particularly among older consumers who prioritize ergonomic access to fresh food. Compact refrigerators are emerging as niche products, serving as beverage centers and secondary units in premium homes.
Regulatory changes, including updated Department of Energy standards, are accelerating the phase-out of older top-freezer designs. Simultaneously, the adoption of inverter compressors is gaining traction, enabling consumers to reduce operating costs while improving energy efficiency across the segment. These advancements are reshaping the product mix, with French-door models and energy-efficient technologies driving market evolution. The shift reflects changing consumer preferences and regulatory pressures, positioning premium and energy-efficient models as key growth drivers in the household refrigerator market.




By Capacity: Super-Size Units Gain Traction in New Homes
The 19–22.9 cubic-foot capacity segment held a 38.91% market share in 2025, reflecting its alignment with average household sizes and traditional kitchen layouts, while refrigerators with capacities of 23 cubic feet or more are growing at a CAGR of 5.46% through 2031, driven by the increasing prevalence of new-build homes in Sunbelt states that accommodate counter-depth French-door formats. While these larger units consume more energy, many qualify for rebates that offset operating costs. Features such as reinforced glass shelving, designed to support bulk grocery purchases, have become standard, catering to the needs of modern households.
Builders and manufacturers anticipate sustained demand from move-up buyers, typically aged 35–50, who prioritize storage capacity and convenience over minor increases in energy consumption. This demographic trend underscores the long-term growth potential of larger-capacity refrigerators. The market is expected to continue evolving as consumer preferences shift toward appliances that combine functionality with energy efficiency, further solidifying the position of super-size units in the household refrigerator segment.
By Technology: Smart Models Accelerate Despite Premium Pricing
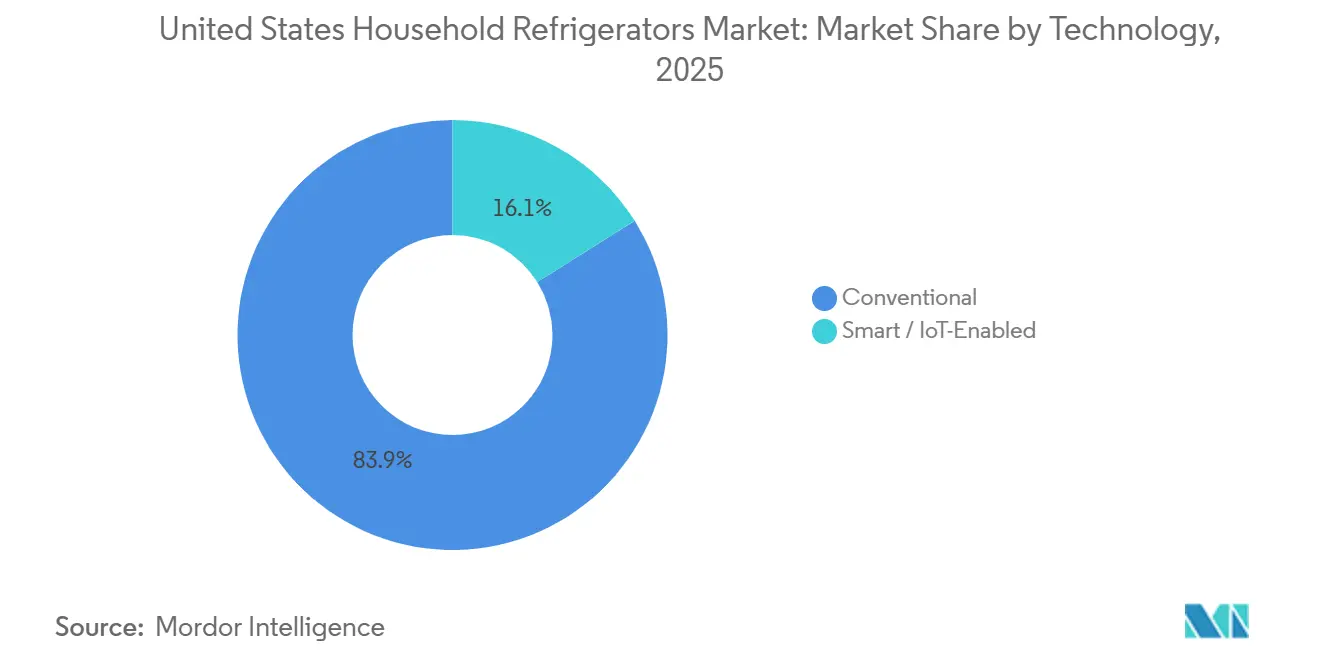
Conventional refrigerators dominated the market in 2025, accounting for 83.91% of shipments, while smart/IoT-Enabled models, with a 16.09% market share, are projected to expand at a 6.24% CAGR through 2031, growing faster than the overall United States household refrigerator market. Leading products, such as Samsung’s Family Hub+ touchscreen, are enhancing kitchen connectivity with features like recipe suggestions and streaming services. GE’s Wi-Fi-enabled Profile series automates filter reorders, improving maintenance convenience and generating additional aftermarket revenue. LG’s ThinQ AI, offering voice-controlled functions such as Craft Ice production, further strengthens the appeal of premium refrigerators.
Despite higher manufacturing costs due to increased semiconductor content, builder pre-installations and strong consumer demand for remote monitoring are supporting pricing power for smart models. Additionally, cybersecurity certifications and robust data protection measures are fostering consumer trust in these appliances. The growing adoption of smart refrigerators reflects a broader trend toward connected home technologies, positioning these models as a key growth area in the market.
By Distribution Channel: Online Gains Ground Despite Delivery Complexity
In 2025, multi-brand stores retained a 54.43% market share, leveraging in-store consultations and turnkey installations to address the logistical challenges of moving heavy appliances. Online channels, however, are growing at a CAGR of 6.56%, driven by platforms like Amazon and brand-direct websites that offer configuration options unavailable in physical stores. Hybrid models, such as buy-online-pick-up-in-store services, cater to consumers who prefer inspecting products physically while enjoying the convenience of online ordering. Partnerships with third-party installers are mitigating delivery challenges for e-commerce purchases, although return rates remain higher compared to in-store sales.
Traditional retailers are employing strategies such as trade-in credits and zero-percent financing to maintain their market share amid rising online penetration. The shift toward online channels highlights the evolving consumer preference for convenience and customization. As e-commerce continues to grow, the integration of hybrid distribution models and enhanced delivery solutions is expected to play a critical role in shaping the future of the household refrigerator market.
Geography Analysis
The Southeast United States led with 28.26% of 2025 shipments, driven by population inflows into Florida and other fast-growing Sunbelt states. Humid climates in the region boost demand for refrigerators with advanced moisture-control crispers, as seen in premium lines like LG’s InstaView. Open-plan homes in the broader Sunbelt increasingly specify counter-depth French-door models above 23 cubic feet, aligning with modern kitchen layouts. Secondary growth in Georgia and North Carolina supports steady sales of mid-size units to first-time buyers. Utility rebates in Florida further encourage early replacement, sustaining overall market activity.
The Southwest United States is also the fastest-growing region with a 6.20% CAGR to 2031, led by household formation in Arizona and Nevada. Hot climates, such as Phoenix’s extreme summers, reduce compressor lifespans, driving higher replacement rates and adoption of variable-speed compressors to manage electricity costs. Las Vegas’ hospitality-driven demand for compact units also contributes to regional growth, while New Mexico and Oklahoma add incremental volume through rural top-freezer sales. In the West, California, Washington, and Oregon emphasize energy efficiency and premium aesthetics, with regulations like California’s Title 20 fostering adoption of high-margin counter-depth French-door models. Rebates and early incentives encourage the uptake of smart and energy-efficient units, particularly among tech-savvy consumers in Silicon Valley and Seattle, despite high housing costs.
Growth in the Midwest is modest, constrained by stable populations and aging housing stock. Top-freezer models remain prevalent in rural areas, where affordability takes priority over connected features. Incentives such as Ohio’s efficiency rebates support incremental replacements, while right-to-repair laws prolong appliance lifespans, limiting overall demand. The Northeast faces similar challenges, with high home prices delaying first-time purchases. Nevertheless, premium remodels in metropolitan areas like New York and Boston sustain demand for counter-depth units that integrate with custom cabinetry.
Value Chain Analysis
The United States household refrigerator value chain starts with upstream inputs and components such as steel, plastics, insulation foams, copper wiring, compressors, and an increasing share of electronics (sensors, displays, connectivity modules) for smart models. Brands and OEMs run a midstream assembly model, combining sourced components with in-house design, software, and quality systems, while also managing exposure to compressor and semiconductor availability that can affect lead times and model consistency.
In the downstream part of the chain, finished units move through multi-brand appliance stores, exclusive brand outlets, and fast-growing e-commerce supported by third-party logistics for delivery, installation, and haul-away. Manufacturers are tightening supplier relationships and shifting parts and finished-goods flows closer to U.S. plants to reduce freight and inventory risk, including GE Appliances' USD 3 billion, five-year U.S. manufacturing investment that includes moving six 22 cu. ft. top-freezer refrigerator models into its Decatur, Alabama operation. After-sales service, extended warranties, and parts availability have also gained weight as right-to-repair momentum supports repairability and longer product lifecycles in some states.
Competitive Landscape
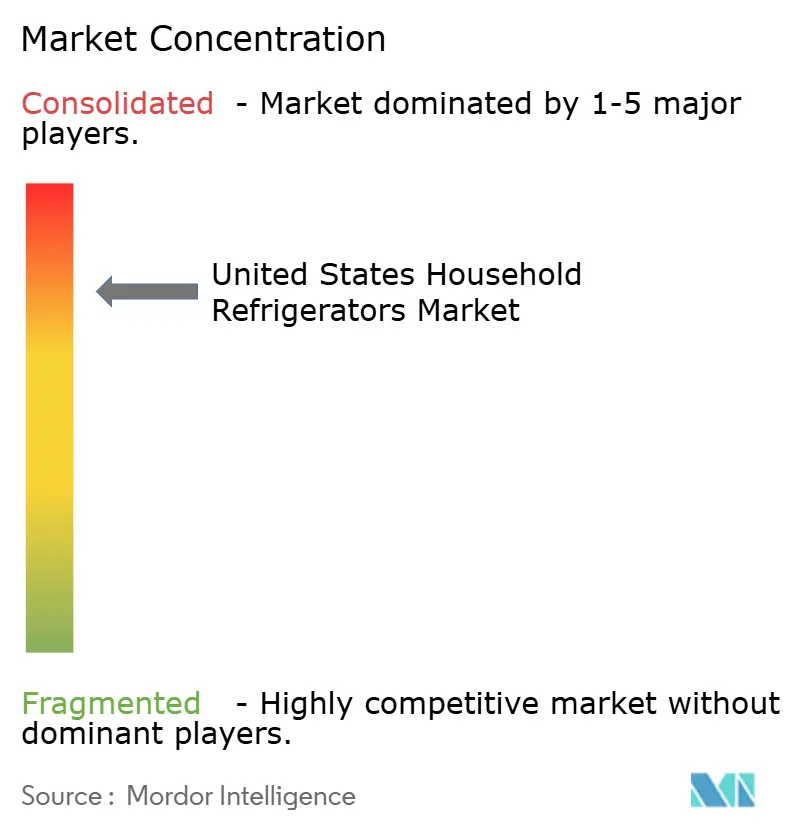
The United States household refrigerators market is highly concentrated, with a handful of major players controlling most shipments. Whirlpool maintains a broad portfolio spanning value to premium brands, supported by domestic manufacturing investments to sustain scale and competitiveness. GE Appliances leverages strong relationships with builders to secure premium placements in higher-end homes, maintaining above-average margins. Samsung and LG focus on smart platforms and differentiated designs, winning premium shelf space and appealing to tech-savvy consumers. Barriers to entry remain high due to capital-intensive platform development and the scale required to compete effectively.
Ultra-premium brands like Sub-Zero and Viking occupy niche segments, targeting high-end remodels and custom kitchens where appliances integrate seamlessly with cabinetry. These players focus on specialized features and design differentiation to maintain relevance despite small volumes. Right-to-repair legislation has begun extending appliance lifespans, slightly dampening replacement cycles across all segments. Leading brands counter potential demand erosion with extended warranties, subscription services, and after-sales programs that enhance customer loyalty. The bifurcation of the market is evident, with smart appliance leaders capturing premium positioning, while conventional models continue to face competitive pressure from retailer private labels.
Technology adoption is a key differentiator in the market, with smart IoT-enabled refrigerators commanding consumer attention and premium placements. Cybersecurity certifications and innovative features, such as voice-activated or specialized cooling functions, help brands maintain a competitive edge. Capital-intensive development requirements limit the number of new entrants, keeping the market concentrated. Established players leverage scale, design innovation, and distribution partnerships to protect their positions. Overall, the United States household refrigerators market is defined by high concentration, strong brand differentiation, and strategic investments in technology and premium offerings.
United States Household Refrigerators Industry Leaders
Whirlpool Corporation
GE Appliances (Haier)
Samsung Electronics
LG Electronics
Electrolux (Frigidaire)
- *Disclaimer: Major Players sorted in no particular order

Market Opportunities and Future Outlook
Energy-efficiency and refrigerant transitions point to product-refresh whitespace as manufacturers align roadmaps with federal rulemaking timelines and refrigerant acceptability under EPA programs. The U.S. Department of Energy finalized updated energy conservation standards for residential refrigerators and freezers in January 2024, with compliance dates starting in 2029 or 2030 by product class. That schedule requires redesign of platforms, compressors, and controls. On refrigerants, EPA actions under the Significant New Alternatives Policy (SNAP), including a November 2025 proposal to list HCR 4141 as an acceptable substitute for household refrigerators and freezers, reinforce the move toward next-generation refrigerants and the supporting component ecosystems.
Domestic capacity and component localization are also showing up as a practical opportunity tied to supply-chain resilience and faster model changeovers, particularly for high-volume top-freezer production and for French-door configurations that are expanding quickly. In April 2026, GE Appliances completed a USD 28 million upgrade at its Decatur, Alabama refrigeration plant, adding automated thermoforming equipment to increase top-freezer production capability. Whirlpool also announced a USD 60 million investment to convert a Perrysburg, Ohio facility into an additional U.S. factory focused on appliance components and subassemblies. These steps broaden U.S.-based sourcing options for cabinets, liners, and subassemblies, and they support multi-channel fulfillment needs as online purchasing grows alongside retailer installation and haul-away services.
Recent Industry Developments
- April 2026: GE Appliances completed a USD 28 million investment at its Decatur, Alabama refrigeration plant, adding automated thermoforming machines to expand capability for top-freezer refrigerator production. The upgrade supports higher-throughput manufacturing and tighter control over key formed parts used in cabinet and liner systems. It also strengthens the company's domestic production footprint for high-volume models as retailers demand faster replenishment.
- August 2025: GE Appliances announced a USD 3 billion, five-year investment program to expand and modernize U.S. manufacturing, including plans to insource additional top-freezer production at its Decatur, Alabama facility. The investment strengthens domestic manufacturing scale and supply-chain localization.
- May 2024: Whirlpool Corporation expanded its Feel Good Fridge program through collaboration with HelloFresh and Total Quality Logistics to place refurbished refrigerators into food-insecure communities. The initiative supports secondary-market refurbishment and reverse-logistics capabilities that complement new-unit sales and trade-in activity. It also reinforces the role of partners that can manage collection, refurbishment routing, and last-mile delivery for bulky appliances.


Research Methodology Framework and Report Scope
Market Definition and Coverage
This market is defined as revenue generated from new household refrigerator units sold for residential use in the United States, captured in USD for the given year.
Scope exclusions: It excludes commercial refrigeration equipment, stand-alone freezers, used and refurbished unit resale, and aftermarket parts and repair-only services.
Segmentation Overview
- By Product Type
- Single Door Refrigerators
- Top-Freezer Refrigerators
- Bottom-Freezer Refrigerators
- Side-by-Side Refrigerators
- French-Door Refrigerators
- Compact & Mini Refrigerators
- By Capacity (cu. ft.)
- Less Than 15
- 15 – 18.9
- 19 – 22.9
- Greater Than Equal To 23
- By Technology
- Conventional
- Smart / IoT-Enabled
- By Distribution Channel
- Multi-brand Stores
- Exclusive Brand Outlets
- Online
- Other Distribution Channels
- By Region
- Northeast
- Southeast
- Midwest
- Southwest
- West
Data Sources, Market Sizing, and Validation
Desk Research
Desk research was used to map the demand pool and the pricing context for household refrigerators, before assumptions were finalized. Public sources that helped ground the model included US Census Bureau releases (including trade statistics), Bureau of Labor Statistics inflation and price series, US Department of Energy information on refrigerator efficiency standards and test procedures, and energy price context from the US Energy Information Administration.
We also reviewed company filings and investor presentations, reputable retailer and association websites, and product certification references where available to understand feature adoption and shelf pricing behavior. A limited set of paid subscriptions was used mainly for company financials, patent lookups, and shipment-level import checks when public reporting was too aggregated. These desk sources are illustrative rather than exhaustive, since many other public documents and databases were reviewed as well, to collect, validate, and clarify inputs.
Primary Interviews and Surveys
Interviews and surveys with manufacturers, distributors, retailers, and service specialists in the United States are used to test shipment direction, replacement timing, channel movement, promotional pricing, smart refrigerator adoption, and gaps in secondary evidence. Respondents also help clarify where retail activity and manufacturer shipments point in different directions before the assumptions and final estimates are triangulated.
Distribution of primary research fieldwork respondents
| Company type | Respondent position |
|---|---|
| Top tier: 25% | CXOs: 15% |
| Mid tier: 55% | Functional/Unit leaders: 30% |
| Smaller Players: 20% | Managers: 55% |
Market-Sizing & Forecasting
The sizing model starts with a top-down rebuild of annual refrigerator unit demand in the United States, and then value is derived using an average selling price (ASP) curve that reflects common formats and feature tiers. After that, results are corroborated with selective bottom-up approximations, such as sampled unit flows by channel and reasonableness checks using trade and supplier signals, which are then used to fine-tune totals where needed.
Inputs used in the market build include household formation and housing turnover, replacement cycle timing, mix shift between standard and feature-rich models, energy-efficiency driven price premiums, and observed inflation and raw material pressure that flows into appliance pricing. ASP movement is not treated as a flat growth rate because promotions, model refresh timing, and larger-capacity mix can move realized pricing up or down in the same year. For forecasting, scenario analysis was used with short trend models, and the scenarios were anchored to expert views on demand stability, pricing behavior, and regulation-related redesign timing. Where unit detail is incomplete by channel, gaps are handled by applying validated share splits from interviews and checking that implied totals remain consistent with independent market signals.
Data Validation & Update Cycle
Validation is done through multiple checks because any one data series can be noisy in a given year. We compare model outputs against independent indicators such as category price trends, import intensity, and visible product-cycle timing, and then anomalies are reviewed in a separate pass before sign-off.
If a large variance persists, follow-up outreach is triggered to re-check the assumptions that drive it, most often the ASP ladder, channel mix, or replacement timing. Reports are refreshed annually, with interim updates when a material event changes demand or pricing conditions. Before delivery, a fresh pass is completed so clients receive numbers aligned with the latest data releases and confirmed market signals.
Mordor Intelligence's Unites States Household Refrigerators Market Size Compared With Other Published Estimates
Published market sizes for US household refrigerators can look far apart because the scope and timing choices are not aligned, even when the category name sounds similar. The biggest swings usually come from whether the estimate includes only refrigerators or also folds in adjacent cold-storage products, and whether value is built from unit demand first or from broader appliance revenue pools and then narrowed down.
Year-to-year refresh cadence also matters, since promotional pricing, feature upgrades, and unit mix shifts can change realized ASPs quickly. When the model is refreshed with the latest price series and import checks, and ASPs are adjusted for promotions and configuration mix using January 2026 inputs, Mordor Intelligence keeps the 2025 value anchored to observable signals rather than a smoothed price path.
Benchmark comparison
| Source | Market Size | Gaps in Research Methodology |
|---|---|---|
| Mordor Intelligence | USD 10.13 B (2025) | |
| Industry Publisher A | USD 11.56 B (2024) | Uses a different base year and appears to apply a longer forecast smoothing across years, which can understate short-term promotional ASP dips and mix shifts visible in recent pricing signals. |
| Industry Publisher B | USD 29.30 B (2024) | Combines household refrigerators with freezers and likely includes adjacent cold-storage categories, which expands the revenue pool compared with refrigerators-only sizing. |
The table suggests that scope boundary and timing of pricing inputs explain most of the spread, more than any single growth assumption. When definitions stay tight to household refrigerators and the ASP curve reflects promotions and configuration mix, the resulting number becomes easier to trace back to repeatable variables and to update each year.


Key Questions Answered in the Report
How big is the United States household refrigerator market in 2026?
The market is estimated at USD 10.57 billion in 2026 and is projected to reach USD 13.48 billion by 2031.
What is the forecast CAGR for household refrigerators in the United States?
A compound annual growth rate of 4.98% is expected between 2026 and 2031.
Which refrigerator format is growing the fastest?
French-door models are advancing at a 5.85% CAGR, outpacing the overall market.
Which region shows the highest growth rate?
The Southwest is the fastest-growing region, projected at a 6.20% CAGR through 2031.
Page last updated on:


 Your data is secure and never sold or shared.


