United States Tire Manufacturing Equipment Market Size and Share
Market Overview
| Study Period | 2019 - 2030 |
|---|---|
| Forecast Data Period | 2025 - 2030 |
| Historical Data Period | 2019 - 2023 |
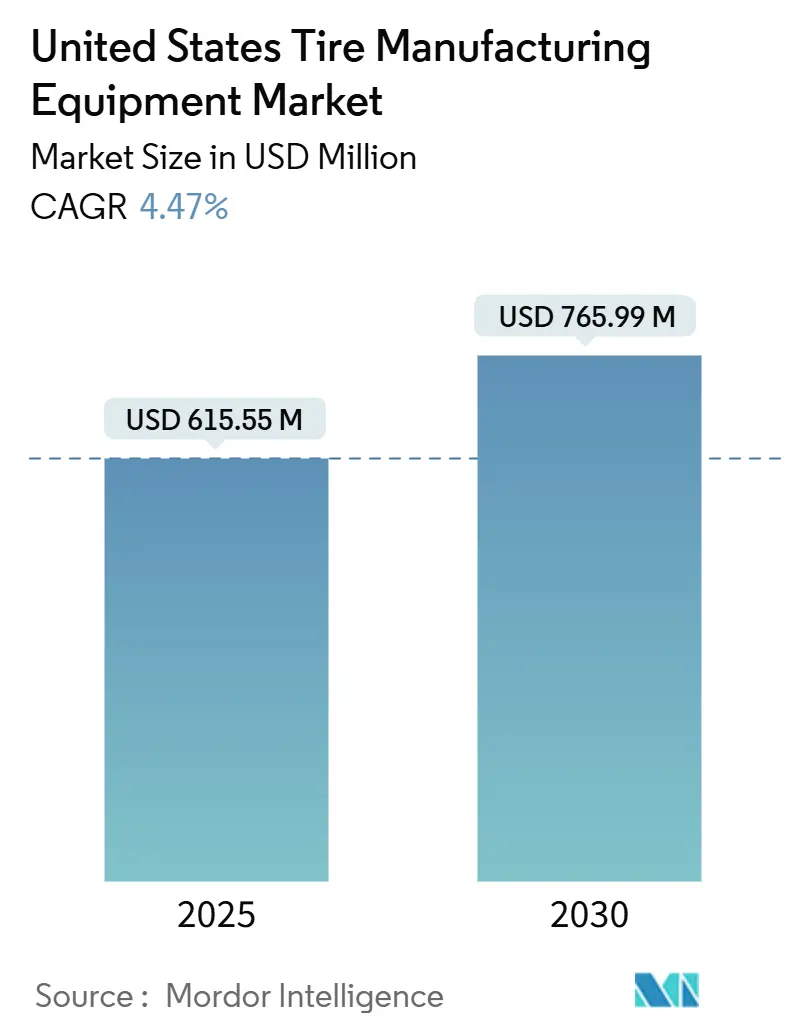
| Market Size (2025) | USD 615.55 Million |
| Market Size (2030) | USD 765.99 Million |
| Growth Rate (2025 - 2030) | 4.47% CAGR |
| Market Concentration | High |
Major Players
*Disclaimer: Major Players sorted in no particular order Image © Mordor Intelligence. Reuse requires attribution under CC BY 4.0. |
|
United States Tire Manufacturing Equipment Market Analysis by Mordor Intelligence
The U.S. tire manufacturing equipment market size stood at USD 615.55 million in 2025 and is on track to reach USD 765.99 million by 2030, advancing at a 4.47% CAGR. Sustained domestic capacity expansion, rising adoption of Industry 4.0 production models, Section 48C investment tax credits, and the ongoing shift toward radial construction in commercial tires are the principal forces supporting this trajectory. Major manufacturers have committed huge investments to facility upgrades slated for completion between 2025 and 2028, a modernization wave that is already stoking orders for advanced building, curing, and inspection machinery. Stricter end-of-line testing mandates from federal regulators are pushing quality-control automation, while replacement demand, responsible for two-thirds of domestic tire shipments, keeps aftermarket service equipment spending elevated. Despite these positives, high upfront capital requirements and skilled-labor gaps temper near-term momentum, creating an environment in which modular, sensor-enabled systems and vendor-financing models gain favor.
Key Report Takeaways
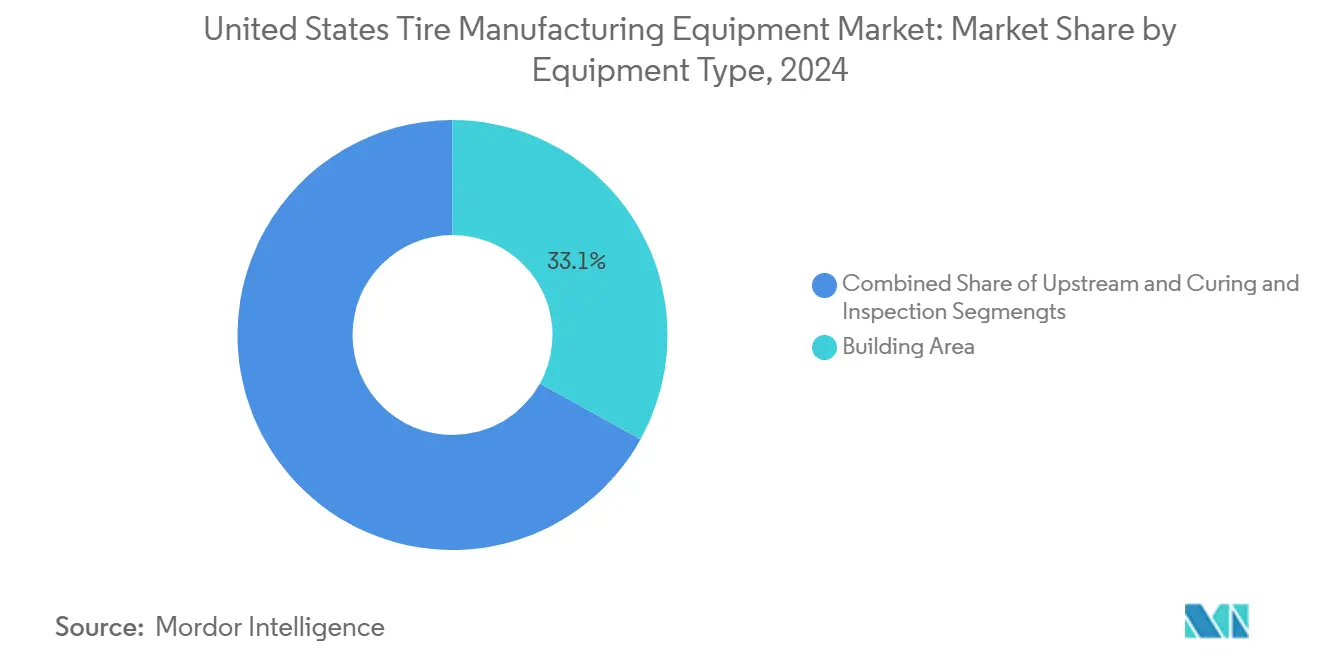
- By equipment type, Building Area machinery captured 33.06% of U.S. tire manufacturing equipment market share in 2024, whereas Curing & Inspection is projected to record a 10.03% CAGR through 2030.
- By tire design, radial-construction systems held 85.45% of the U.S. tire manufacturing equipment market size in 2024 and are projected to post a 5.32% CAGR to 2030.
- By vehicle type, passenger-car equipment commanded 40.82% revenue in 2024, while off-road vehicle lines expand fastest at a 6.86% CAGR.
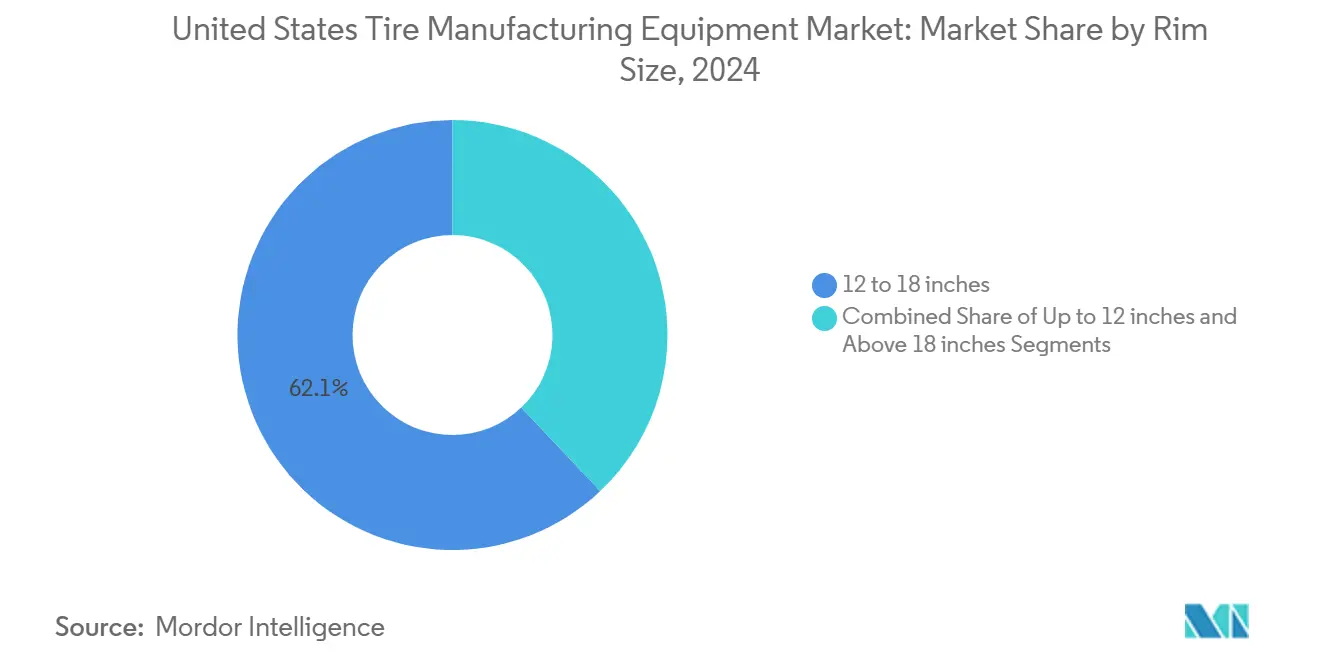
- By rim size, the 12–18 inch category accounted for 62.07% of the U.S. tire manufacturing equipment market size in 2024; equipment serving rims above 18 inches leads growth at 7.57% CAGR.
- By end user, the replacement segment dominated with 67.19% share in 2024; OEM-focused investments are projected to advance at the highest 6.04% CAGR.
Worldwide, activity is shaped by contributions from multiple countries and regions, with United states representing one among them. The global report on tire manufacturing equipment market by Mordor Intelligence reflects how these countries and regional layers combine into a single system.
United States Tire Manufacturing Equipment Market Trends and Insights
Drivers Impact Analysis*
| Driver | (~) % Impact on CAGR Forecast | Geographic Relevance | Impact Timeline |
|---|---|---|---|
| Capacity-Expansion Wave | +1.8% | Texas, Tennessee, Oklahoma, North Carolina | Medium term (2-4 years) |
| Industry 4.0-Enabled Tire Plants | +1.2% | Michigan, Ohio, South Carolina, Georgia | Long term (≥ 4 years) |
| Section 48C Tax Credits | +0.9% | All U.S. states with manufacturing facilities | Short term (≤ 2 years) |
| Commercial-Vehicle Radialization | +0.7% | California, Texas, Illinois, Pennsylvania | Medium term (2-4 years) |
| Stricter DOT Testing Mandates | +0.5% | All U.S. states under federal jurisdiction | Short term (≤ 2 years) |
| Tire-Component Supply Chains Reshoring | +0.4% | Great Lakes region, Southeast manufacturing belt | Long term (≥ 4 years) |
| Source: Mordor Intelligence | |||
Capacity-Expansion Wave Among U.S. Tire Makers
Domestic producers are midway through the largest build-out in decades. Hankook’s Tennessee project alone doubles the plant footprint and adds truck-and-bus radial capacity, while Goodyear directs a significant amount toward high-performance passenger-tire output. Such commitments raise demand for next-generation building machines, large-cavity curing presses, and automated inspection systems that can be installed in modular phases to minimize downtime. State-level incentives complement federal credits, amplifying purchasing power and compressing equipment-replacement cycles.
Surge in Industry 4.0-Enabled Smart Tire Plants
Artificial-intelligence inspection, sensor-embedded presses, and MES platforms are shifting factory operations from reactive to predictive. Early adopters report scrap reductions and throughput gains that offset equipment premiums. Vendors now bundle analytics dashboards and remote-diagnostics packages at no extra cost, aware that data-rich capability is becoming a purchase prerequisite. Clustering near Midwest tech hubs ensures fast integration support, giving domestic suppliers an edge over offshore competitors.
Section 48C Tax Credits for Advanced Manufacturing Equipment
The Inflation Reduction Act reinstated a 30% credit on qualified capital expenditures, with USD 6 billion still available for allocation. Tire makers pursuing low-carbon, high-efficiency projects can stack these credits with state programs, effectively lowering payback periods below four years[1]Internal Revenue Service. "Advanced Manufacturing Production Credit." irs.gov. Proposal scoring favors energy-savings metrics, steering buyers toward high-efficiency mixers, closed-loop curing systems, and regenerative-braking test rigs.
Shift Toward Radialization in Commercial-Vehicle Segment
Radial tires already dominate fleet fitment, yet conversion of remaining bias niches continues. Radial lines require steel-belt preparation, zero-splice tread placement, and high-tonnage bead winding, all of which push orders for precision-servo equipment. Fleet fuel-economy regulations further accelerate radial take-up, locking in fresh demand for specialized presses, X-ray scanners, and shearography systems tailored to heavy-duty casings.
Restraints Impact Analysis*
| Restraint | (~) % Impact on CAGR Forecast | Geographic Relevance | Impact Timeline |
|---|---|---|---|
| High CAPEX | -1.5% | All U.S. manufacturing regions | Short term (≤ 2 years) |
| Raw-Material Price Volatility | -1.1% | Texas, Michigan, Ohio, Tennessee | Medium term (2-4 years) |
| Skilled Technician Shortage | -0.8% | Rust Belt states, Southeast manufacturing corridor | Long term (≥ 4 years) |
| Low-Cost Machinery Imports Influx | -0.6% | West Coast ports, Great Lakes region | Medium term (2-4 years) |
| Source: Mordor Intelligence | |||
Very High Upfront CAPEX for New Lines
U.S. facilities face financing barriers in tire manufacturing, with complete line installations demanding investments between USD 50-100 million. This hefty price tag often delays equipment purchases, leading many to opt for incremental upgrades instead of pursuing comprehensive modernization projects. Phased retrofits ease the burden but stretch modernization timelines. Equipment vendors counter with lease-and-service models, yet total cost of ownership often rises, leaving some projects shelved until credit access improves.
Raw-Material Price Volatility Depressing OEM Cap-Spend
U.S. tire manufacturers are prioritizing working capital preservation over equipment investments due to a 33% surge in natural rubber prices in early fiscal 2024 and fluctuations in synthetic rubber costs, which are being driven by constraints in butadiene supply[2]Crisil. "Inflated Natural Rubber Prices to Puncture Tyre Maker Margins." crisil.com. When input costs spike, management shifts focus to cash preservation and inventory hedging, pushing automation projects into future budget cycles. Tariff uncertainty on imported feedstocks adds another layer of risk, entrenching wait-and-see behavior across the buyer base.
*Our forecasts treat driver/restraint impacts as directional, not additive. The impact forecasts reflect baseline growth, mix effects, and variable interactions.
Segment Analysis
By Equipment Type: Building Area Remains the Anchor Segment
Building Area systems accounted for 33.06% of U.S. tire manufacturing equipment market share in 2024, a testament to their central role in carcass assembly, belt application, and ply positioning. High-precision servo drives, automatic splice control, and recipe-change algorithms now differentiate premium offerings. Radial-specific belt feeders support the ongoing move away from bias designs, keeping demand resilient even as upstream mixers and extruders stabilize. Vendors are integrating edge-computing modules that monitor drum wear and torque loads to flag maintenance windows, reducing unscheduled downtime.
Curing & Inspection leads growth at 10.03% CAGR. Regulatory emphasis on traceability drives adoption of IoT-linked presses that log mold temperature profiles and dwell times. Inline shearography, X-ray, and AI-vision stations record every finished tire’s genealogy, satisfying record-retention requirements that doubled from five to ten years in 2024. With inspection accuracy now hitting 99.96%, producers accept higher capital costs in exchange for fewer recalls and warranty claims.


By Tire Design: Radial Dominance Endures
Radial-line machinery represented 85.45% of 2024 revenue. Steel-cord calenders, twin-stage builders, and segmented presses tailored to low-profile casings headline recent orders. With a 5.32% CAGR, the radial segment signals a shift away from bias-ply construction in select U.S. applications. This trend is especially pronounced in specialized commercial vehicle fleets, where tightening fuel efficiency regulations are pushing for modernization. Radial tire manufacturing method's fuel efficiency advantages and load-carrying capabilities ensure continued market preference despite higher manufacturing complexity.
Bias-line equipment serves niche segments, agriculture, vintage autos, military, where rugged carcasses trump ride comfort. Purchases focus on refurbishment rather than new installs. As U.S. manufacturers increasingly embed Industry 4.0 capabilities into their high-volume radial production lines, the technological divide between radial and bias equipment is expanding. This trend solidifies the radial segment's lead in the domestic equipment market, a position expected to persist throughout the forecast period.
By Vehicle Type: Passenger Vehicles Set the Volume Base
Passenger-tire lines delivered 40.82% of 2024 sales, underpinned by mass-market sedan and crossover production. EV adoption is reshaping tooling specs: wider molds, lower rolling-resistance compounds, and acoustically tuned tread designs demand adaptable mixing and extrusion modules. Vendors supply quick-change molds and programmable injections that support small-lot customization without sacrificing takt time.
Off-road tire systems post the briskest 6.86% CAGR, propelled by mining and construction fleet expansions. These extra-large presses require clamping forces exceeding 500 tons, heavy-gauge steam bladders, and extended mold-cooling circuits. Suppliers leverage specialty-steel alloys and predictive-maintenance software to boost uptime in remote locations, capturing premium margins.
By Rim Size: Mid-Range Dominates While Large Diameters Accelerate
Lines configured for 12–18 inch rims absorbed 62.07% of 2024 U.S. tire manufacturing equipment market share, anchoring demand with their high-volume, standardized production profile. Standard footprints let factories reuse tooling across multiple SKUs, which lifts asset-utilization rates and trims per-unit costs. Automated green-tire handling, quick-index bead seaters, and recipe-driven mold changes shorten cycle times without compromising quality. Vendors increasingly embed edge analytics to monitor drum vibration and clamp pressure, extending maintenance intervals. These features keep the segment’s replacement-cycle velocity steady even as other categories fluctuate.
Equipment serving rims above 18 inches is projected to grow at a 7.57% CAGR, well ahead of overall U.S. tire manufacturing equipment market size expansion, driven by sport-utility and performance-vehicle trends that favor larger wheel aesthetics. Larger cavities, dual-stage curing profiles, and robot-assisted loading mitigate ergonomic risks while preserving takt times in high-mix environments. Suppliers deploy specialty-steel alloys and active cooling circuits to maintain dimensional accuracy on low-profile tires that run hotter. Up-to-12-inch machinery remains relevant for compact cars and motorcycles, yet orders focus on refurbishments rather than new installs. Overall, rim-size diversification pushes makers toward modular presses that swap molds quickly to balance throughput across size tiers.
By End-User: Replacement Still Rules as OEM Integration Rises
Replacement-focused lines captured 67.19% of 2024 U.S. tire manufacturing equipment market share, reflecting short three-to-six-year tire lifecycles and a national vehicle parc that averages 12.6 years in service. Independent dealers, fleet garages, and national service chains continue to order high-speed balancers, laser tread-depth scanners, and low-profile service lifts that support rapid turnover. Aging vehicles boost demand for retreading buffers and inspection rigs, extending service operations’ capital budgets. Vendors differentiate through cloud-linked diagnostics that help shop owners schedule maintenance and avoid unplanned downtime. These features align with workforce constraints by simplifying operator training.
OEM-oriented spending is advancing at a 6.04% CAGR as automakers bake tire-performance targets into vehicle development timetables, raising the bar on in-plant testing and traceability. Original-equipment lines now specify force-variation analyzers, multi-axis drum testers, and RFID-enabled identification to confirm every tire meets model-specific ride and noise thresholds. Tier-one suppliers court carmakers with co-located pilot cells that validate compounds and tread patterns before scale-up, locking in multi-year tooling contracts. Equipment builders respond with turnkey cells that integrate pressing, curing, and inline inspection around digital twins, cutting prototype lead times by half. Although smaller in absolute volume, OEM demand carries premium margins and long service-agreement tails that stabilize vendor revenue streams.
Geography Analysis
Traditional manufacturing corridors continue to dominate U.S. tire manufacturing equipment demand. Tennessee leads recent capital commitments, anchored by Hankook’s USD 1.6 billion expansion that adds truck-and-bus radial capacity and installs next-generation curing presses. Oklahoma follows with Goodyear’s USD 320 million modernization geared toward premium passenger-tire lines, reinforcing the state’s logistics advantages and skilled-labor pool. Texas retains its historic role as a high-volume production hub, drawing on its integrated petrochemical supply chain to support mixing and compounding investments.
The Great Lakes cluster, including Michigan and Ohio, hosts mature factories upgrading legacy lines with MES platforms and automated inspection suites. Proximity to automotive OEMs fosters just-in-time supply models, making reliability and uptime critical equipment-selection criteria. Vendors with field-service engineers in these states command pricing premiums, while workshops gain from established apprenticeship programs that partially ease technician shortages.
The Southeast belt, North Carolina, South Carolina, Georgia, shows rapid greenfield activity driven by favorable tax policy and right-to-work statutes. Foreign entrants take advantage of streamlined permitting to build smart plants from the ground up, incorporating Industry 4.0 features such as digital twins and autonomous material handling. Meanwhile, West Coast facilities adapt to environmental regulations and electrification trends, demanding low-emission mixers and energy-efficient curing. However, proximity to Pacific ports heightens exposure to low-cost machinery imports, intensifying price pressure on domestic suppliers.
Mordor Intelligence provides coverage of the tire manufacturing equipment market across other key regional markets, including Europe, each with their regulatory frameworks and demand patterns. Detailed country-level analysis extends to China, South Korea, and Japan incorporating local coverage and market participation, as required.
Competitive Landscape
First-tier multinational equipment builders hold a significant presence, yet competitive intensity is rising. HF TireTech Group tops the market through breadth of portfolio and turnkey project capability. VMI Group’s specialization in highly automated building drums secures longstanding relationships with premium tire brands. MESNAC leverages cost-effective integrated lines to court price-sensitive buyers, while Kobe Steel excels in high-accuracy wire-calendering modules vital for steel-belt production. Bartell Machinery adds depth in bead-assembly technologies.
Technological partnerships blur traditional boundaries. Software providers embed analytics engines inside presses, enabling predictive-maintenance contracts that generate recurring revenue. Machine-vision specialists license AI defect-recognition algorithms to equipment OEMs, accelerating feature uptake. Sustainability also shapes rivalry: suppliers tout nitrogen-heated presses, low-VOC extrusion feeds, and energy-recovery drives to align with corporate carbon goals. Domestic mid-size firms carve out niches in custom retrofits and rapid-service commitments, capitalizing on proximity advantages when global players face import delays or tariff drag.
Looking ahead, white-space exists in compact, fully automated micro-factories designed for localized production runs, an approach that mitigates logistics emissions and aligns with on-demand fleet maintenance models. Entrants able to integrate robotic material handling, end-to-end traceability, and real-time energy optimization may disrupt incumbents, particularly if they address the skilled-labor deficit through remote-support architectures.
United States Tire Manufacturing Equipment Industry Leaders
-
HF TireTech Group
-
VMI Group
-
MESNAC
-
Kobe Steel
-
Bartell Machinery Systems
- *Disclaimer: Major Players sorted in no particular order

Recent Industry Developments
- January 2025: Hankook Tire unveiled the iON HT, a highway-terrain tire engineered for electric light-duty trucks.
- August 2024: Bridgestone committed JPY 25 billion (USD 208 million) to expand off-the-road tire capacity at its Kitakyushu plant.


United States Tire Manufacturing Equipment Market Report Scope
| Upstream (Mixer and Component Preparation) | Mixing Machines / Rubber Mixers |
| Calendaring Machines | |
| Extrusion Machines | |
| Cutting Machines | |
| Others (Cooling Units, etc.) | |
| Building Area | Bead Winding Machine |
| Tire Building Machine | |
| Others (Strip Winding Machine, etc.) | |
| Curing and Inspection (Testing Area) | Curing Press Machines |
| Tire Painting Machines | |
| Others (Inspection Machines, etc.) |
| Bias |
| Radial |
| Two-wheelers |
| Three-wheelers |
| Passenger Cars |
| Light Commercial Vehicles |
| Medium and Heavy Commercial Vehicles |
| Off-Road Vehicles |
| Up to 12 inches |
| 12 to 18 inches |
| Above 18 inches |
| OEMs |
| Replacement / Aftermarket |
| By Equipment Type | Upstream (Mixer and Component Preparation) | Mixing Machines / Rubber Mixers |
| Calendaring Machines | ||
| Extrusion Machines | ||
| Cutting Machines | ||
| Others (Cooling Units, etc.) | ||
| Building Area | Bead Winding Machine | |
| Tire Building Machine | ||
| Others (Strip Winding Machine, etc.) | ||
| Curing and Inspection (Testing Area) | Curing Press Machines | |
| Tire Painting Machines | ||
| Others (Inspection Machines, etc.) | ||
| By Tire Design | Bias | |
| Radial | ||
| By Vehicle Type | Two-wheelers | |
| Three-wheelers | ||
| Passenger Cars | ||
| Light Commercial Vehicles | ||
| Medium and Heavy Commercial Vehicles | ||
| Off-Road Vehicles | ||
| By Rim Size | Up to 12 inches | |
| 12 to 18 inches | ||
| Above 18 inches | ||
| By End-User | OEMs | |
| Replacement / Aftermarket | ||


Key Questions Answered in the Report
What is the current value of the U.S. tire manufacturing equipment market?
The U.S. tire manufacturing equipment market size reached USD 615.55 million in 2025 and is projected to hit USD 765.99 million by 2030.
Which equipment category leads sales in the United States?
Building Area machinery leads with 33.06% revenue share, reflecting its central role in carcass assembly and belt application.
How fast is Curing & Inspection equipment growing?
Curing & Inspection equipment is forecast to advance at a 10.03% CAGR through 2030, the highest among all categories.
Why are Section 48C tax credits important to equipment buyers?
The credits refund 30% of qualified capital outlays, effectively shortening payback periods on high-efficiency machinery upgrades.
Which region is attracting the largest new plant investments?
The Southeast, notably Tennessee, tops recent announcements thanks to billion-dollar expansions that double plant footprints and add truck-and-bus radial capacity.
What share of spending comes from the replacement segment?
Replacement applications accounted for 67.19% of 2024 purchases as aging vehicles and frequent tire changes sustain aftermarket demand.
Page last updated on:


