North America Tire Market Size and Share
Market Overview
| Study Period | 2019 - 2030 |
|---|---|
| Forecast Data Period | 2025 - 2030 |
| Historical Data Period | 2019 - 2023 |
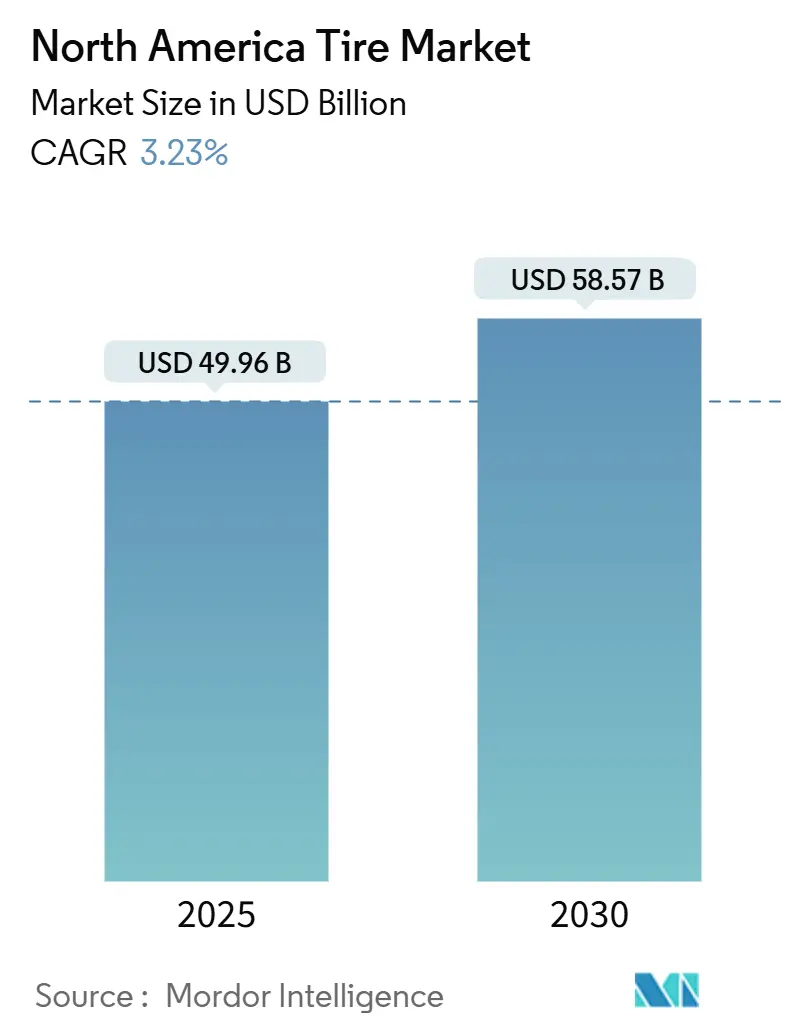
| Market Size (2025) | USD 49.96 Billion |
| Market Size (2030) | USD 58.57 Billion |
| Growth Rate (2025 - 2030) | 3.23% CAGR |
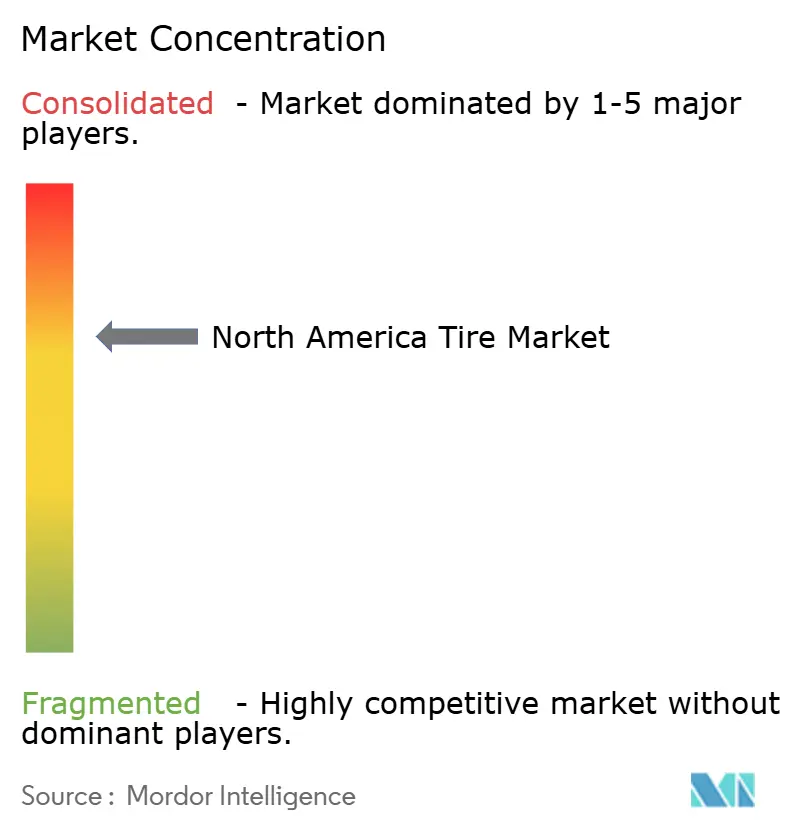
| Market Concentration | Medium |
Major Players *Disclaimer: Major Players sorted in no particular order Image © Mordor Intelligence. Reuse requires attribution under CC BY 4.0. | |
North America Tire Market Analysis by Mordor Intelligence
The North America tire market size stands at USD 49.96 billion in 2025 and is forecast to reach USD 58.57 billion by 2030, expanding at a 3.23% CAGR during the period. Mature replacement dynamics dominate the region, yet infrastructure upgrades, e-commerce logistics, and electrification continually carve out profitable growth pockets that manufacturers are racing to serve. Heavy-duty demand tied to new highway capacity combines with rising last-mile mileage to keep light truck and medium commercial volumes resilient. Meanwhile, battery-electric vehicle (BEV) adoption reshapes compound chemistry, creating a premium for low-rolling-resistance designs. Smart-tire sensors, winter-tire mandates, and volatile natural-rubber costs further influence strategic priorities as companies seek resilient supply chains and value-added services[1]“2024 USTMA Factbook,” U.S. Tire Manufacturers Association, ustires.org.
Key Report Takeaways
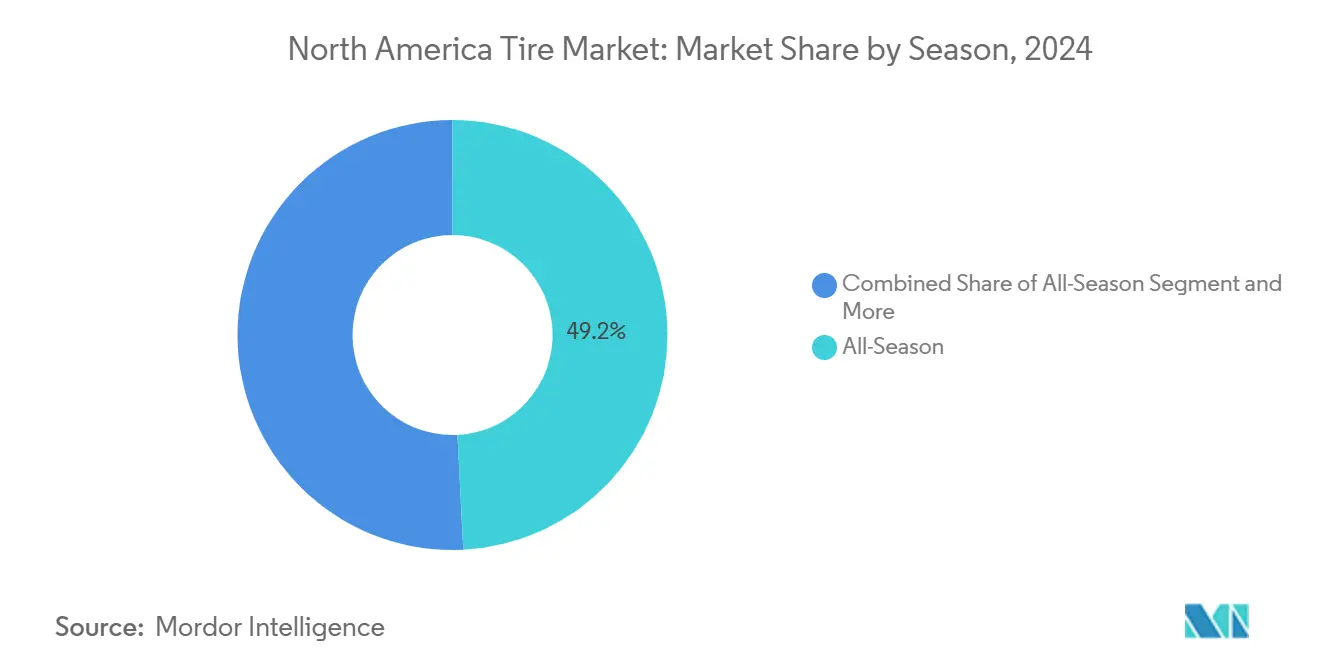
- By season, all-season tires held 49.21% of the North America tire market share in 2024, while the all-terrain subsegment is accelerating at a 6.42% CAGR through 2030.
- By tire design, radial construction dominated with a 95.28% share in 2024; non-pneumatic formats are projected to grow fastest at 13.83% CAGR.
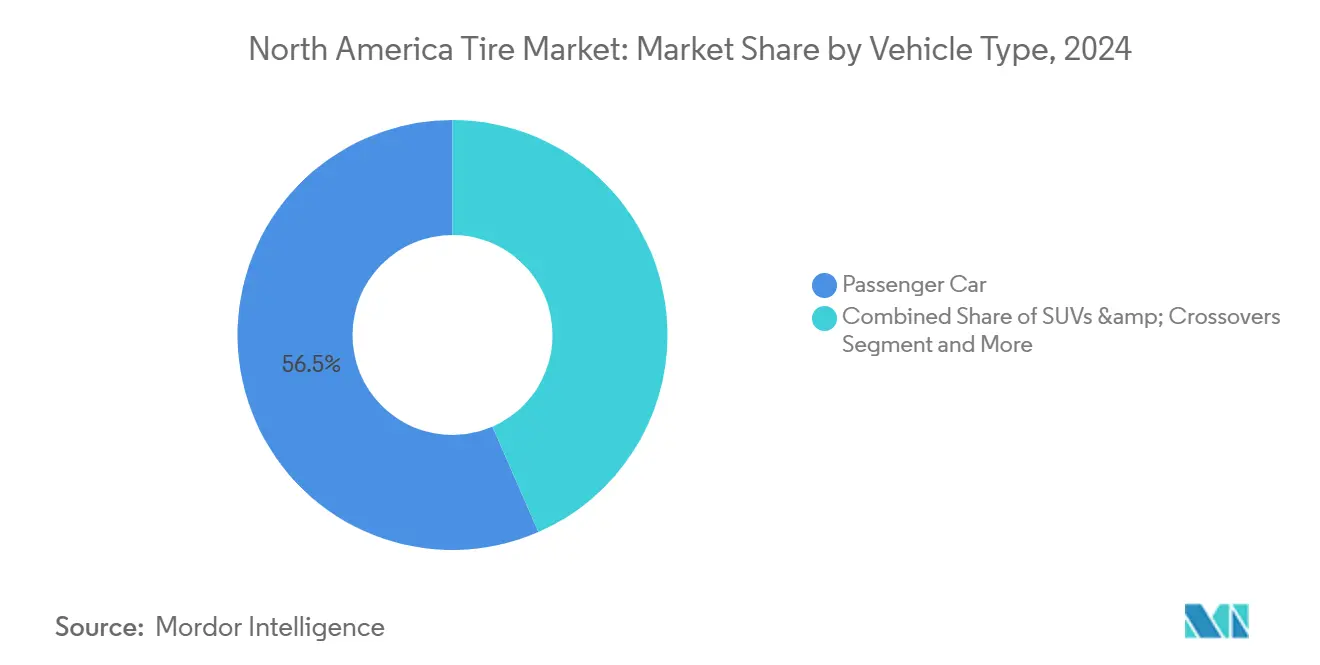
- By vehicle type, passenger and light trucks together commanded 56.54% revenue in 2024, whereas the SUV and crossover category is set to expand at a 5.83% CAGR to 2030.
- By application, on-road tires captured 81.67% of the North America tire market size in 2024; the off-road segment is advancing at a 7.01% CAGR through 2030.
- By end user, replacement channels led with 74.34% share in 2024, and retread volumes are forecasted to rise at an 8.31% CAGR.
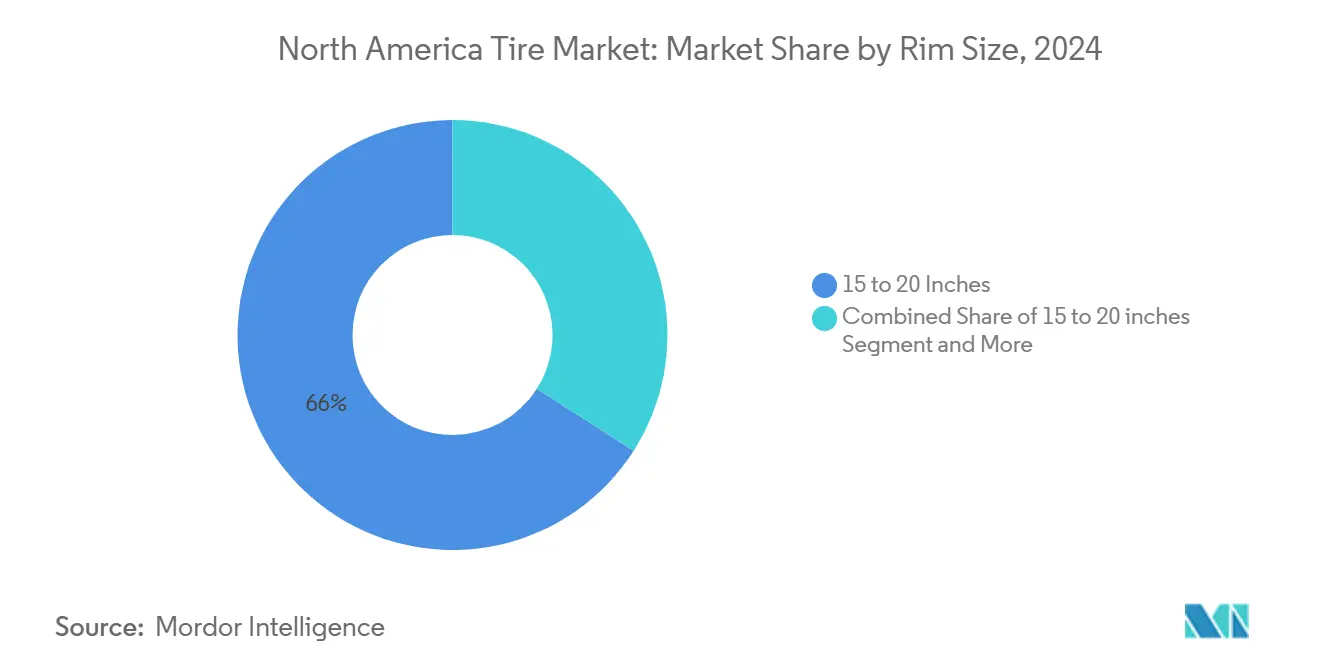
- By rim size, 15- to 20-inch products controlled 65.96% of 2024 demand, whereas the above-20-inch class is poised for an 8.79% CAGR through 2030.
- By propulsion, ICE platforms retained 90.04% revenue in 2024, yet BEVs are surging at a 16.79% CAGR through 2030.
- By country, the United States accounted for 77.48% of 2024 sales; Mexico is on track for the fastest 6.12% CAGR to 2030.
North America Tire Market Trends and Insights
Drivers Impact Analysis*
| Driver | (~) % Impact on CAGR Forecast | Geographic Relevance | Impact Timeline |
|---|---|---|---|
| Highway Expansions | +0.8% | United States, cross-border corridors to Canada and Mexico | Medium term (2-4 years) |
| Low-Rolling-Resistance Tire Demand | +0.7% | United States, Canada, select Mexican urban centers | Long term (≥ 4 years) |
| E-Commerce Logistics Growth | +0.5% | North America, concentrated in major metropolitan areas | Short term (≤ 2 years) |
| TPMS-Enabled "Smart" Tire Adoption | +0.4% | United States, Canada | Medium term (2-4 years) |
| Mandatory Winter-Tire Regulations | +0.3% | Quebec, Colorado, potential expansion to Montana, Idaho, Wyoming | Medium term (2-4 years) |
| USDA and Canadian Ag-Tech Subsidies | +0.2% | Rural United States, Canadian prairie provinces | Long term (≥ 4 years) |
| Source: Mordor Intelligence | |||
U.S. Infrastructure-Bill Highway Expansions Boosting Heavy-Duty Tire Demand
Federal spending is widening freight corridors, extending operating hours for construction and logistics vehicles. Unit shipments of OE truck tires are projected to rise as fleets add capacity, and line-haul operators benefit from smoother roads that lower fuel burn and casing fatigue. Manufacturers with nearby production and dealer footprints capture the earliest upside as states schedule multi-year paving contracts and port dredging projects. Competitive advantage accrues to brands able to pre-position inventory along the I-35 and I-80 corridors, where freight ton-miles are forecast to climb most sharply. The combined effect is a measurable uplift in steer- and drive-axle demand that should persist beyond the build-out window.
BEV-Specific Low-Rolling-Resistance Tire Demand Surge
Electric drivetrains impose higher load yet require lower rolling resistance to preserve range. Dedicated silica-rich compounds, aero-optimized sidewalls, and acoustic foam inserts are rapidly becoming standard features. Portfolio realignment is moving quickly because every 1% reduction in rolling resistance adds an estimated 2 mi of range to a midsize EV, making tire choice a measurable sales point for automakers[2]“Truck and Bus Tires From People’s Republic of China: Continuation of Antidumping and Countervailing Duty Orders,” Enforcement and Compliance, International Trade Administration, trade.gov. Manufacturers that lock in early OE fitments gain a pull-through advantage in the premium replacement channel. As state and federal incentives spread, volumes will scale fast enough to lower per-unit production cost, reinforcing the technology’s momentum over the long term.
E-Commerce Logistics Growth Inflating Replacement Demand for LT & TBR Tires
Double-digit parcel growth since 2021 continues to swell urban delivery fleets, and analysts expect last-mile vehicle miles traveled to outpace long-haul mileage through 2027. Stop-and-go duty cycles shorten tread life, particularly on steer positions, pushing replacement intervals down to 9–12 months for many operators. This accelerates the cadence at which regional distributors must replenish inventories and has prompted tire makers to open forward-stocking locations near fulfillment hubs. Fleet managers also prioritize wet-grip ratings because delivery vans often brake sharply at loading docks, so premium brands that guarantee mileage are gaining share despite higher up-front prices. Rising adoption of electric step vans will further heighten the mix of high-torque applications, compounding replacement volumes in premium LT and medium commercial segments.
Adoption of TPMS-Enabled Smart Tires Across Commercial Fleets
Fleet managers deploying connected pressure and temperature sensors report significantly lower roadside failures and fuel-burn reduction, translating into rapid ROI. Embedded RFID additionally unlocks retread tracking and warranty analytics that help carriers document compliance for shipper scorecards. The resulting data subscriptions are opening recurring-revenue channels for manufacturers positioned as mobility partners[3]Mika Shelley, “Smart Tire Technology for Light & Medium-Duty Fleets,” Automotive Fleet, automotive-fleet.com. Sensor data also feeds predictive maintenance platforms that schedule change-outs on low-traffic days, minimizing revenue disruption. As insurance underwriters begin offering premium discounts for verified TPMS usage, adoption is poised to accelerate beyond early adopters into mid-size fleet segments.
Restraints Impact Analysis*
| Restraint | (~) % Impact on CAGR Forecast | Geographic Relevance | Impact Timeline |
|---|---|---|---|
| Natural-Rubber Price Volatility | -0.6% | North America, with supply chain impacts from Asia-Pacific | Short term (≤ 2 years) |
| Retread and Remold Services | -0.4% | United States, Canada | Medium term (2-4 years) |
| AD/CVD Tariffs on Asian Imports | -0.3% | United States, cross-border trade with Mexico | Short term (≤ 2 years) |
| Higher Curb-Weight of BEVs | -0.2% | United States, Canada, select Mexican markets | Long term (≥ 4 years) |
| Source: Mordor Intelligence | |||
Natural-Rubber Price Volatility
Weather disruptions in Thailand and Indonesia are constricting raw-rubber supply, lifting spot prices and squeezing gross margins because natural rubber represents roughly one-third of input costs. Larger firms are countering by locking multi-year contracts or substituting synthetic blends where performance permits, but synthetic prices also trend upward when crude markets tighten. Smaller manufacturers face working-capital strain as they hold higher inventories to avoid production interruptions, eroding liquidity just as interest rates peak. Volatile raw-material costs complicate pricing negotiations with fleet accounts that demand quarterly quotes, forcing tire makers to assume currency and commodity risk on slim spreads. Unless acreage incentives emerge in producer countries, input cost turbulence will remain a headwind through the next procurement cycle.
Rising Penetration of Retread & Remold Services
Cost-focused fleets increasingly select retreads that can halve lifecycle expense versus new tires, and sustainability programs highlight retreads’ significant carbon-savings profile compared with virgin production. Every retreaded casing equates to 2–3 forgone new-tire sales, eroding unit demand in categories most exposed to price-sensitive over-the-road operators. Manufacturers are responding by designing casings for multiple retread cycles to secure recurring bead-to-bead revenue rather than concede volume entirely. Yet low-cost Southeast Asian imports continue to undercut retread pricing, prompting some casters to idle capacity until casing supply tightens. The tug-of-war between budget imports and retread cost efficiency will likely cap new-tire growth in the medium term.
*Our forecasts treat driver/restraint impacts as directional, not additive. The impact forecasts reflect baseline growth, mix effects, and variable interactions.
Segment Analysis
By Season: All-Season Dominance Faces Terrain Shift
All-season products retained 49.21% of the North America tire market share in 2024, reflecting motorists’ preference for the convenience of a single set of tires throughout the year. The North America tire market size for all-terrain patterns, however, is projected to expand at a 6.42% CAGR, and this uptick coincides with robust SUV and pickup sales that reward aggressive tread aesthetics. Regional climate also shapes demand: summer tires remain popular in the Sun Belt, while Quebec’s compulsory winter-tire rules drive spikes in cold-weather SKUs each October. Retailers therefore juggle inventory mix carefully, ensuring adequate winter product in northern zones without overstocking slower-moving summer lines. Dealers leveraging data analytics on local vehicle registrations achieve higher stock-turn ratios and lower end-of-season markdowns.
All-terrain gains are additionally explained by lifestyle marketing that positions trucks as adventure enablers, nudging suburban owners to trade road-noise compromises for perceived ruggedness. Premium brands now launch hybrid tread designs that balance siping for wet grip with open shoulder blocks for off-road traction, mitigating the historical mileage penalty. As inventories normalize, channel partners refine merchandising plans by zip code, pairing tire options with vehicle-make demographics to capture upsell potential. Winter-tire expansion beyond Quebec into U.S. mountain states could dilute all-season share during cold months but also create high-margin opportunities for manufacturers holding 3-Peak Mountain Snowflake certification. The season segmentation ultimately hinges on regulation, vehicle-mix shifts, and evolving consumer perception of safety versus convenience.


By Tire Design: Radial Supremacy Challenged by Airless Innovation
Radial construction accounted for 95.28% of shipments in 2024, cementing its leadership through proven advantages in fuel efficiency, tread life, and cornering stability. Within the North America tire market, non-pneumatic technology still occupies a sliver of volumes yet boasts a 13.83% CAGR because fleets in airports, ports, and automated warehouses view puncture-free uptime as mission-critical. Demand for bias-ply continues to fade as agricultural and forestry equipment modernize toward steel-belted radials that tolerate faster transport speeds between job sites. R&D is therefore concentrated on refining belt angles, carcass cords, and cap-ply materials to eke out incremental range gains for electric vehicles. Tier-one suppliers are also experimenting with recycled carbon black in radial tread layers to hit corporate sustainability targets without sacrificing performance.
Airless concepts inject disruptive potential even if mass-market adoption remains post-2030. Fleet pilots on electric delivery vans report maintenance savings because technicians no longer chase slow leaks, and this anecdotal evidence is compelling finance officers to approve broader trials. However, ride-quality perception and tooling costs pose hurdles that only sustained volume can overcome, so manufacturers hedge by incrementally improving conventional radials while patenting airless intellectual property. Regulatory standards for non-pneumatic road use are under development at SAE committees, and early alignment with those specs could fast-track approvals once durability data satisfy federal crashworthiness thresholds. Investors watching the segment see a classic J-curve where upfront capital depresses margins before airless volumes scale into profitability.
By Vehicle Type: Passenger Base, SUV Momentum
Passenger car and light truck categories delivered 56.54% of 2024 revenue, though sedan demand continues to erode as consumers gravitate toward higher-riding crossovers. The North America tire market share captured by SUVs and crossovers is projected to rise at a 5.83% CAGR through 2030, bolstering demand for larger load-index tires capable of supporting heavier curb weights. Growth in this category dovetails with heightened preference for all-terrain aesthetics, meaning tread blocks become taller and shoulder voids wider, complicating balancing but improving perceived capability. Manufacturers that integrate noise-canceling foam inside SUV tires also gain favor among EV drivers who notice tire roar more acutely without engine masking.
Commercial heavy-duty volumes remain tethered to freight ton-miles rather than consumer confidence, yielding relatively stable year-over-year demand for steer and drive positions. Segment profitability depends on casings’ retreadability, and premium brands win repeat purchases by demonstrating multiple life cycles. Two-wheelers and UTVs occupy specialty channels with higher margins per pound of rubber but require intricate dealer education to communicate safety benefits over low-cost imports. Off-the-road and agricultural tire sub-segments, although niche, serve as hedge revenue streams during macro-cyclical dips in automotive production. Ultimately, vehicle-type dynamics oblige suppliers to tailor SKU breadth while preserving scale economics in common bead diameters.
By Application: On-Road Supremacy Masks Off-Road Acceleration
On-road uses commanded 81.67% of 2024 sales, driven by commuter traffic, regional haul, and urban delivery fleets that collectively accumulate billions of annual miles. High-speed tread wear and rolling resistance therefore dominate design briefs, prompting continuous compound tweaks to secure OEM efficiency certifications. Yet off-road applications, registering a 7.01% CAGR, generate higher revenue per unit because mining, construction, and agricultural customers accept premium pricing for extraordinary durability. Margins widen further when suppliers bundle site services such as thermal imaging of haul-truck positions to pre-empt heat-separation failures. Insurance carriers often require documented tire-maintenance programs on mine sites, steering operators toward branded products with established safety pedigrees.
Infrastructure spending across the United States is spurring demand for 25-inch and larger OTR sizes, while Canadian prairie mineral extraction drives requirements for snow-compound mining tires. Manufacturers with modular production lines can shift capacity between 29-inch and 35-inch carcasses as commodity cycles fluctuate, enhancing plant utilization rates. Agricultural flotation tires also gain traction because precision-farming techniques necessitate lower soil compaction, a requirement met by wider profiles and flexible sidewalls. Suppliers that embed IoT sensors in OTR casings collect operating data and market it back as value-added analytics, thereby deepening customer stickiness. This bifurcated market requires balancing volume-oriented on-road contracts against bespoke off-road builds that command outsized profitability.
By End User: Replacement Market Drives Aftermarket Strategy
Replacement channels generated 74.34% of 2024 unit volumes and deliver superior gross margins relative to OE supply because pricing power rests with retail dealers rather than automakers. The North America tire market size within replacement is thus the critical determinant of operating leverage for most manufacturers. Same-store sales at tire super-centers benefit from bundled services such as alignment and nitrogen inflation, which raise ticket value while cementing customer loyalty. Digital pure-plays are also gaining share by offering two-hour mobile installation windows, and established brands now provide click-to-dealer programs to recapture online shoppers.
Retread volumes, advancing at an 8.31% CAGR, illustrate fleets’ sharpening focus on total cost of ownership amid heightened fuel and insurance expenses. Premium tire makers collaborate with independent retreaders to certify casing inspection protocols, safeguarding brand reputation even in the secondary life cycle. OE supply, although lower margin, remains strategically important for technology showcase: tires homologated on new EV platforms often translate into captive replacement income when vehicles enter the 3-year service window. To accelerate that flywheel, suppliers negotiate exclusive designs that limit aftermarket competition, preserving price integrity after OE warranties expire.
By Rim Size: Mid-Range Dominance Shifts Toward Larger Diameters
Rims between 15 in and 20 in held 65.96% of shipments in 2024, reflecting their fitment on mainstream sedans, compact SUVs, and half-ton pickups. These sizes anchor manufacturing scale and enjoy the broadest replacement inventory, enabling retailers to carry depth rather than breadth. The North America tire market share for 20 inch and above wheels is rising, however, propelled by luxury crossovers and performance EVs that require bigger brake clearances. Low-profile designs must reconcile ride comfort with sidewall stiffness, and manufacturers now use adaptive polyurethane inserts to cushion impacts without adding weight.
Larger rim-diameter tires also introduce higher speed ratings and asymmetric tread patterns, pushing unit ASPs well above mid-range averages. Goodyear’s Oklahoma expansion specifically targets these sizes, signaling a strategic pivot toward premium mix uplift. Below-15-in demand will continue tapering as automakers phase out compact sedans, freeing press capacity for larger molds. Distributors are therefore readjusting warehouse slotting to ensure fast-moving 21- and 22-in SKUs occupy forward pick-zones, reducing fulfillment times for dealerships. Over the forecast period, mix shift rather than sheer volume will drive revenue growth in rim-size segmentation.
By Propulsion: ICE Dominance Faces EV Disruption Timeline
Internal-combustion platforms accounted for 90.04% of 2024 demand, but their replacement cycles are lengthening as drivetrain reliability improves and economic uncertainty delays new-car purchases. The North America tire market size tied to BEVs, on the other hand, is expanding at a 16.79% CAGR, compelling suppliers to certify compounds that meet 40% lower rolling-resistance targets without compromising wet grip. Acoustic foam inserts and aero-profile sidewalls are standard on many EV-dedicated SKUs, distinguishing them visually in dealer racks. Hybrid vehicles provide intermediate volumes, often sharing tread patterns with ICE companions but adopting stiffer sidewalls to handle regenerative-braking torque.
Regulators push OEMs toward zero-emission mandates, which in turn force tire companies to publish rolling-resistance coefficients on public databases, increasing transparency and competitive comparison. Early movers that secure fitments on best-selling EV models enjoy recurring aftermarket pull-through once original sets wear out at 25,000-30,000 mi, a shorter interval than ICE counterparts due to higher curb weight. Brands lacking EV-ready lines face the dual threat of OE disqualification and a shrinking replacement TAM as electrification accelerates. Therefore, corporate R&D budgets now allocate more than half of compound-development funds to EV-centric projects, ensuring future relevance amid power-train transition.
Geography Analysis
The United States anchors regional demand with unwavering 77.48% share in 2024, underpinned by a replacement base that cycles every 3.2 years on average. Bipartisan infrastructure funding is forecast to keep heavy-duty demand buoyant by adding 173 mi of new interstate lane-miles annually through 2028, forcing manufacturers to align distribution along high-traffic corridors in the Midwest and Southeast. NHTSA crash-data disclosures highlighting 562 tire-related fatalities in 2022 are also intensifying fleet interest in smart-tire telematics, propelling sensor-equipped SKU penetration beyond early-adopter freight carriers [AUTOMOTIVE-FLEET.COM].
Mexico’s 6.12% growth trajectory is powered by near-shoring of auto assembly and Tier-1 parts suppliers relocating from Asia. Each incremental light-vehicle produced domestically lifts OEM tire call-offs and creates future replacement pull-through. Government incentive packages, including 10-year corporate tax holidays in Nuevo León, are luring global brands to build greenfield plants, narrowing service-level gaps with entrenched U.S. incumbents. Retail distribution, however, remains fragmented, compelling suppliers to invest in branded franchise outlets to secure shelf space.
Canada, although accounting for a modest slice of the North America tire market size, offers counter-seasonal demand that steadies plant utilization. Quebec’s winter-tire enforcement yields a predictable November-December spike in studded and non-studded snow tires, driving incremental capacity buffers in Ontario and Ohio factories. Federal agricultural grants that subsidize radial flotation tires for precision farming additionally bolster off-road volumes in prairie provinces [CANADA.CA].
Competitive Landscape
The North America tire market exhibits moderate concentration, yet competitive intensity remains high as established manufacturers face pressure from Asian imports and emerging EV-specific requirements that could reshape market dynamics. Strategic doctrine emphasizes regional manufacturing self-sufficiency to evade antidumping duties and minimize trans-Pacific freight delays. Goodyear’s Oklahoma expansion will lift premium, large-rim capacity by around 30% once fully online, illustrating the shift toward high-margin SKUs that serve EV and SUV platforms.
Technology-centric positioning is equally pivotal. Continental’s latest low-rolling-resistance lineup, verified to lower BEV energy consumption by 3%, secures first-fit approvals from automakers eager to move regulatory range targets. Smaller Asian entrants, while cost-competitive, confront brand-trust hurdles in winter performance and sensor integration, complicating their ascent beyond budget channels.
Distribution muscle remains a decisive moat. Bridgestone’s nationwide network of company-owned retail outlets grants direct consumer access and data insight into replacement timing, while Hankook is partnering with independent dealers to co-brand storefronts in Sun Belt states where population inflows spur higher vehicle registrations. Consolidation among regional wholesalers, partly driven by e-commerce fulfillment demands, is reallocating bargaining power upstream toward volume leaders able to guarantee year-round fill rates.
North America Tire Industry Leaders
Bridgestone Corporation
Goodyear Tire & Rubber Company
Continental AG
Hankook Tire & Technology
Yokohama Rubber Co.
- *Disclaimer: Major Players sorted in no particular order

Recent Industry Developments
- September 2025: UVeye and Dealer Tire launched an integrated computer-vision inspection platform that beams tread depth and DOT data directly into dealer ordering systems for streamlined service visits.
- May 2025: Pirelli North America debuted the DOT-marked P ZERO TROFEO TRACK for ultra-high-performance cars, translating motorsport compounds to street-legal applications.
- May 2025: Goodyear introduced the Eagle F1 Asymmetric 6 across U.S. and Canadian dealers, engineered for high-end sedans, SUVs, and electric vehicles.
- May 2025: Goodyear finalized the sale of its Dunlop consumer rights in North America, Europe, and Oceania to Sumitomo Rubber Industries to concentrate capital on core branded portfolios.


North America Tire Market Report Scope
| Summer |
| Winter |
| All-Season |
| All-Terrain / Mud-Terrain |
| Radial |
| Bias |
| Non-pneumatic / Airless |
| Passenger Cars |
| SUVs and Crossovers |
| Light Commercial Vehicles |
| Heavy Commercial Trucks and Buses |
| Two-Wheelers |
| Off-the-Road and Specialty (OTR, Agriculture, Mining, Racing) |
| On-Road |
| Off-Road (Construction, Mining, Agriculture) |
| OEM |
| Aftermarket (Replacement and Retread) |
| Below 15 inches |
| 15 to 20 inches |
| Above 20 inches |
| Internal-Combustion Vehicles |
| Battery-Electric Vehicles |
| Hybrid and Fuel-Cell Vehicles |
| United States |
| Canada |
| Mexico |
| Rest of North America |
| By Season | Summer |
| Winter | |
| All-Season | |
| All-Terrain / Mud-Terrain | |
| By Tire Design | Radial |
| Bias | |
| Non-pneumatic / Airless | |
| By Vehicle Type | Passenger Cars |
| SUVs and Crossovers | |
| Light Commercial Vehicles | |
| Heavy Commercial Trucks and Buses | |
| Two-Wheelers | |
| Off-the-Road and Specialty (OTR, Agriculture, Mining, Racing) | |
| By Application | On-Road |
| Off-Road (Construction, Mining, Agriculture) | |
| By End User | OEM |
| Aftermarket (Replacement and Retread) | |
| By Rim Size | Below 15 inches |
| 15 to 20 inches | |
| Above 20 inches | |
| By Propulsion | Internal-Combustion Vehicles |
| Battery-Electric Vehicles | |
| Hybrid and Fuel-Cell Vehicles | |
| By Country | United States |
| Canada | |
| Mexico | |
| Rest of North America |


Key Questions Answered in the Report
How large is the North America tire market in 2025 and what CAGR is expected through 2030?
The market is valued at USD 49.96 billion in 2025 and is projected to grow at a 3.23% CAGR to USD 58.57 billion by 2030.
Which country contributes the most revenue to regional tire sales?
The United States leads with 77.48% share, supported by the world’s largest vehicle fleet and expansive highway network.
What segment is growing fastest within the North America tire market?
Battery electric vehicle tires are advancing at a 16.79% CAGR as OEM electrification accelerates.
Why are large-diameter (≥ 20 in) tires gaining momentum?
Luxury SUVs and EVs increasingly specify larger wheels for styling and brake-packaging reasons, driving an 8.79% CAGR in this rim-size band.
Page last updated on:


