United States Tire Market Size and Share
Market Overview
| Study Period | 2019 - 2030 |
|---|---|
| Forecast Data Period | 2025 - 2030 |
| Historical Data Period | 2019 - 2023 |
| Market Size (2025) | USD 56.27 Billion |
| Market Size (2030) | USD 64.06 Billion |
| Growth Rate (2025 - 2030) | 2.63% CAGR |
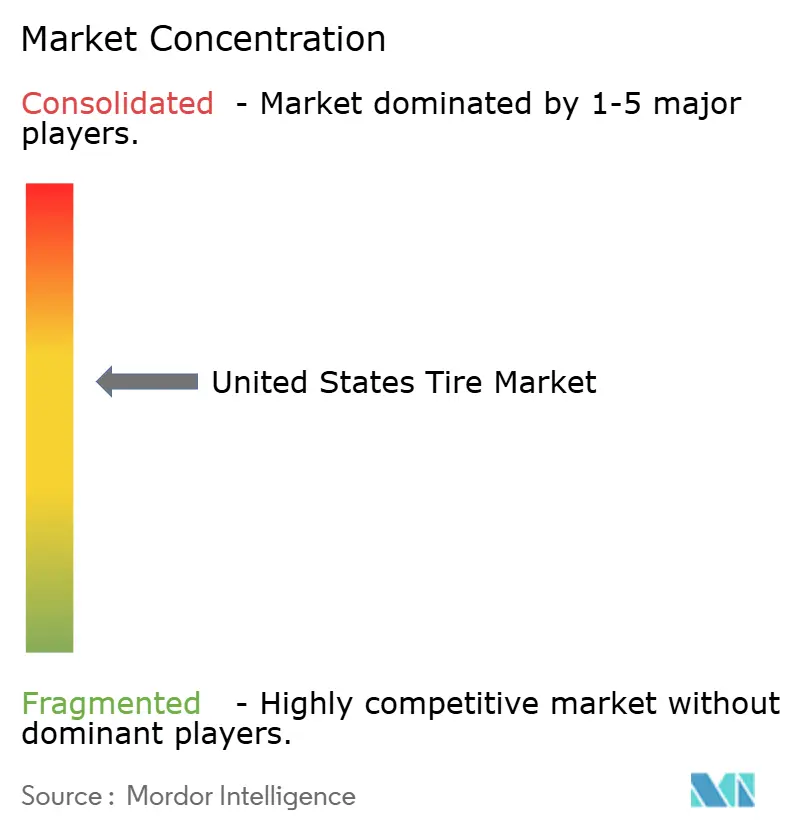
| Market Concentration | Medium |
Major Players *Disclaimer: Major Players sorted in no particular order Image © Mordor Intelligence. Reuse requires attribution under CC BY 4.0. | |

United States Tire Market Analysis by Mordor Intelligence
The United States Tire Market size is estimated at USD 56.27 billion in 2025, and is expected to reach USD 64.06 billion by 2030, at a CAGR of 2.63% during the forecast period (2025-2030). This measured progression reflects a mature demand profile where replacement cycles, larger rim sizes, and rising vehicle miles traveled sustain growth across consumer and commercial segments. Aging fleets—now averaging 12.5 years—coupled with almost three-fifths SUV and light-truck production mix, lift average selling prices and shorten change-out intervals. Regulation targeting more than fifty miles per gallon by 2031 accelerates the adoption of low rolling-resistance technologies, while state‐level recycling mandates reinforce circular supply chains. Digital commerce and mobile installation models further disrupt distribution economics, widening reach for established and emerging brands within the United States tire market.
Key Report Takeaways
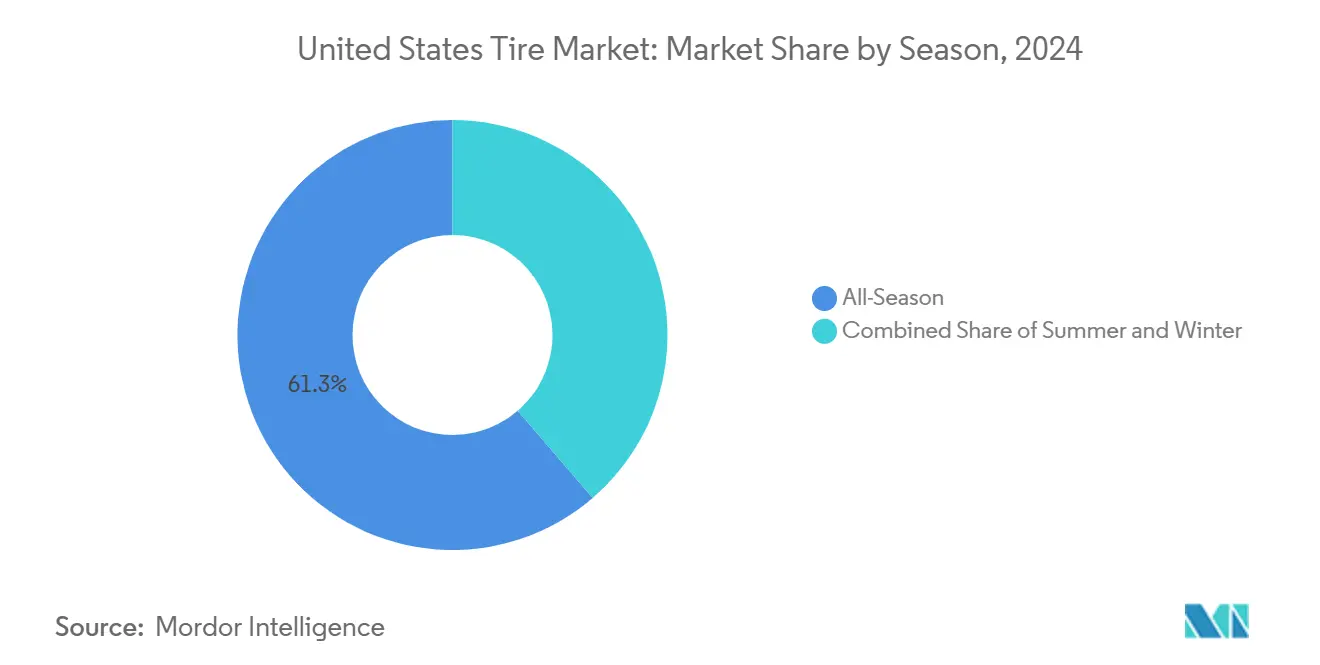
- By season, all-season products led with 61.28% of the United States tire market share in 2024; winter tires are forecast to expand at a 2.65% CAGR through 2030.
- By tire design, radial construction commanded 89.92% of the United States tire market share in 2024, while airless formats posted the highest 2.67% CAGR to 2030.
- By vehicle type, passenger cars accounted for a 65.37% share of the United States tire market size in 2024 and advanced at a 2.76% CAGR through 2030.
- By application, on-road fitments captured a 74.36% of the United States tire market share in 2024; off-road demand is accelerating at a 2.68% CAGR to 2030.
- By end user, OEM channels held 81.21% of the United States tire market share in 2024, whereas aftermarket turnover registers a 2.78% CAGR through 2030.
- By rim size, the 15-20-inch category led with 47.68% of the United States tire market share in 2024; wheels above 20 inches rose fastest at a 2.71% CAGR.
- By propulsion, ICE vehicles retained 88.71% of the United States tire market share in 2024; battery electric vehicles recorded a 2.72% CAGR to 2030.
United States Tire Market Trends and Insights
Drivers Impact Analysis*
| Driver | (~) % Impact on CAGR Forecast | Geographic Relevance | Impact Timeline |
|---|---|---|---|
| Aging Vehicle Fleet & Higher VMT | +0.4% | National, concentrated in Sun Belt states | Medium term (2-4 years) |
| SUV & Light-Truck Mix Lifts | +0.3% | National, strongest in suburban markets | Long term (≥ 4 years) |
| Corporate & Federal Fuel-Efficiency Rules | +0.2% | National, early adoption in California | Medium term (2-4 years) |
| Surge Of Tire E-Commerce & Mobile Installers | +0.2% | Urban centers, expanding to rural markets | Short term (≤ 2 years) |
| Domestic EV-Tire Capacity Unlocks High-Margin Niche | +0.1% | Regional, concentrated in manufacturing hubs | Long term (≥ 4 years) |
| State-Level Recycled-Rubber | +0.1% | California, expanding to Northeast states | Medium term (2-4 years) |
| Source: Mordor Intelligence | |||
Aging Vehicle Fleet & Higher VMT Boost Replacement Demand
The climbing average vehicle age to 12.5 years extends the domestic parc, yet lifts tire turnover as suspension wear accelerates tread degradation. Vehicle miles traveled rebounded exponentially in 2024, matching pre-pandemic levels and compounding usage intensity[1]“Traffic Volume Trends December 2024,” Federal Highway Administration, fhwa.dot. gov. Older vehicles demand premium, longer-lasting rubber to offset rising maintenance costs, steering consumers toward higher-margin lines. Fleets have grown faster in the past 16 years, creating a multiplier effect on replacement frequency. Collectively, these conditions underpin stable volume across the United States tire market.
SUV & Light-Truck Mix Lifts Average Rim Size And ASP
SUVs and light trucks now represent three-fifths of new-build output, typically fitting 17–20 inch rims compared with 15–16 inch sedan norms. These larger formats commanded higher average prices, steadily upgrading revenue yield per unit. As automakers phase out several sedan lines, the larger wheel becomes the baseline rather than the premium. The shift improves manufacturer margins and raises the replacement cost consumers bear, embedding value expansion within the United States tire market.
Corporate & Federal Fuel-Efficiency Rules Favor Low-RR Radials
The 50.4 mpg CAFE mandate effective 2031 positions low rolling-resistance tires as mandatory compliance components[2]“Final CAFE Standards Model Year 2031,” National Highway Traffic Safety Administration, nhtsa.gov . Adopting advanced silica compounds and optimized tread designs can deliver minimal fuel-efficiency gains, which is meaningful for automakers facing penalties. Because tire life aligns with regulatory timelines, conversion to premium lines progresses predictably through replacement cycles, uplifting technology-rich categories.
Surge Of Tire E-Commerce & Mobile Installers Widens Reach
Online channels claim a rising share by pairing competitive prices with doorstep service. Mobile installers mount and balance on site, reducing consumer downtime and widening access for fleets and time-starved drivers. Data-driven platforms optimize inventory and routing, eroding legacy retail margins. Direct-to-consumer brands gain a cost advantage while cultivating first-party customer data, resetting competitive rules within the United States tire market.
Restraints Impact Analysis*
| Restraint | (~) % Impact on CAGR Forecast | Geographic Relevance | Impact Timeline |
|---|---|---|---|
| Natural & Synthetic-Rubber Price Volatility | -0.2% | Global supply chains, regional processing | Short term (≤ 2 years) |
| Import Tariffs/Trade Frictions Inflate Landed Costs | -0.1% | National, concentrated at major ports | Medium term (2-4 years) |
| Faster EV Tire Wear | -0.1% | EV adoption centers, premium markets | Medium term (2-4 years) |
| Urban Shift To Ride-Sharing & Micromobility | -0.1% | Metropolitan areas, dense urban centers | Long term (≥ 4 years) |
| Source: Mordor Intelligence | |||
Natural & Synthetic-Rubber Price Volatility
Supply disruptions in Southeast Asia drove natural rubber up one-third in 2024, while petroleum cost swings lifted synthetic grades quarterly. Rubber accounts for up to two-fifths of material inputs, so variance erodes margins and forces frequent price resets. Aftermarket customers delay purchases during spikes, squeezing volumes. Short contract windows complicate hedging, exposing the United States tire market to cyclical cost shocks.
Faster EV Tire Wear Raises Warranty & Brand-Image Risk
Instant torque and heavier battery weight shorten EV tire life by one-third, pressuring warranty reserves and potentially tarnishing premium brand reputations. Manufacturers face a trade-off between developing new EV compounds that may sacrifice specific performance indices or absorbing costlier claims. Negative user experiences among influential early adopters could be amplified through social channels, posing future revenue risks for the United States tire market.
*Our forecasts treat driver/restraint impacts as directional, not additive. The impact forecasts reflect baseline growth, mix effects, and variable interactions.
Segment Analysis
By Season: All-Season Convenience Under Pressure From Winter Demand
All-season formats represented 61.28% of the United States tire market share in 2024, making them the backbone of the United States tire market. Winter units, though smaller, record a 2.65% CAGR as more severe storms and safety awareness reshape purchase decisions.
Winter penetration extends beyond traditional snowbelt zones into temperate regions experiencing unpredictable weather. Three Peak Mountain Snowflake certification now differentiates offerings, with multiple launches in 2024. All-season makers add snow-capable attributes to defend share, signaling that seasonal boundaries will blur as climate variability persists.


By Tire Design: Radial Supremacy Meets Airless Momentum
Radials held 89.92% of the United States tire market share in 2024, supported by decades of optimization and global capacity scale. Despite a less than 1% share, airless models advanced at a 2.67% CAGR, tapping niche commercial uses that prize puncture resilience.
Michelin’s UPTIS and Bridgestone’s Air Free concepts showcase the path to market. Manufacturing cost and ride-comfort gaps currently restrain broad adoption, yet technological learning curves imply long-term parity potential that could realign the United States tire market.
By Vehicle Type: Passenger Car Leadership Persists
Passenger cars delivered 65.37% of the United States tire market share in 2024 and paradoxically grew fastest at 2.76% CAGR due to electrification and premium retrofit demand. Commercial light trucks benefit from e-commerce logistics but trail the growth pace.
Fleet electrification favors high-performance compounds to manage extra weight and torque. Ride-share and subscription fleets emphasize longevity, altering purchase criteria from individual owner preferences. These dynamics sustain passenger segment primacy, anchoring the broader United States tire market.
By Application: On-Road Core Faces Off-Road Upswing
On-road duty cycles secured 74.36% of the United States tire market share in 2024, reflecting the centrality of highway and urban travel. Off-road categories—construction, recreation, and industrial—rose at a 2.68% CAGR.
Demand for hybrid all-terrain patterns blurs the on-/off-road divide as consumers seek versatility without compromise. Regulatory limits on ground disturbance push innovation in tread ecodesign, turning environmental stewardship into a feature in the United States tire market.
By End User: OEM Scale Meets Aftermarket Agility
OEM fitments delivered 81.21% of the United States tire market share in 2024, underscoring the clout of automaker relationships. Yet aftermarket revenue accelerates at 2.78% CAGR on the strength of e-commerce, mobile installers, and broader brand selection.
Manufacturers balance the assured volumes of factory contracts with the higher margins and direct data harvest of replacement channels. Digital retail lowers the entry barrier for challenger brands, intensifying competition within the United States tire market.
By Rim Size: Mainstream 15-20 Inch Segment Shifts Upscale
Rims between 15 and 20 inches contributed 47.68% of the United States tire market share in 2024. Wheels above 20 inches, favored by luxury SUVs, outpace averages with a 2.71% CAGR.
Larger wheels elevate aesthetics and handling, justifying premiums that bolster manufacturer profitability. Production complexity and higher raw material inputs confer advantages on incumbents with broad tooling capability, reinforcing scale benefits across the United States tire market.

By Propulsion: ICE Dominance Encounters EV Growth
ICE platforms still account for 88.71% of the United States tire market share in 2024, yet battery electric units advance at a 2.72% CAGR, reflecting federal incentives and charging build-out.
Noise reduction, higher load ratings, and energy efficiency define EV tire engineering, prompting dedicated product lines. Manufacturers must run parallel R&D roadmaps lest they cede share in a cornerstone of future growth for the United States tire market.
Geography Analysis
Regional divergence shapes the United States tire market. Northern states record higher winter tire adoption and shorter seasonal cycles, whereas the Sun Belt relies on all-season formats aligned with consistent warmth. Population migration toward southern metros expands absolute demand and shortens replacement intervals due to longer commutes.
California sets distinct compliance precedents. The USD 1.75-per-tire fee (California imposes a tire fee of USD 1.75 on every new tire purchased, as outlined in the subdivision) funds a program that recycled over half a billion units in 2024, achieving an almost four-fifths recovery rate. Manufacturers often engineer nationwide lines to meet California specifications, gaining scale efficiencies and future-proofing against probable federal alignment.
Manufacturing capacity clusters in Ohio, Tennessee, and South Carolina leverage skilled labor pools and proximity to OEM plants. ENSO’s carbon-neutral facility announcement underscores confidence in domestic output, adding 2,400 jobs and aligning with ESG imperatives. Such investments anchor supply resilience and stimulate local economies, supporting sustained growth across the United States tire market.
Competitive Landscape
Competitive intensity centers on technology, not price. Michelin, Goodyear, and Bridgestone rely on materials science breakthroughs and data-enabled products like Goodyear SightLine to maintain differentiation.
Consolidation progressed in 2024: Goodyear divested Dunlop operations to Sumitomo for USD 701 million, while Yokohama acquired Goodyear’s off-the-road arm for USD 905 million[3]“Goodyear Completes Dunlop Americas Transaction,” Goodyear, goodyear.com. These moves sharpen strategic focus and recalibrate specialty niches.
Sensor-integrated tires create service revenues through predictive maintenance, tying customers closer to vendors. Sustainable processes—from biomass-based synthetic rubber to net-zero manufacturing emerge as competitive essentials. Direct-to-consumer brands exploit digital fluency to erode incumbent share, although scale and brand equity still favor established players in the United States tire market.
United States Tire Industry Leaders
Bridgestone Corporation
Michelin SCA
Goodyear Tire & Rubber Co.
Continental AG
Hankook Tire & Technology
- *Disclaimer: Major Players sorted in no particular order

Recent Industry Developments
- March 2025: Michelin North America released the Agilis HD All-Season truck tire featuring 3PMSF and CurbGuard for urban fleets.
- February 2025: Michelin introduced BFGoodrich g-Force Phenom T/A, an ultra-high-performance summer line launching in 50 sizes.
- January 2025: Michelin unveiled Primacy 5, offering an 18% longer lifespan than its predecessor and improved wet braking; 87 sizes roll out in 2025.


United States Tire Market Report Scope
| Summer |
| Winter |
| All-Season |
| Radial |
| Bias |
| Non-pneumatic / Airless |
| Two-Wheelers |
| Passenger Cars |
| Light Commercial Vehicles |
| Heavy Commercial Trucks & Buses |
| Off-the-Road & Specialty (OTR, Agriculture, Mining, Racing) |
| On-Road |
| Off-Road |
| OEM |
| Aftermarket |
| Below 15 inches |
| 15 – 20 inches |
| Above 20 inches |
| Internal-Combustion Vehicles |
| Battery-Electric Vehicles |
| Hybrid & Fuel-Cell Vehicles |
| By Season | Summer |
| Winter | |
| All-Season | |
| By Tire Design | Radial |
| Bias | |
| Non-pneumatic / Airless | |
| By Vehicle Type | Two-Wheelers |
| Passenger Cars | |
| Light Commercial Vehicles | |
| Heavy Commercial Trucks & Buses | |
| Off-the-Road & Specialty (OTR, Agriculture, Mining, Racing) | |
| By Application | On-Road |
| Off-Road | |
| By End User | OEM |
| Aftermarket | |
| By Rim Size | Below 15 inches |
| 15 – 20 inches | |
| Above 20 inches | |
| By Propulsion | Internal-Combustion Vehicles |
| Battery-Electric Vehicles | |
| Hybrid & Fuel-Cell Vehicles |


Key Questions Answered in the Report
What is the current value of the United States tire market?
The United States tire market size reached USD 56.27 billion in 2025.
How fast is demand for EV-specific tires growing?
Battery electric vehicle fitments are advancing at a 2.72% CAGR through 2030.
Which rim size category is expanding the quickest?
Wheels above 20 inches post the fastest 2.71% CAGR on rising luxury SUV adoption.
Why are winter tires gaining share?
More severe weather events and broader 3PMSF availability lift winter tire sales at a 2.65% CAGR.
How do state recycling fees affect pricing?
California’s USD 1.75 per-tire fee funds recovery rates and adds a modest cost that manufacturers pass through in California and sometimes nationwide.
Which distribution channel is growing fastest?
The aftermarket, supported by e-commerce and mobile installation, records a 2.78% CAGR to 2030.
Page last updated on:


