United States Factoring Services Market Size and Share
Market Overview
| Study Period | 2019 - 2030 |
|---|---|
| Forecast Data Period | 2025 - 2030 |
| Historical Data Period | 2019 - 2023 |
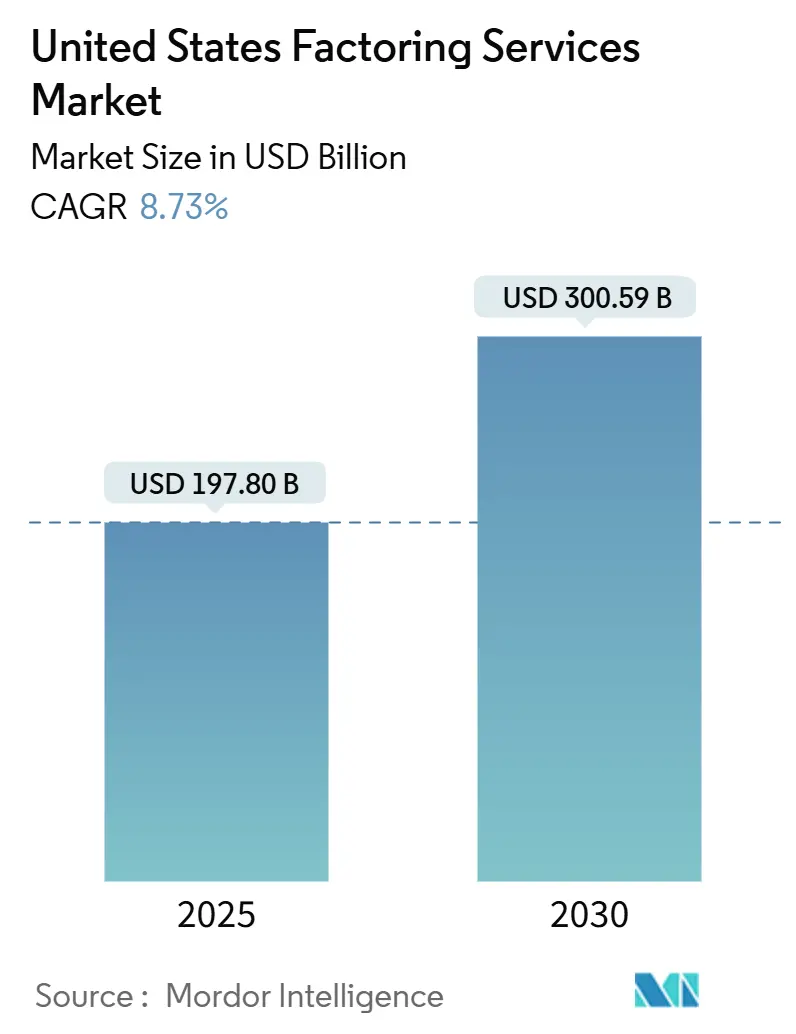
| Market Size (2025) | USD 197.80 Billion |
| Market Size (2030) | USD 300.59 Billion |
| Growth Rate (2025 - 2030) | 8.73% CAGR |
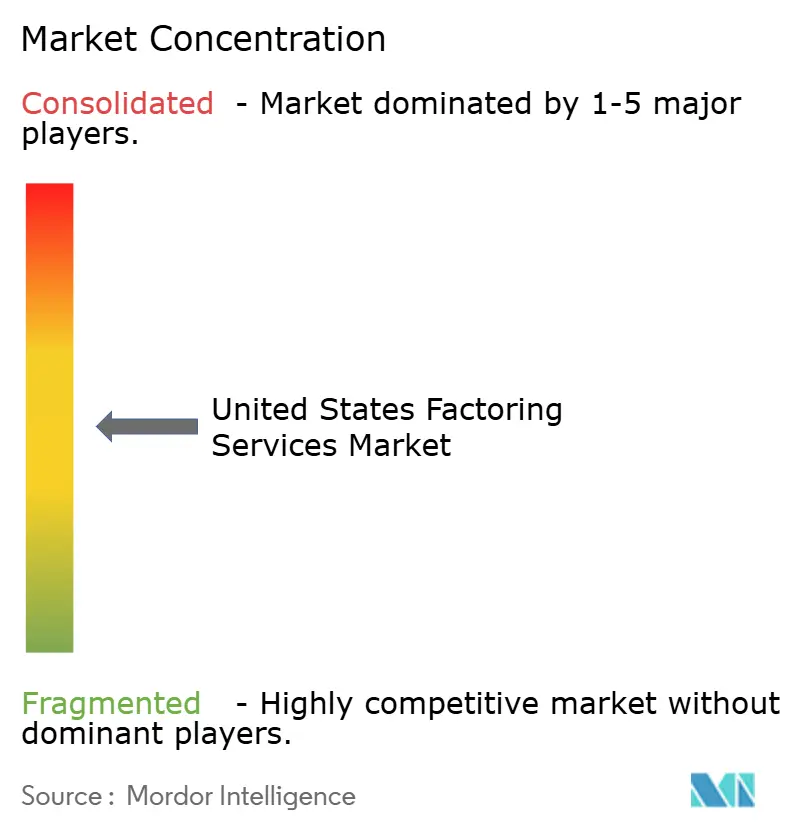
| Market Concentration | Medium |
Major Players *Disclaimer: Major Players sorted in no particular order Image © Mordor Intelligence. Reuse requires attribution under CC BY 4.0. | |
United States Factoring Services Market Analysis by Mordor Intelligence
The United States factoring services market size was USD 197.80 billion in 2025 and is projected to reach USD 300.59 billion by 2030, registering an 8.73% CAGR over the 2025-2030 period. The upward trajectory reflects a fundamental shift in working-capital strategy as bank lending tightens and small to medium-sized enterprises (SMEs) shift toward asset-based finance. Transportation, e-commerce, and manufacturing clients accelerate adoption because factoring converts 30- to 90-day receivables into same-day liquidity, mitigating cash-flow strain. Technology investments in digital onboarding and AI-driven risk analytics compress approval times, expand invoice eligibility, and strengthen fraud controls, widening the addressable customer base. Consolidation among bank-owned and independent players adds scale and reduces unit costs, allowing for price discipline even as service fees remain above those of conventional lines of credit.
Key Report Takeaways
- By industry vertical, transportation and logistics led with a 33.47% revenue share in 2024; retail and e-commerce are projected to grow at an 8.89% CAGR to 2030.
- By factoring category, recourse products captured 76.53% of the United States factoring services market size in 2024, while non-recourse alternatives are advancing at a 9.87% CAGR.
- By client size, SMEs accounted for 67.92% of the United States factoring services market size in 2024 and are projected to grow at a 9.78% CAGR between 2025 and 2030.
- By funding source, bank-owned factors represented 62.76% of the United States factoring services market share in 2024; independent factors are growing at a 9.93% CAGR.
United States Factoring Services Market Trends and Insights
Drivers Impact Analysis*
| Driver | (~) % Impact on CAGR Forecast | Geographic Relevance | Impact Timeline |
|---|---|---|---|
| SME credit-gap amid tighter bank lending | +2.1% | National, concentrated in Midwest and South manufacturing regions | Medium term (2-4 years) |
| Growth of e-commerce sellers requiring working capital | +1.8% | National, with early gains in West Coast tech hubs and Northeast urban centers | Short term (≤ 2 years) |
| Digital onboarding and e-factoring platforms | +1.4% | National, accelerated adoption in metropolitan areas | Medium term (2-4 years) |
| Supply-chain finance pull from large corporates | +1.2% | National, concentrated in industrial corridors and major ports | Long term (≥ 4 years) |
| AI-based risk analytics widening invoice eligibility | +0.9% | National, led by technology-forward factoring companies | Medium term (2-4 years) |
| UCC Article 9 revisions clarifying receivables financing | +0.7% | National, uniform implementation across all states | Long term (≥ 4 years) |
| Source: Mordor Intelligence | |||
SME credit gap amid tighter bank lending
Prime-rate hikes from 3.5% to 8.5% between April 2022 and July 2023 curtailed commercial lending appetite, forcing banks to elevate collateral thresholds and credit-score cut-offs. A Dallas Federal Reserve survey of 71 institutions in March 2023 confirmed material retrenchment, funneling SMEs toward factoring that underwrites receivables rather than borrower balance sheets. [1]Denim, “Freight Factoring vs. Line of Credit,” denim.com Transportation fleets unable to renew revolving lines now obtain advances within 24 hours, preserving fuel purchases and payroll. Regional disparities are evident, with manufacturing hubs in the Midwest and equipment-intensive operators in the South exhibiting the sharpest volume shifts, which explains the South’s 38.71% share. The credit gap also boosts hybrid products that blend factoring with inventory finance, widening average ticket sizes and lengthening customer tenure.
The growth of e-commerce sellers requires working capital.
Marketplace sellers struggle with 14- to 30-day platform payment holds that conflict with their daily inventory outlays. API-enabled e-factoring links directly into Amazon or Shopify dashboards, releasing funds in 24-48 hours and slashing working-capital cycles. Early adoption clusters around the tech corridors of California, Washington, and New York, where online merchants scale rapidly and value embedded finance. [2]FCI, “Industry Report Reveals Key Challenges in Invoice Finance,” fci.nl As cross-border parcel flows grow, factors attach foreign-exchange modules to shield sellers from currency risk, thereby deepening fee pools and supporting the 9.96% CAGR in international factoring.
Digital onboarding and e-factoring platforms
Legacy paper workflows historically stretched onboarding to weeks. Cloud portals now automate KYC, lien searches, and debtor credit checks, compressing setup time to hours and increasing client throughput. A 2025 industry survey found that 40% of respondents cited system-integration bottlenecks as the main obstacle; platform upgrades that combine AI scoring with real-time bank statement feeds address this gap. Triumph Financial reported USD 144 million in Q1 2025 factoring revenue and expects to double the figure after its next-generation audit platform migration. [3]Fintool, “TFIN Q1 2025 Earnings,” fintool.com Digital execution also underpins niche strategies, as independent factors target micro-SMEs via mobile apps, thereby widening their geographic reach without incurring branch overhead.
Supply-chain finance pulls from large corporates.
Reverse-factoring programs, orchestrated by OEMs and big-box retailers, invite approved factors to pay suppliers early, thereby strengthening supplier resilience while leveraging the buyer’s credit rating. Sectors with 60- to 90-day payables, such as healthcare and defense contracting, experience the most pronounced pull effect. Integration with enterprise resource planning systems automates invoice approval and data transfer, seamlessly embedding factoring into corporate treasury workflows. For factors, the model yields lower default risk, higher invoice sizes, and multi-tier cross-sell opportunities, supporting long-run CAGR expansion.
Restraints Impact Analysis*
| Restraint | (~) % Impact on CAGR Forecast | Geographic Relevance | Impact Timeline |
|---|---|---|---|
| High service fees vs. bank credit lines | -1.3% | National, more pronounced in competitive metropolitan markets | Medium term (2-4 years) |
| Fraud risk from duplicate invoices | -0.8% | National, concentrated in high-volume transaction regions | Short term (≤ 2 years) |
| Non-standard digital documentation among SMEs | -0.6% | National, particularly affecting rural and traditional industries | Medium term (2-4 years) |
| State-level rate-cap legislation threats | -0.4% | Regional, focused on states with consumer-protection emphasis | Long term (≥ 4 years) |
| Source: Mordor Intelligence | |||
High service fees vs. bank credit lines
Even at a 13% interest rate, a USD 5,000 one-month bank advance costs USD 47.88, whereas a 2% factoring fee doubles the outflow. The spread widens for credit-worthy mid-market borrowers that qualify for subprime rates, prompting price-sensitive firms to oscillate between facilities. Bundled discounts, wire fees, and administrative fees further obscure the total cost, elevating customer-education expenses and prolonging sales cycles. In metropolitan areas with numerous banking options, fee resistance is acute, tempering the penetration of established enterprises.
Fraud risk from duplicate invoices
Submitting identical invoices to multiple factors inflates loss ratios and raises due diligence costs. Blockchain registries and AI-driven duplicate detectors mitigate exposure, but adoption remains uneven. Emerging players without robust verification incur higher write-offs, thereby elevating risk premiums that are passed on to clients. While UCC Article 9 offers legal recourse, multi-state lien filings complicate enforcement, lengthening collection timelines and eroding margins. Persistent fraud pressures stall growth in high-volume corridors such as Southern California logistics hubs.
*Our forecasts treat driver/restraint impacts as directional, not additive. The impact forecasts reflect baseline growth, mix effects, and variable interactions.
Segment Analysis
By Factoring Category: Risk Transfer Drives Premium Growth.
Recourse transactions retained 76.53% of the United States factoring services market share in 2024; yet, non-recourse solutions are expanding at a 9.87% CAGR as clients seek full credit-risk outsourcing. The average non-recourse premium of 0.5-1.5 percentage points signals a strong willingness to pay amid economic uncertainty. Healthcare providers adopt non-recourse structures to offset complex insurer reimbursements, while independent factors develop hybrid models that price risk at the invoice level to preserve margin. Technology enables granular scoring, letting factors toggle between recourse and non-recourse settings automatically, thereby scaling without proportionate headcount growth. The two-pronged demand sustains overall United States factoring services market expansion by capturing both risk-averse and price-sensitive clientele.
Demand dynamics differ across debtor profiles. Freight brokers with diversified shipper bases continue to favor recourse deals to minimize fees, whereas clinics reliant on a few insurers opt for non-recourse coverage. The interplay stabilizes portfolio returns and cushions factors against sector-specific downturns, aiding underwriting diversification and regulatory capital optimization.


By Type: International expansion outpaces domestic growth
Domestic deals accounted for 87.64% of the United States factoring services market size in 2024; however, international transactions are accelerating at a 9.96% CAGR as exporters struggle with longer payment cycles and foreign-exchange volatility. Cross-border deals command 1-2 percentage-point higher fees, offsetting added diligence costs and supporting margin growth. Factors market-bundles services—trade credit insurance, FX hedging, and overseas legal collection-to manufacturers shipping to Mexico and Canada, adding value beyond liquidity. E-commerce exporters amplify momentum by leveraging digital platforms that pre-verify foreign buyers, shortening approval timelines. Domestic volume remains anchored by standardized UCC frameworks and deep broker relationships, yet margin compression encourages capital redeployment into international niches.
Operational models diverge: bank-owned factors rely on correspondent networks for global coverage, while independents partner with specialized agents, preserving asset-light scalability. Regulatory harmonization under the United Nations Convention on Receivables Financing could further streamline documentation, widening the international opportunity set.
By Industry Vertical: Transportation leads while retail accelerates
Transportation and logistics captured 33.47% of the United States factoring services market share in 2024, reflecting chronic cash lags between freight delivery and broker payment. Fuel price swings and compliance costs heighten working-capital volatility, making same-day advances indispensable. Industry-specialist factors bundle fuel-card discounts and freight-bill collections, deepening wallet share and lowering churn. Retail and e-commerce exhibit the fastest 8.89% CAGR, buoyed by rapid inventory cycles and platform payment holds. Embedded factoring APIs in marketplace dashboards ease adoption, enabling even micro-sellers to unlock cash within hours.
Manufacturing retains steady demand as reshoring revitalizes domestic supply chains, while healthcare grows through niche factors, including expertise in HIPAA and Medicaid billing complexities. Construction uptake hinges on project-based milestones and lien law navigation; specialized legal teams within factors mitigate risk, justifying premium pricing.
By Client Size: SME Dominance Accelerates Growth.
SMEs held 67.92% of the United States factoring services market size in 2024 and are growing at a 9.78% CAGR, as bank credit scoring penalizes thin files and volatile cash flows. Mobile apps and digital KYC reduce onboarding costs, letting factors profitably serve tickets as small as USD 5,000. Large enterprises use factoring tactically-such as for seasonal SKU launches or divisional carve-outs-limiting volume growth despite holding bulk receivables. For SMEs, factoring transcends emergency liquidity, evolving into an always-on cash-management tool integrated with accounting software.
Influencers include demographic shifts; minority-owned startups, often underbanked, adopt factoring early, fostering inclusive finance. As SaaS accounting suites incorporate embedded factoring options, SME penetration is expected to increase further, strengthening overall market resilience.

By Funding Source: Independent factors gain a competitive edge
Bank-owned units control low-cost balance-sheet funding, which undercuts independents on price; however, regulatory capital burdens and product specialization gaps constrain their agility. Independent factors, growing at 9.93% CAGR, leverage sector expertise and real-time approvals to win share in niche verticals. Private-equity roll-ups inject institutional capital, enabling multi-state expansion while retaining underwriting autonomy. Recent purchases, such as SLR Investment’s USD 115 million acquisition of Webster Bank’s portfolio, illustrate convergence, as non-bank owners absorb bank-originated assets for yield pickup. Competitive dynamics revolve around technology spending; independents deploying AI scoring and blockchain verification close the funding-cost gap by slashing default and servicing expenses.
Hybrid partnerships emerge as banks white-label digital platforms from fintech firms, capturing fee income without absorbing credit exposure. The symbiosis broadens distribution and enhances product depth, reinforcing the momentum of consolidation.
Geography Analysis
The South generated 38.71% of 2024 factoring revenues, anchored by dense freight corridors and diversified manufacturing clusters. Texas dominates within the region, pairing petrochemical exports with domestic consumer goods flows through Interstate 35. Nearshoring of Mexican supply chains adds bilingual documentation complexity, increasing demand for specialized factors. State economic incentives for small fleets and port-expansion projects further elevate receivables volume.
The West posts the fastest 9.43% CAGR, propelled by tech-centric SMEs and cross-Pacific trade. California’s e-commerce merchants rely on factoring for inventory turns, while port congestion drives demurrage costs that factors now finance as ancillary advances. Venture-backed startups, comfortable with alternative finance, normalize factoring earlier in the business lifecycle. Logistics providers tied to Amazon’s fulfillment network in Washington and Oregon are adopting fuel-advance products, thereby extending their regional reach.
Northeast volume remains stable; sophisticated financial services infrastructure spawns competitive pricing and hybrid offerings that blend supply-chain finance with receivables management. The Midwest benefits from automotive and agricultural exports, but faces plant relocations to the South, which pressures the need to diversify client bases. Nonetheless, embedded factoring inside OEM supplier portals sustains baseline demand. Region-specific state law nuances, particularly regarding UCC filings, shape operational models but do not significantly hinder national expansion plans.
Competitive Landscape
Market fragmentation prevails, yet compliance and technology outlays are catalyzing consolidation. Three tiers crystallize: national bank-owned factors, mid-market independents, and regional specialists. Scale players exploit core-deposit funding and cross-sell treasury services; independents counter with sector depth and AI underwriting that approves clients in hours. Love’s Travel Stops’ September 2025 purchase of REV Capital’s 500-customer book integrates fuel and finance, securing embedded demand inside its truck-stop network. SLR Investment’s USD 115 million buyout of Webster Bank’s unit underscores capital-market interest in high-yield factoring assets.
White-space opportunities persist in renewable-energy suppliers, medical-technology distribution, and cross-border e-commerce segments, all of which feature payment lags and regulatory complexity that reward specialized knowledge. Technology serves as the decisive moat: blockchain registry pilots reduce duplicate-invoice fraud, while predictive analytics refine advance rates. Factors unable to fund modernization seek buyers, feeding a roll-up pipeline for private-equity sponsors. The interplay sustains margin stability despite fee pressures from bank competitors.
United States Factoring Services Industry Leaders
CIT Group Inc. (a division of First Citizens Bank)
Triumph Financial, Inc.
Bibby Financial Services, Inc.
altLINE – The Southern Bank Company
eCapital Corp.
- *Disclaimer: Major Players sorted in no particular order

Recent Industry Developments
- September 2025: Love’s Travel Stops acquired REV Capital’s factoring portfolio, adding 500+ trucking customers and pairing fuel discounts with receivables finance.
- August 2025: Porter Capital merged with Pay4Freight, combining factoring expertise and digital workflow to enhance transportation client experience.
- July 2025: SLR Investment Corp bought Webster Bank’s USD 115 million portfolio, signaling continued consolidation of bank-owned assets.
- June 2025: Culain Capital purchased Quickpay Funding, extending freight-factoring reach across the Midwest and South.


United States Factoring Services Market Report Scope
| Recourse |
| Non-Recourse |
| Domestic Factoring |
| International Factoring |
| Transportation and Logistics |
| Manufacturing |
| Retail and E-commerce |
| Healthcare |
| Construction |
| Other Industry Verticals |
| Small and Medium Enterprises (SMEs) |
| Large Enterprises |
| Bank-Owned Factors |
| Independent Factoring Companies |
| By Factoring Category | Recourse |
| Non-Recourse | |
| By Type | Domestic Factoring |
| International Factoring | |
| By Industry Vertical | Transportation and Logistics |
| Manufacturing | |
| Retail and E-commerce | |
| Healthcare | |
| Construction | |
| Other Industry Verticals | |
| By Client Size | Small and Medium Enterprises (SMEs) |
| Large Enterprises | |
| By Funding Source / Provider Type | Bank-Owned Factors |
| Independent Factoring Companies |


Key Questions Answered in the Report
What is the current value of the United States factoring services market?
The market was valued at USD 197.80 billion in 2025.
How fast is the United States factoring services market expected to grow?
It is forecast to post an 8.73% CAGR between 2025 and 2030.
Which industry vertical contributes the largest share of factoring volume?
Transportation and logistics accounted for 33.47% of 2024 revenue.
Why are SMEs the dominant client group for factoring in the United States?
Tight bank credit standards and digital onboarding make factoring the primary working-capital source for SMEs, capturing 67.92% of 2024 volume.
Which region is growing fastest in United States factoring services?
The West is projected to expand at a 9.43% CAGR through 2030, led by e-commerce and tech-sector demand.
How do factoring fees compare with a bank line of credit?
A typical 2% monthly factoring fee on a USD 5,000 advance costs USD 100, roughly double the interest on a 13% annual-rate bank line for the same period.
Page last updated on:


