
Market Overview
| Study Period | 2020 - 2031 |
|---|---|
| Forecast Data Period | 2026 - 2031 |
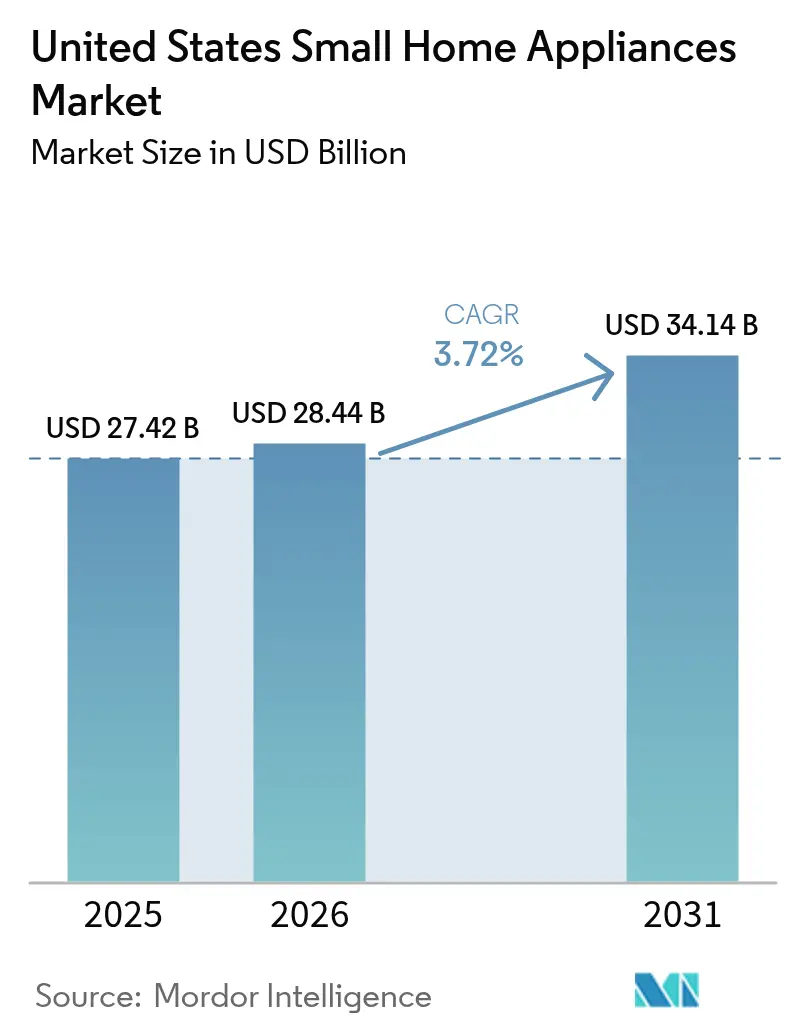
| Base Year Market Size (2025) | USD 27.42 Billion |
| Market Size (2026) | USD 28.44 Billion |
| Market Size (2031) | USD 34.14 Billion |
| Growth Rate (2026 - 2031) | 3.72% CAGR |
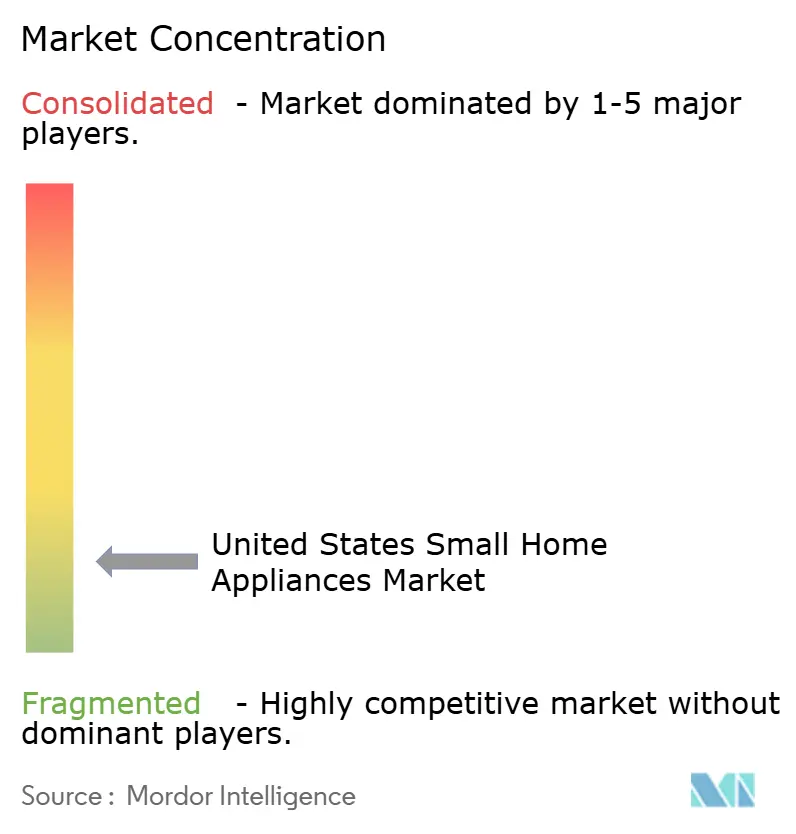
| Market Concentration | Low |
Major Players *Disclaimer: Major Players sorted in no particular order Image © Mordor Intelligence. Reuse requires attribution under CC BY 4.0. | |
United States Small Home Appliances Market Analysis by Mordor Intelligence
The United States small home appliances market size is expected to grow from USD 27.42 billion in 2025 to USD 28.44 billion in 2026 and is forecast to reach USD 34.14 billion by 2031 at 3.72% CAGR over 2026-2031. Steady growth reflects a marketplace where energy-efficiency rules, digital connectivity, and tariff-driven cost dynamics now shape product roadmaps more than sheer volume gains. Federal energy-conservation standards, particularly the Department of Energy’s newly finalized cooking-product rules effective January 2028, are spurring R&D investment aimed at reducing kilowatt-hour consumption while preserving performance[1]U.S. Department of Energy, “Energy Conservation Standards for Cooking Products,” energy.gov . Rapid smart-appliance adoption, aided by common protocols such as Matter 1.4, is moving connectivity from novelty to baseline expectation and enabling premium pricing tiers[2]Qual¬comm, “Matter 1.4 and the Future of Smart Home Interoperability,” qualcomm.com. E-commerce acceleration is widening manufacturer margins through direct-to-consumer (DTC) channels while lowering average transaction prices for shoppers.
Key Report Takeaways
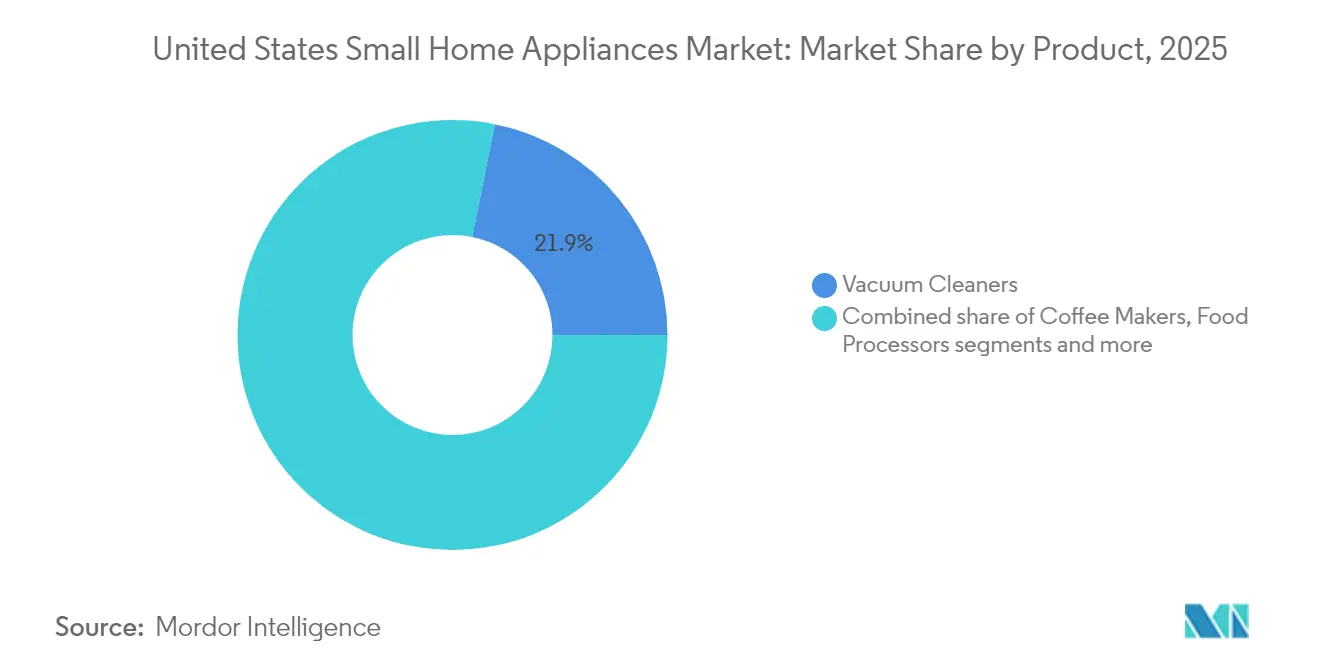
- By product, vacuum cleaners held 21.85% of the US small home appliances market size in 2025; air fryers headline growth with a 7.35% CAGR to 2031.
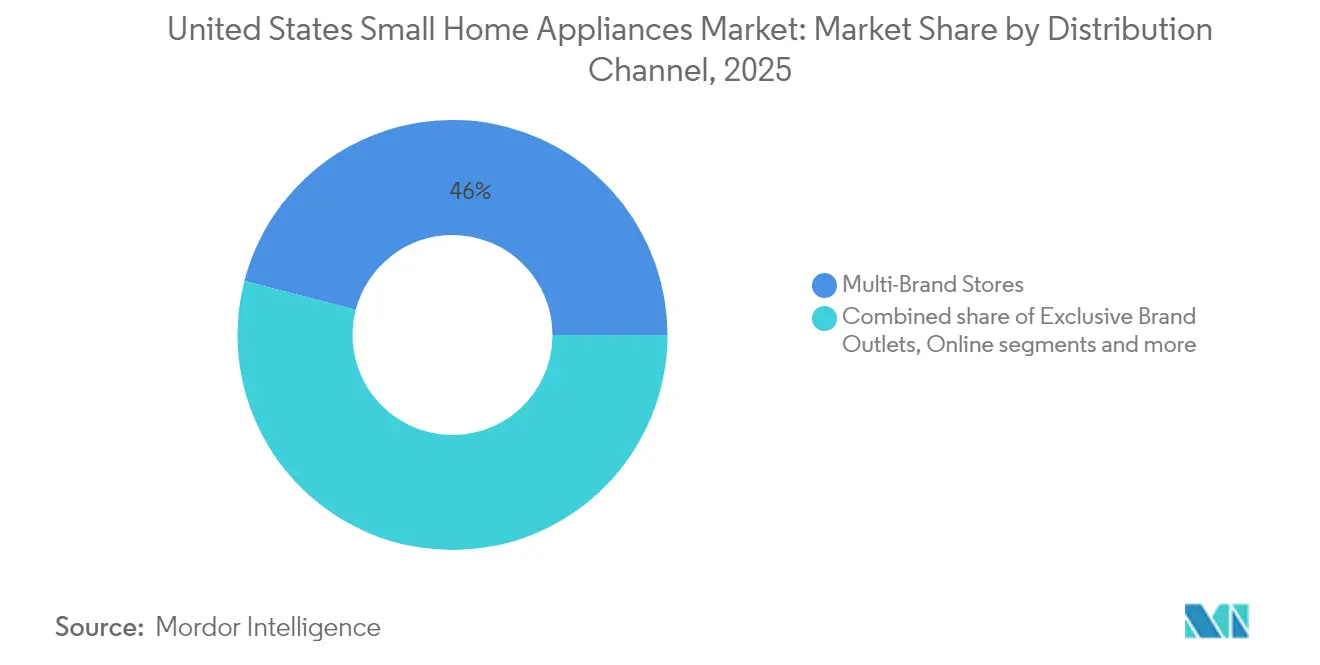
- By distribution channel, multi-brand stores led with a 45.95% of the US small home appliances market share in 2025, while online sales expanded at a 6.05% CAGR through 2031.
- By geography, the Southeast captured 33.45% of 2025 revenue; the West registers the fastest 4.92% CAGR to 2031.
Note: Market size and forecast figures in this report are generated using Mordor Intelligence’s proprietary estimation framework, updated with the latest available data and insights as of 2026.
United States Small Home Appliances Market Trends and Insights
Drivers Impact Analysis*
| Driver | (~) % Impact on CAGR Forecast | Geographic Relevance | Impact Timeline |
|---|---|---|---|
| Energy-efficiency regulations and utility-cost awareness | +0.8% | California, Northeast | Medium term (2–4 years) |
| Rapid adoption of smart and connected appliances | +1.2% | West Coast, urban centers nationwide | Long term (≥ 4 years) |
| Expansion of e-commerce and DTC models | +0.6% | Suburban markets nationwide | Short term (≤ 2 years) |
| Housing starts, renovation boom, and replacement cycles | +0.9% | Southeast, West | Medium term (2–4 years) |
| Growing disposable income, changing lifestyles, and urbanization | +0.5% | Metropolitan areas | Long term (≥ 4 years) |
| Source: Mordor Intelligence | |||


Energy-Efficiency Regulations and Utility-Cost Awareness
Federal appliance standards are shortening innovation cycles as vendors redesign platforms to meet lower kilowatt-hour ceilings while maintaining price points that satisfy value-oriented shoppers. The Department of Energy projects its latest water-heater rules will trim US energy use by 17.6 quadrillion Btu over 30 years, underscoring the payoff for high-efficiency compressors and heat-pump integrations[3]Federal Register, “Energy Conservation Program: Energy Conservation Standards for Dishwashers,” federalregister.gov. Dishwasher caps of 223 kWh per year from April 2027 further accelerate the adoption of brushless motors and proprietary heat-recovery modules, prompting system-level design around kitchen ecosystems rather than single units. California’s above-average electricity tariffs heighten consumer payback scrutiny, letting brands with credible Energy Star labels lift average selling prices without eroding demand. Parallel rules for commercial walk-in coolers spill upstream to residential suppliers that share evaporator and insulation sourcing, reinforcing scale advantages for vertically integrated producers.
Rapid Adoption of Smart and Connected Appliances
According to Houzz's "2024 U.S. Kitchen Trends Study," connected appliances penetration reached 30% of US kitchen renovations in 2024, and Wi-Fi is now table stakes, not an upsell. Samsung’s 2025 Bespoke AI range, equipped with 9-inch screens and food-recognition vision, illustrates how embedded intelligence commands premium shelf placement and lifts attachment rates for companion apps. GE Appliances’ SmartHQ platform provisions predictive-maintenance alerts that reduce warranty claims and stimulate aftermarket part sales[4]GE Appliances, “AI-Powered Kitchen Innovations Announced February 2025,” geappliances.com. Interoperability progress under Matter 1.4 reduces consumer risk of ecosystem lock-in, while on-device AI sidesteps privacy pushback linked to cloud-based data retention. Yet advanced mapping in robotic vacuums has drawn scrutiny from privacy advocates, signaling that feature depth must remain balanced against data-security assurances to preserve adoption momentum.
Expansion of E-Commerce and Direct-to-Consumer Models
Digital channels cemented structural gains that emerged during pandemic shutdowns, with 45% of small-appliance buyers now initiating purchase journeys online. DTC strategies yield higher gross margins by bypassing retail slotting fees; SharkNinja’s 2024 net-sales jump of 30%—propelled by optimized search ads and social-commerce tie-ins—illustrates earnings leverage when traffic shifts to proprietary storefronts. Price transparency and dynamic discounting pull average e-commerce selling prices below in-store benchmarks, increasing category penetration among price-sensitive households. Virtual showrooms, augmented-reality placement tools, and live-stream demos now replicate tactile assessment barriers once unique to brick-and-mortar.
Growing Disposable Income, Changing Lifestyles, and Urbanization
Sustained wage gains and moderating inflation keep discretionary budgets intact, supporting substitution from manual to automated solutions even in a maturing US small home appliances market. The share of one-person households continues to climb, favoring compact multifunction devices such as air-fryer-toaster hybrids that optimize counter real estate. Viral social-media recipes, notably on TikTok and Instagram Reels, have catapulted air fryers to mainstream status, creating knock-on demand for pre-packaged meal components optimized for the format. Millennials typically accept higher price tags for connectivity, while Gen Z values low-friction convenience; both demographics enter peak household-formation years, sustaining demand for feature-rich models that promise time savings and healthier cooking.
Restraints Impact Analysis*
| Restraint | (~) % Impact on CAGR Forecast | Geographic Relevance | Impact Timeline |
|---|---|---|---|
| Volatile raw materials and semiconductor pricing | −0.7% | Global, import-dependent manufacturers | Short term (≤ 2 years) |
| Supply-chain disruptions and freight-cost pressures | −0.5% | West Coast ports, national logistics | Medium term (2–4 years) |
| Intensifying price competition and private-label expansion | −0.4% | Value-oriented retail channels | Long term (≥ 4 years) |
| Right-to-repair legislation extending product lifecycles | −0.3% | California, Minnesota | Long term (≥ 4 years) |
| Source: Mordor Intelligence | |||
Volatile raw materials and semiconductor pricing
Copper trading above USD 10,000 per metric ton inflates refrigeration-circuit costs by up to 4.2%, forcing OEMs to pursue hedging or redesign evaporator geometries to reduce metal load factors. Global chip shortfalls continue to delay launch calendars for feature-laden models, prolonging SKUs based on legacy microcontrollers and throttling innovation cadence. Steel-based appliance tariffs of 50% effective June 2025, close former import-arbitrage windows and amplify cost inflation that outpaces household wage growth, risking price-driven demand pullbacks.
Supply-chain disruptions and freight-cost pressures
Consecutive 25% levies on Canadian and Mexican imports compel brands such as Bosch and Samsung to reroute component flows, incurring transitional inventory spikes and capital expenditures for North American capacity. Port congestion intermittently snarls inbound shipments, undermining just-in-time models and prompting inventory buffers that tie up working capital. Labor constraints in logistics and assembly—exacerbated by tighter immigration policies—extend lead times, with ripple effects most acute in vacuum-cleaner motors and food-processor gearboxes that rely on high-touch machining. OEM responses include near-shoring of plastics molding and regionalized distribution hubs, but interim duplication of production footprints raises per-unit conversion costs until volume scale catches up.
*Our forecasts treat driver/restraint impacts as directional, not additive. The impact forecasts reflect baseline growth, mix effects, and variable interactions.
Segment Analysis
By Product: Air fryers Transform Kitchen Dynamics
Vacuum cleaners preserve the largest 21.85% share, yet robotic entrants backed by aggressive Chinese pricing pressure are squeezing margins, prompting incumbents to layer navigation AI and subscription consumables to stabilize revenues. Air fryers generated the fastest 7.35% CAGR through 2031 as consumers pursued healthier cooking that mimics deep-fried textures without submerging food in oil. The US small home appliances market size for air fryers is projected to grow significantly by 2030, illustrating how a formerly niche tool became central to weeknight meal prep. Food companies now co-develop SKUs engineered for air-fryer performance, while appliance makers incorporate dual-basket designs and app-based recipe platforms to extend usage occasions.
Coffee makers and electric kettles benefit from premiumization as consumers chase café-quality extraction at home. Specialty espresso units with PID-controlled boilers and smartphone telemetry lift attachment sales of branded beans and descaling kits. Food processors and blenders see brand consolidation. Countertop ovens now bundle air-fry and dehydration modes, dissolving historical product silos and encouraging modular component sourcing. The residual “other” segment—waffle irons, mini-rice cookers, niche sous-vide sticks—leverages social-media micro-trends, yielding burst demand cycles that savvy suppliers satisfy via limited-run drops through DTC storefronts.


By Distribution Channel: Online Acceleration Reshapes Retail
Multi-brand stores remained primary, holding 45.95% of 2025 revenue, as wide assortments and instant-take-home appeal to shoppers equipped new properties. Even so, the online pathway’s 6.05% CAGR through 2031 outpaces all offline formats, powered by persistent convenience and broadened acceptance of virtual try-before-you-buy tools. Average digital basket sizes benefit from algorithmic cross-selling (filters for compatible accessories) that brick-and-mortar staff cannot replicate at scale. Exclusive brand outlets face cannibalization as manufacturers escalate DTC pushes that furnish first-party data streams, fueling agile product development. Warehouse clubs and specialty retailers defend their share by layering installation, haul-away, and extended-service packages that digital‐only rivals seldom match. Omnichannel fulfillment options—order online, pick up in store—now function as table stakes, requiring unified inventory visibility and consistent pricing to avoid consumer backlash.
Geography Analysis
The Southeast anchored 33.45% of 2025 sales, lifted by inbound population migration and robust single-family housing starts across Florida, Georgia, and North Carolina. Strong retail footprints for Home Depot and Lowe’s streamline product availability, while comparatively lower utility rates ease the payoff hurdle for mid-tier efficiency models. Appliance bundles tied to builder packages gain traction as regional construction firms embed turnkey kitchen and laundry sets into closing contracts, supporting volume incentives for large OEMs.
The West commands the fastest 4.92% CAGR through 2031, propelled by tech-savvy households in California, Washington, and Colorado that over-index on smart-home adoption. Mountain-state infrastructure investment fuels above-average electrical supply growth, with Nevada reporting 10% and Montana 8% uptick, both translating into retail appliance demand. Metropolitan real-estate constraints drive the popularity of convertible countertop products, while suburban clusters maintain an appetite for full-capacity dishwashers and high-output ranges.
The Northeast and Midwest offer mature but dependable revenue streams. The Northeast’s aging housing stock forces cyclical replacements, and high kilowatt-hour prices boost demand for Energy Star dishwashers despite colder winters that elevate household heating bills. Major universities catalyze early adoption of Wi-Fi-enabled equipment through research partnerships, seeding broader consumer familiarity. The Midwest, meanwhile, combines stable employment with value orientation; mass retailers flourish, yet premium-brand showrooms in cities like Chicago attract upwardly mobile buyers. The Southwest straddles both dynamics: growth hubs such as Phoenix and Austin replicate West Coast tech preferences, whereas rural counties gravitate toward price-focused multipurpose appliances.
Regulatory Landscape
The United States small home appliances market operates under overlapping federal energy-efficiency and consumer-safety regimes. The US Department of Energy (DOE), under EPCA, administers test procedures and energy conservation standards across a broad appliance set; for consumer conventional cooking products, DOE adopted amended standards in a direct final rule dated February 2024 with a compliance date of January 31, 2028, pushing manufacturers to align product roadmaps, testing, and certification plans well ahead of the effective window.\n\nRulemaking mechanics also shape compliance risk. DOE revised its appliance standards Process Rule in April 2024 (effective June 24, 2024), and issued further process-related activity in July 2026 through a Federal Register notice tied to revisions in DOE procedures for considering new or revised standards. On safety, the US Consumer Product Safety Commission (CPSC) oversees hazards for consumer appliances and works with voluntary standards bodies; CPSC staff engagement around UL 1026 for electric household cooking appliances (including requests to incorporate mechanical performance requirements relevant to pressure cooker hazards) highlights how voluntary standards updates can translate into design and validation changes for countertop cooking products.
Value Chain Analysis
Small home appliances value creation begins with upstream raw materials (plastics, steel, copper) and components (motors, heating elements, sensors, electronic controls, and semiconductors), followed by product design, tooling, and assembly across a mix of offshore production and North American finishing/packaging. Tariff-driven input cost volatility and semiconductor availability affect bill-of-materials decisions, feature sets, and launch cadence, encouraging multi-sourcing of electronics, redesigns to reduce metal intensity, and selective near-shoring for parts with long lead times.\n\nDownstream, importers, wholesalers, and national retailers provide scale distribution, while online marketplaces and direct-to-consumer storefronts play a growing role in demand capture and first-party data collection. The distribution layer includes appliance and electronics wholesalers that bridge manufacturers with mass merchants, home improvement chains, and specialty retailers; at the same time, manufacturers are strengthening regional logistics nodes to buffer port congestion and trucking labor constraints. In parallel, investment into US manufacturing footprints by large appliance players (for example, GE Appliances manufacturing investments announced in 2025) signals a broader supplier-network push that can also improve lead times and localized sourcing options for adjacent small-appliance categories sharing motors, controls, and molded-plastics supply.
Competitive Landscape
The US small home appliances market remains fragmented, though category-specific concentration differs sharply. SharkNinja’s 2024 revenue reached USD 5.53 billion, a 30% leap credited to ice-cream makers and blenders that tap viral at-home beverage trends [5]SharkNinja Holdings, “Q4 2024 Earnings Release,” investor.sharkninja.com. iRobot’s share erosion—from 22.3% to 13.7%—illustrates disruption risk when fast-follower Chinese entrants undercut pricing with acceptable performance.
Technology leadership drives out-performance: Samsung grabbed a significant share of US robot-vacuum unit sales within two launch cycles, leveraging edge-derived room-mapping and cross-device integration via SmartThings. Private-label encroachment by retailers like Target and Costco compresses mid-tier margins.
Strategic responses include near-shoring component plants to blunt tariff shocks, forging semiconductor allocation agreements, and acquiring niche IP (e.g., advanced air-fry heating elements) to accelerate feature backlog delivery. ESG commitments around recycled plastics and repairability guidelines showcase brand differentiation in sustainability-minded cohorts, while alliances with recipe-content platforms broaden value-chain reach beyond hardware into digital services.
United States Small Home Appliances Industry Leaders
SharkNinja Operating LLC
Hamilton Beach Brands Holding Company
Dyson Ltd.
Keurig Dr Pepper Inc.
Breville Group Ltd.
- *Disclaimer: Major Players sorted in no particular order

Market Opportunities and Future Outlook
Smart-home interoperability and on-device intelligence create clear whitespace in feature-led segments where consumers are moving connectivity from novelty to baseline. Evidence of adoption is visible in renovation-driven demand, with connected appliances reaching 30% penetration in US kitchen renovations in 2024 (Houzz), and ecosystem platforms such as Samsung SmartThings and GE Appliances SmartHQ reinforcing cross-device experiences that extend beyond a single countertop product. For small appliances, this supports opportunities in app-enabled cooking and beverage systems (recipe guidance, personalization, and consumables attachment) and in connected cleaning products that translate mapping and maintenance data into service and accessory revenue.\n\nSupply-chain localization and component readiness are also active opportunity areas as tariffs and freight variability push companies to restructure sourcing. US manufacturing investments announced by GE Appliances in 2025, and Whirlpool Corporation's April 2026 USD 60 million investment in an Ohio facility to produce appliance components and subassemblies, signal a shift toward regionalized component supply and faster replenishment cycles. For small home appliance brands, closer-to-market sourcing and modular platforms can reduce exposure to import disruptions while enabling quicker refresh cycles in fast-moving categories such as air fryers, countertop ovens, and floor care, where feature differentiation and rapid SKU iteration drive shelf and online search performance.
Recent Industry Developments
- July 2026: SharkNinja launched the Shark Beauty FlexStyle IonCurl multi-styler, adding a higher-power variant to its multi-styling lineup. The move broadens SharkNinja's personal care portfolio alongside its core kitchen and floor care categories, helping it capture more share of consumer spending across small, plug-in home devices.
- March 2025: Samsung introduced its 2025 Bespoke AI lineup with integrated displays, food-recognition capabilities, and Knox Matrix security features. This reinforced the premiumization pathway for connected appliances and raised competitive requirements around user interface, embedded intelligence, and device-level security messaging.
- February 2024: Hamilton Beach Brands Holding Company acquired HealthBeacon plc, expanding into home health and wellness technology adjacent to its traditional small appliance portfolio. The acquisition diversified its product ecosystem toward recurring-use, in-home devices and opened cross-channel retail opportunities beyond kitchen and floor care.


Research Methodology Framework and Report Scope
Market Definition and Coverage
For this study, the market covers the yearly value of small, portable home appliances sold in the United States that run on electricity (plug in or battery) and are used for cooking, cleaning, air treatment, and personal care.
Scope exclusions: Large fixed appliances (such as refrigerators, ranges, washers, and HVAC units) and non-powered mechanical gadgets are not counted.
Segmentation Overview
- By Product
- Coffee Makers
- Food Processors
- Grills and Roasters
- Electric Kettles
- Juicers and Blenders
- Air Fryers
- Vacuum Cleaners
- Toasters
- Countertop Ovens
- Other Small Home Appliances (Waffle Makers, Deep Fryers, Egg Cookers, Tea Makers, Rice Cookers, Etc.)
- By Distribution Channel
- Multi-Brand Stores
- Exclusive Brand Outlets
- Online
- Other Distribution Channels
- By Geography
- Northeast
- Southeast
- Midwest
- Southwest
- West
Data Sources, Market Sizing, and Validation
Desk Research
Desk work starts by confirming what should be treated as a small home appliance in the United States, and then pulling the most stable public signals that can explain demand and pricing movement over time. For foundational market structure, we refer to non-paywalled sources such as US Census Bureau datasets, USITC trade statistics, BLS price and consumer spending series, and US DOE rulemakings and standards that can affect replacement and efficiency-driven upgrades.
To complete the picture, we also use sources such as SEC filings and investor presentations, association websites and standards body publications (including energy and connectivity-related updates), and reputable press coverage of retailer programs and category performance. In a few places, a paid subscription is used for company financials and news screening, and an import-export shipment-level database is used selectively to cross-check category direction. These examples are not exhaustive, and many other public documents and data series were also used for collection, cross-checking, and clarifying unclear points.
Primary Interviews and Surveys
Primary work is used to validate what is actually being sold and how categories are separated when products look similar across retail shelves. We spoke with manufacturers, distributors, retailers, and service-side participants across the United States to confirm category splits, channel mix, promotion cadence, and the direction of average selling prices. Assumptions were then revisited when interview feedback did not match desk signals.
Distribution of primary research fieldwork respondents
| Company type | Respondent position | Region |
|---|---|---|
| Top tier: 30% | CXOs: 17% | |
| Mid tier: 49% | Functional/Unit leaders: 41% | |
| Smaller Players: 21% | Managers: 42% |
Market-Sizing & Forecasting
Sizing is built mainly through a top-down approach, where US production and trade series and category-level demand signals are used to reconstruct the value pool that fits the portable small-appliance definition, and then it is split across key product groupings. To keep the math grounded, we also corroborate totals using selective bottom-up approximations such as sampled average selling price ranges multiplied by indicative unit volumes, plus channel checks on sell-through intensity.
Inputs used in the model include household formation and replacement behavior, e-commerce share changes, pricing and promotion patterns that move mix toward premium models, and the speed of feature adoption, such as smart connectivity and energy-efficiency upgrades. When historical data is incomplete for a niche product, we bridge gaps using proxy indicators from adjacent categories and then adjust with interview feedback so the implied penetration does not look unrealistic.
For forecasting, scenario-based analysis is applied and tuned with expert views on inflation, discretionary spend pressure, and retailer inventory cycles. Once these variables are projected, the value forecast is derived from the expected volume trend and a practical ASP path by category, and then we recheck the totals against the broader home appliance spend direction to catch any outliers.
Data Validation & Update Cycle
Validation is done through multiple checks so the final number is not driven by any single source. We compare model outputs with independent signals such as trade direction, price series movement, and category news, and then review any spikes that do not match the observed market story.
Before sign-off, the work is peer-reviewed and key assumptions are stress-tested, including currency timing, category mapping, and implied unit and ASP combinations. Reports are refreshed annually, and interim updates are triggered when material events occur such as major regulatory changes, sharp demand swings, or a step-change in channel structure. Right before delivery, the latest public releases are checked again so clients receive an up-to-date view.
Mordor Intelligence's United States Small Home Appliances Market Sizing Compared With Other Published Estimates
Published market sizes for US small home appliances can look different even when they appear to cover the same products, because the product list, pricing logic, and timing choices are not identical across sources. The spread usually comes from what is counted as a small appliance, which year is treated as the base, and how inflation and mix are carried into the forecast.
Some external estimates appear to use a broader household scope that can pull in adjacent powered items beyond routine cooking, cleaning, air treatment, and personal care, which tends to lift the total even if core demand is similar. In Mordor Intelligence's approach, the count is limited to portable electric small appliances aligned to NAICS 335210, and large fixed appliances and non-powered gadgets are excluded, which keeps the number tied to a consistent demand pool.
Benchmark comparison
| Source | Market Size | Gaps in Research Methodology |
|---|---|---|
| Mordor Intelligence | USD 27.42 B (2025) | |
| Industry Publisher A | USD 32.02 B (2025) | Uses a wider inclusion list by type and application, which can pull in adjacent household categories and lift the total even if core small-appliance demand is similar. |
| Press Release B | USD 27.17 B (2023) | Different base year is used and the public summary does not fully spell out inclusions and exclusions, which can lead to category mapping differences when comparing totals. |
Taken together, the table shows that most of the gap is explained by broader inclusions in one estimate and a different base year in the other. Our checks on category mapping, implied volume and ASP combinations, and follow-up validation help keep the final value transparent and repeatable for planning discussions.


Key Questions Answered in the Report
What is the current size of the US small home appliances market?
The market is valued at USD 28.44 billion in 2026.
How fast is the US small home appliances market expected to grow?
It is forecast to expand at a 3.72% CAGR, reaching USD 34.14 billion by 2031
Which product segment is growing the fastest?
Air fryers lead growth, registering a 7.35% CAGR through 2031.
Which distribution channel is gaining share most quickly?
Online sales are advancing at a 6.05% CAGR as shoppers adopt e-commerce and DTC ordering.
What region shows the strongest growth outlook?
The West posts the highest regional CAGR at 4.92% through 2031 due to tech-forward and efficiency-focused consumers.
How are tariffs influencing manufacturers?
New steel, Canadian, and Mexican import tariffs raise input costs, prompting supply-chain restructuring and selective price increases that may temper demand growth.
Page last updated on:






