Market Overview
| Study Period | 2020 - 2031 |
|---|---|
| Forecast Data Period | 2026 - 2031 |
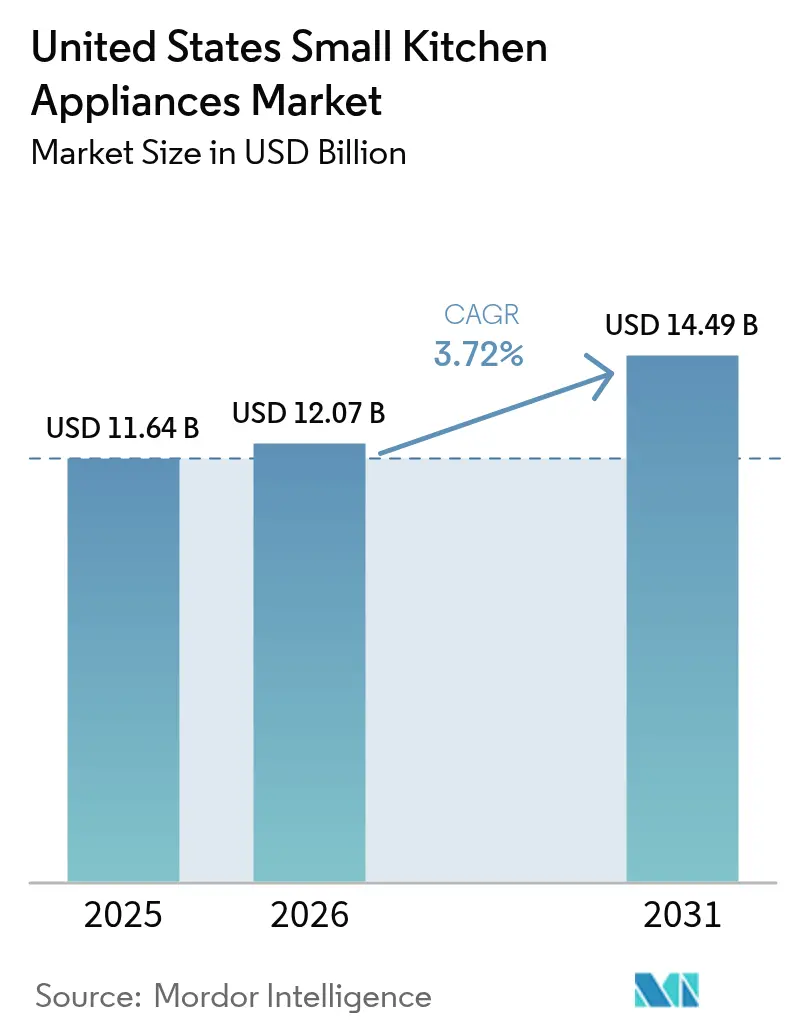
| Base Year Market Size (2025) | USD 11.64 Billion |
| Market Size (2026) | USD 12.07 Billion |
| Market Size (2031) | USD 14.49 Billion |
| Growth Rate (2026 - 2031) | 3.72% CAGR |
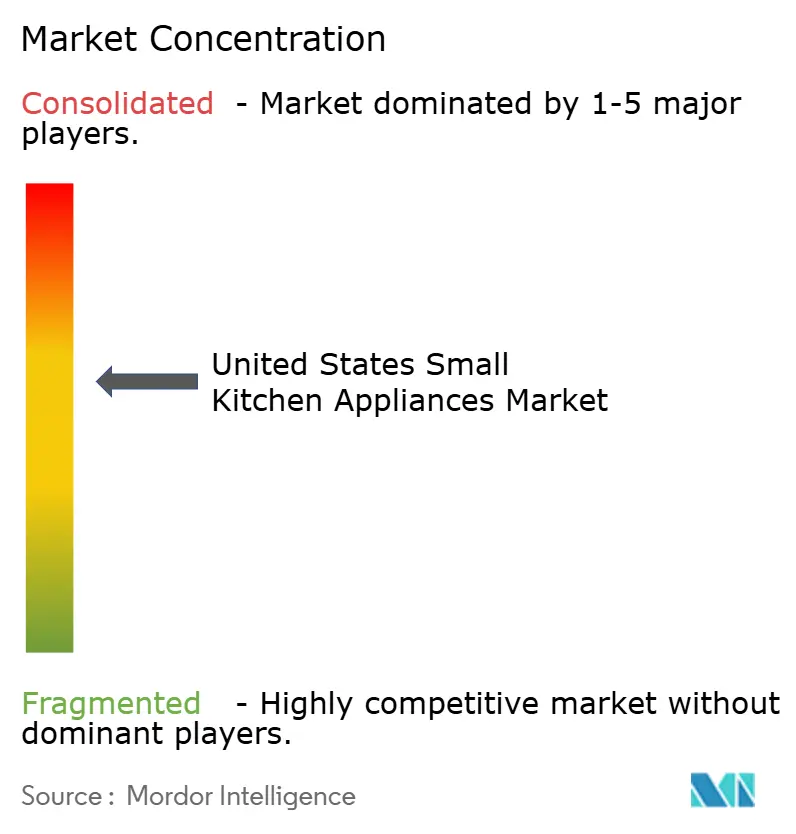
| Market Concentration | Medium |
Major Players *Disclaimer: Major Players sorted in no particular order Image © Mordor Intelligence. Reuse requires attribution under CC BY 4.0. | |
United States Small Kitchen Appliances Market Analysis by Mordor Intelligence
The United States Small Kitchen Appliances Market size was valued at USD 11.64 billion in 2025 and estimated to grow from USD 12.07 billion in 2026 to reach USD 14.49 billion by 2031, at a CAGR of 3.72% during the forecast period (2026-2031).
This forward path rests on rising household formation, persistent interest in at-home meal preparation, and accelerating adoption of smart, multifunctional products. Remote and hybrid work schedules keep more Americans cooking during the day, while premiumization nudges average selling prices upward. Manufacturers are repositioning their supply chains to blunt tariff exposure, and public incentives for energy-efficient models are expanding the eligible customer base. At the same time, right-to-repair legislation lengthens product life, nudging firms to innovate beyond pure replacement demand.
Key Report Takeaways
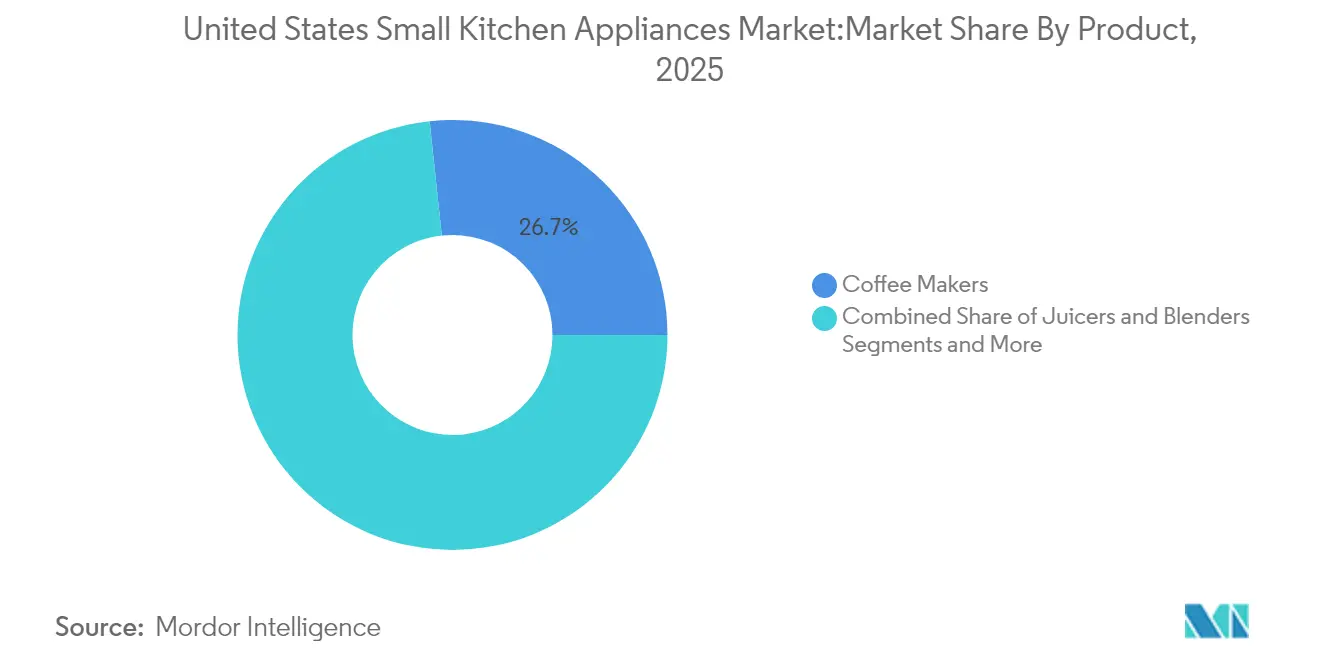
- By product, coffee makers led with 26.70% revenue share of the United States small kitchen appliances market in 2025, whereas air fryers are advancing on a 6.29% CAGR to 2031.
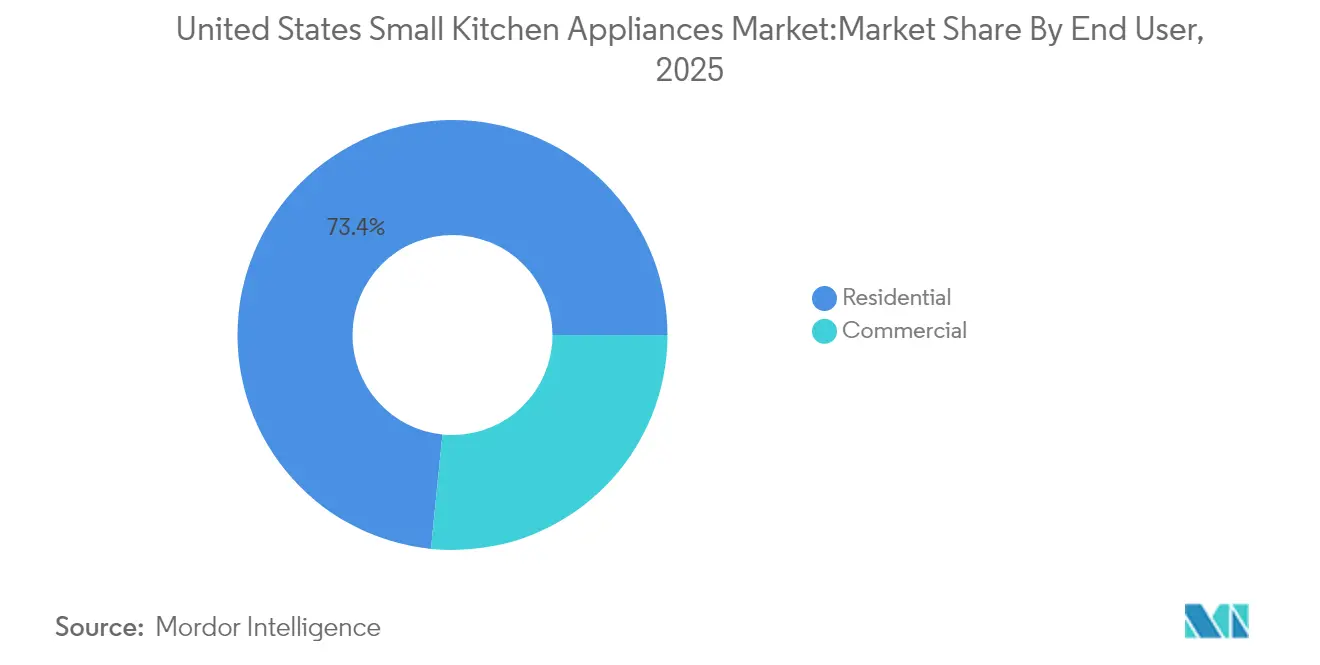
- By end user, residential applications held 73.40% of the United States small kitchen appliances market share in 2025; commercial demand is projected to rise at 5.44% CAGR through 2031.
- By distribution channel, in the US small kitchen appliances market, online retail accounted for 75.80% of B2C sales and is set to expand at 5.73% CAGR to 2031, reshaping go-to-market structures.
- By geography, in the US small kitchen appliances market, the Southeast commanded 34.55% of 2025 revenue, while the West region is growing fastest at 4.16% CAGR through 2031.
Note: Market size and forecast figures in this report are generated using Mordor Intelligence’s proprietary estimation framework, updated with the latest available data and insights as of 2026.
United States Small Kitchen Appliances Market Trends and Insights
Drivers Impact Analysis*
| Driver | (~) % Impact on CAGR Forecast | Geographic Relevance | Impact Timeline |
|---|---|---|---|
| Rising disposable income and urbanization | +0.8% | National, metropolitan clusters | Medium term (2-4 years) |
| Expansion of residential real estate projects | +0.6% | Southeast and West | Long term (≥ 4 years) |
| Convenience-driven time-saving purchasing | +1.2% | Urban centers nationwide | Short term (≤ 2 years) |
| Rapid growth of online retail channels | +0.9% | Nationwide, rural uptake accelerating | Medium term (2-4 years) |
| Specialty beverage culture | +0.7% | West and Northeast urban demographics | Medium term (2-4 years) |
| Federal and state energy-efficiency incentives | +0.5% | Nationwide, state-specific variations | Short term (≤ 2 years) |
| Source: Mordor Intelligence | |||
Rising Disposable Income and Urbanization
Metropolitan population gains and higher real wages support the premium adoption of compact, multifunctional devices. Smaller urban kitchens create a paradoxical lift for countertop units that consolidate tasks, a trend GE Appliances calls “Appliances Anywhere” as appliances migrate into home offices and entertainment areas. Urban buyers pay premiums for connectivity, a dynamic underscored by SharkNinja’s 45% food-prep sales surge in Q1 2025 among large cities [1]Source: Environmental Protection Agency, “Inflation Reduction Act Home Energy Rebates,” epa.gov. The driver remains sensitive to macro cycles, yet continues to pull average selling prices upward when consumer confidence is strong.
Expansion of Residential Real Estate Projects
Housing starts show a strong correlation with first-time appliance installations and comprehensive full-kitchen upgrades across the United States. Builders are increasingly incorporating high-end countertop ovens, beverage systems, and integrated smart appliances into model homes to enhance appeal. Whirlpool’s 2025 KitchenAid showcase, featuring fully customizable finishes and premium design options, exemplifies how these channels drive consumer interest and adoption. The Southeast and Western regions, where single-family construction remains particularly robust, contribute disproportionately to revenue growth and market expansion. While material cost inflation can temporarily slow the pace of new builds, persistent demographic growth and household formation trends support sustained long-term demand for residential kitchen appliances.
Convenience-Driven Time-Saving Purchasing Behavior
Time-constrained households are increasingly favoring appliances equipped with preset programs, intuitive voice control, and rapid-cook functionalities that simplify meal preparation. Panasonic’s HomeCHEF Connect 4-in-1 Multi-Oven, introduced in March 2025, exemplifies this shift by integrating microwave, convection, broil, and air-fry capabilities within a single intelligent unit. The model leverages AI-guided recipe recommendations that adapt to user preferences and cooking history, enhancing both convenience and personalization. As multifunctional appliances gain popularity, they inevitably cannibalize demand for traditional single-purpose SKUs, reshaping category dynamics. However, these advanced units simultaneously raise average ticket values and operating margins, providing brands with a compelling incentive to continue embedding automation and smart features into next-generation kitchen products.
Federal and State Energy-Efficiency Incentive Programs
The Home Electrification and Appliances Rebate Program reimburses up to USD 14,000 on qualifying ENERGY STAR small appliances, expanding affordability for first-cost sensitive shoppers [2]Source: SharkNinja, “Q1 2025 Investor Presentation,” sharkninja.com. Manufacturers actively integrate rebate messaging into marketing campaigns and promotional initiatives, driving higher unit sales for induction countertop cookers and energy-efficient coffee systems. The program’s design encourages households to consider upgrades they might have otherwise delayed due to upfront costs. Overlaps with state-level incentive programs create a multi-layered rebate landscape, further accelerating the replacement of older, less-efficient appliances. Collectively, these initiatives stimulate both short-term sales growth and long-term adoption of energy-efficient home technologies across diverse consumer segments.
Restraints Impact Analysis*
| Restraint | (~) % Impact on CAGR Forecast | Geographic Relevance | Impact Timeline |
|---|---|---|---|
| Volatile raw-material prices increasing unit costs | -0.7% | Global production regions | Short term (≤ 2 years) |
| Fast-shifting consumer style and design preferences | -0.4% | Nationwide, trend-sensitive cohorts | Medium term (2-4 years) |
| E-waste and right-to-repair legislation prolonging lifecycles | -0.3% | Minnesota, New York now; wider rollout expected | Long term (≥ 4 years) |
| Supply-chain localization raising domestic production costs | -0.5% | National reshoring corridors | Medium term (2-4 years) |
| Source: Mordor Intelligence | |||
Volatile Raw-Material Prices Increasing Unit Costs
Global semiconductor shortages continue to disrupt launch calendars for feature-rich appliance models, forcing manufacturers to rely on SKUs built with legacy microcontrollers and slowing the overall pace of innovation. Volatile prices for steel, aluminum, and resin further squeeze profit margins, creating persistent cost pressures across the manufacturing chain. Newell Brands’ Q4 2024 revenue fell 6.1% to USD 1.9 billion despite modest margin gains, reflecting cautious pricing amid cost spikes [3]Source: Newell Brands, “Q4 2024 Earnings Release,” ir.newellbrands.com. Extended retail contracts frequently limit the ability to pass increased costs directly to consumers, constraining pricing flexibility. As a result, manufacturers are compelled to implement internal cost-saving measures and operational efficiencies rather than raising list prices to maintain profitability.
Fast-Shifting Consumer Style & Design Preferences
Rapidly shifting consumer aesthetic preferences generate significant inventory risks and increase development costs, as manufacturers face challenges predicting which designs will succeed in the market. Accelerated color and finish cycles further heighten inventory exposure, forcing firms to hold larger or more diverse stocks to meet evolving demand. KitchenAid’s Juniper and Black Ore collections, unveiled at KBIS 2025, illustrate how brands are responding to a growing desire for personalized and visually distinctive kitchen appliances. Social media platforms amplify the speed and visibility of design trends, shortening fad lifespans and pressuring brands to expand SKU ranges. These dynamics complicate supply chain planning, particularly for value-oriented manufacturers balancing trend responsiveness with cost efficiency.
*Our forecasts treat driver/restraint impacts as directional, not additive. The impact forecasts reflect baseline growth, mix effects, and variable interactions.
Segment Analysis
By Product: Air Fryers Broaden Multi-Category Momentum
Coffee makers retained 26.70% revenue leadership in the United States small kitchen appliances market in 2025, spanning value drip machines to premium super-automatic espresso stations. Air fryers, however, are posting the swiftest 6.29% CAGR to 2031 as calorie-conscious consumers replace deep-fry routines with rapid-convection alternatives. The United States' small kitchen appliances market size for air fryers is driven by repeat-purchase intention among prior adopters. Multifunctional countertop ovens that combine air-fry, bake, and toast modes leverage this enthusiasm and reclaim counter space once devoted to single-purpose units.Secondary categories such as blenders, juicers, and immersion mixers ride health-and-wellness tailwinds fostered by smoothie culture. Bread makers, waffle irons, and egg cookers attract gifting occasions, though their demand curve flattens outside of holiday windows. KitchenAid’s automatic espresso entry and SharkNinja’s forthcoming Ninja Swirl by CREAMi illustrate how incumbents use brand authority to seed fresh niches without cannibalizing core franchises. Coffee segment upgrade cycles now revolve around grinder precision, brew-temperature stability, and Bluetooth-enabled recipe recall, all factors elevating average selling prices.


By End User: Commercial Buyers Spark Performance-Centric Innovation
In the US small kitchen appliances market, residential households generated 73.40% of 2025 revenue, cementing the home kitchen as the principal battlefield for feature differentiation and influencer-led branding. Yet commercial operators, holding a 26.60% share, are expanding at a 5.44% CAGR as restaurants, cafés, and convenience stores seek durability and throughput upgrades. Commercial machines prioritize stainless-steel interiors, cycle-count longevity, and NSF sanitation compliance over color trends. Hamilton Beach Commercial’s programmable blenders and high-capacity coffee urns cater to these needs and feed a technology transfer loop in which residential models inherit professional-grade motors minus the foodservice certification. Home cooks, in turn, pay premiums for “barista-style” extraction or “chef-approved” sear functions, subtly merging the two channels into a performance continuum.
By Distribution Channel: E-Commerce Redefines Consumer Access
B2C options—multi-brand stores, exclusive brand outlets, online retail, and other distribution channels collectively own 75.35% of the 2025 volume. Within that, the United States small kitchen appliances market experiences the sharpest pivot to online storefronts, where units grow on a 5.73% CAGR to 2031. In this space, Amazon, Target, and brand-owned sites lead, allowing granular filtering by wattage, capacity, material, and embedded smarts. Returns logistics and last-mile costs remain watchpoints, yet a higher share of direct-to-consumer margin offsets incremental freight.B2B distributions, at 24.65% share, serve hospitality procurement groups, institutional feeders, and multifamily developers. Here, contract pricing and aftermarket service dictate vendor selection. Manufacturers bundle preventive-maintenance kits to reduce downtime, an offering that resonates as right-to-repair statutes proliferate.
Geography Analysis
The Southeast retained a 34.55% revenue lead in 2025, benefiting from robust household formation, cultural affinity for scratch cooking, and builder incentives that include appliance upgrades in new developments. Warm-weather entertaining habits mean brisk sales of countertop grills and beverage centers. The United States small kitchen appliances market size tied to the Southeast is set to cross USD 5.01 billion by 2031, even as growth moderates to the national average after 2027.In the US small kitchen appliances market, the West region, encompassing California, Washington, Oregon, and Colorado, is the fastest riser on a 4.16% CAGR. High disposable incomes, tech-savvy buyers, and stringent energy codes accelerate adoption of smart, ENERGY STAR certified models. Silicon Valley professionals favor Wi-Fi-enabled espresso makers that integrate with digital assistants. Manufacturers often pilot app-based firmware upgrades in this geography before nationwide rollouts, using the data-rich feedback loop to refine feature sets.In the US small kitchen appliances market, the Midwest’s appliance appetite remains steady, anchored in family-size cooking routines and agrarian prosperity that supports meat-processing accessories like dehydrators and vacuum sealers. Harsh winters elevate demand for bread makers and slow cookers, cushioning seasonal lulls elsewhere. The Northeast shows saturation characteristics: replacement purchases dominate and style refreshes—especially color finishes—lure consumers whose existing devices still function. Meanwhile, the Southwest climbs as migration flows into Arizona, Nevada, and Texas bring younger demographics that opt for compact air-fry ranges and cold-brew systems suitable for hot climates.
Competitive Landscape
The US small kitchen appliances industry structure is moderately concentrated: the top five brands hold significant sales, leaving meaningful white space for challenger entrants. SharkNinja grew net sales 30% in 2024 to USD 5.53 billion by satisfying convenience-centric niches faster than incumbents. GE Appliances amplified AI functions, rolling out Flavorly to personalize brewing parameters in smart coffee systems. Panasonic leveraged a partnership with Fresco to add adaptive cook algorithms, improving recipe outcomes and fortifying its ecosystem.
Supply chain agility is the current differentiator. Miele’s USD 150 million Alabama plant, launching in 2025, marks an early reshoring milestone aimed at trimming tariff risks and compressing delivery lead times. Electrolux’s Frigidaire-branded launch of three new countertop units in September 2024 underscores repeat investment in US-specific form factors.
A separate arena involves sustainability commitments. Brands publicize recycled-plastic chassis, modular component assemblies, and subscription filters shipped in recyclable cartons. Right-to-repair mandates elevate the importance of parts distribution networks; early compliance may yield goodwill as regulations spread beyond Minnesota and New York. Pricing discipline, margin protection, and design velocity define the next competitive phase.
United States Small Kitchen Appliances Industry Leaders
Whirlpool Corporation (KitchenAid)
Spectrum Brands (Black & Decker)
Hamilton Beach Brands
SharkNinja Operating LLC
Breville Group
- *Disclaimer: Major Players sorted in no particular order

Recent Industry Developments
- March 2025: Panasonic launched the HomeCHEF Connect 4-in-1 Countertop Multi-Oven at USD 529.99, integrating microwave, air-fry, convection bake, and broil modes plus AI cookware recognition.
- February 2025: Newell Brands reported Q4 2024 net sales of USD 1.9 billion, down 6.1% year over year, and issued a 2025 outlook of 2-4% further decline.
- February 2025: KitchenAid introduced Juniper and Black Ore finishes with customizable hardware across multiple appliance lines at KBIS 2025.
- February 2025: SharkNinja announced Q4 2024 net sales of USD 1.79 billion, up 29.7%, and upgraded fiscal 2025 growth guidance to 10-12%.


Research Methodology Framework and Report Scope
Market Definitions and Key Coverage
Our study defines the US small kitchen appliances market as powered, countertop-sized devices (coffee makers, blenders, air fryers, grills, food processors, and similar products) that assist daily food and beverage preparation in homes and light-commercial settings. According to Mordor Intelligence, revenues are reported at the manufacturer level and cover both retail sell-in and direct institutional shipments.
Scope exclusion: Large freestanding appliances, manual gadgets, and spare parts lie outside the study.
Segmentation Overview
- By Product
- Food Processors
- Juicers and Blenders
- Grills and Roasters
- Air Fryers
- Coffee Makers
- Electric Cookers
- Toasters
- Electric Kettles
- Countertop Ovens
- Other Small Kitchen Appliances (bread makers, waffle makers, egg cookers, etc.)
- By End User
- Residential
- Commercial
- By Distribution Channel
- B2C / Retail
- Multi-brand Stores
- Exclusive Brand Outlets
- Online Retail
- Other Distribution Channels
- B2B (directly from the manufacturers)
- B2C / Retail
- By Geography
- Northeast
- Southeast
- Midwest
- Southwest
- West
Detailed Research Methodology and Data Validation
Primary Research
Mordor analysts spoke with appliance producers, logistics partners, national retailers, and pure-play e-commerce operators across the Midwest, South, and coastal regions. These conversations validated replacement cycles, average selling prices, and upcoming model launches that desk research alone could not fully reveal.
Desk Research
We began with publicly available US data sets such as the Monthly Retail Trade Survey, Bureau of Economic Analysis personal-consumption tables, and International Trade Commission import flows to anchor historic demand. Category context was sharpened with Association of Home Appliance Manufacturers shipment reports, National Retail Federation holiday trackers, and Consumer Product Safety Commission recall notices that signal product turnover. Company filings, investor decks, and news archives in Dow Jones Factiva, together with financial snapshots from D&B Hoovers, helped us understand pricing, channel mix, and strategic moves. The sources named illustrate our approach; many additional records were reviewed to confirm trends and values.
Market-Sizing & Forecasting
We rebuilt the baseline through a top-down consumption pool that blends household count, usable kitchen space, and spend per appliance, then cross-checked the total with sampled average selling price multiplied by unit shipments drawn from import manifests and retailer sell-through records. Bottom-up supplier roll-ups flagged deviations that were reconciled. Key variables such as online channel share, air-fryer penetration, single-person households, and discretionary income feed a multivariate regression that forecasts future values. Where data gaps appeared, region-peer averages and historical elasticity patterns were applied.
Data Validation & Update Cycle
Every model passes two rounds of variance checks, currency harmonization, and peer review before release. Reports are refreshed once a year, with interim revisions triggered by tariff changes, major safety recalls, or breakthrough product launches.
Why Our United States Small Kitchen Appliances Baseline Commands Reliability
Published estimates often diverge because firms select different product baskets, data years, and validation rigor. Some count only retail sell-through, while others exclude emerging smart formats or institutional demand.
Key gap drivers include omission of B2B channels, narrower product scopes, older baselines, and slower refresh cadences.
Benchmark comparison
| Market Size | Anonymized source | Primary gap driver |
|---|---|---|
| USD 11.64 B (2025) | Mordor Intelligence | - |
| USD 5.54 B (2025) | Regional Consultancy A | excludes direct-to-office sales, relies on household survey only |
| USD 4.98 B (2024) | Trade Journal B | omits online-only brands, uses 2022 exchange rates |
The comparison shows that Mordor Intelligence, by pairing transparent scope choices with dual-source validation and timely updates, delivers a balanced baseline decision-makers can trust.


Key Questions Answered in the Report
What is the current value of the United States small kitchen appliances market?
The market stands at USD 12.07 billion in 2026 and is tracking toward USD 14.49 billion by 2031.
Which product segment is expanding fastest?
Air fryers are growing at a 6.29% CAGR through 2031 due to healthier cooking preferences and multifunctional design adoption.
How large is the commercial opportunity in small kitchen appliances?
Commercial users account for 26.60% of 2025 revenue and are projected to capture significant share by 2031 as foodservice operators upgrade to durable, high-throughput units.
What role does e-commerce play in appliance sales?
Online channels hold 75.80% of B2C transactions and are scaling at 5.73% CAGR, making them the primary discovery and purchase route for many consumers.
How are tariffs and reshoring influencing manufacturers?
Tariff uncertainty has accelerated domestic production commitments such as Miele’s Alabama plant, while localized sourcing helps mitigate import cost swings and improve delivery reliability.
What impact will right-to-repair laws have on appliance demand?
Mandatory access to parts and repair guides in states like Minnesota will lengthen product lifespans, moderating replacement cycles and pushing brands to innovate on value-added features rather than planned obsolescence.
Page last updated on:


