
Home and Property Improvement
9th JuneA Leading Sanitaryware Company’s Journey in Saudi Arabia
4 Min Read
The Smart Small Home Appliances Market is Segmented by Product (Smart Vacuum Cleaners, Smart Air-Treatment Devices, Smart Beverage Appliances, Smart Kitchen Prep Appliances, and More), Distribution Channel (Multi-Branded Stores, Exclusive Brand Outlets, Online, and More), and Geography (North America, South America, Europe, Asia-Pacific, and the Middle East and Africa). The Market Forecasts are Provided in Terms of Value (USD).
Market Overview
| Study Period | 2020 - 2031 |
|---|---|
| Market Size (2026) | USD 44.43 Billion |
| Market Size (2031) | USD 78.99 Billion |
| Growth Rate (2026 - 2031) | 12.18 % CAGR |
| Fastest Growing Market | Asia Pacific |
| Largest Market | Asia Pacific |
| Market Concentration | Medium |
Major Players *Disclaimer: Major Players sorted in no particular order. Image © Mordor Intelligence. Reuse requires attribution under CC BY 4.0. |
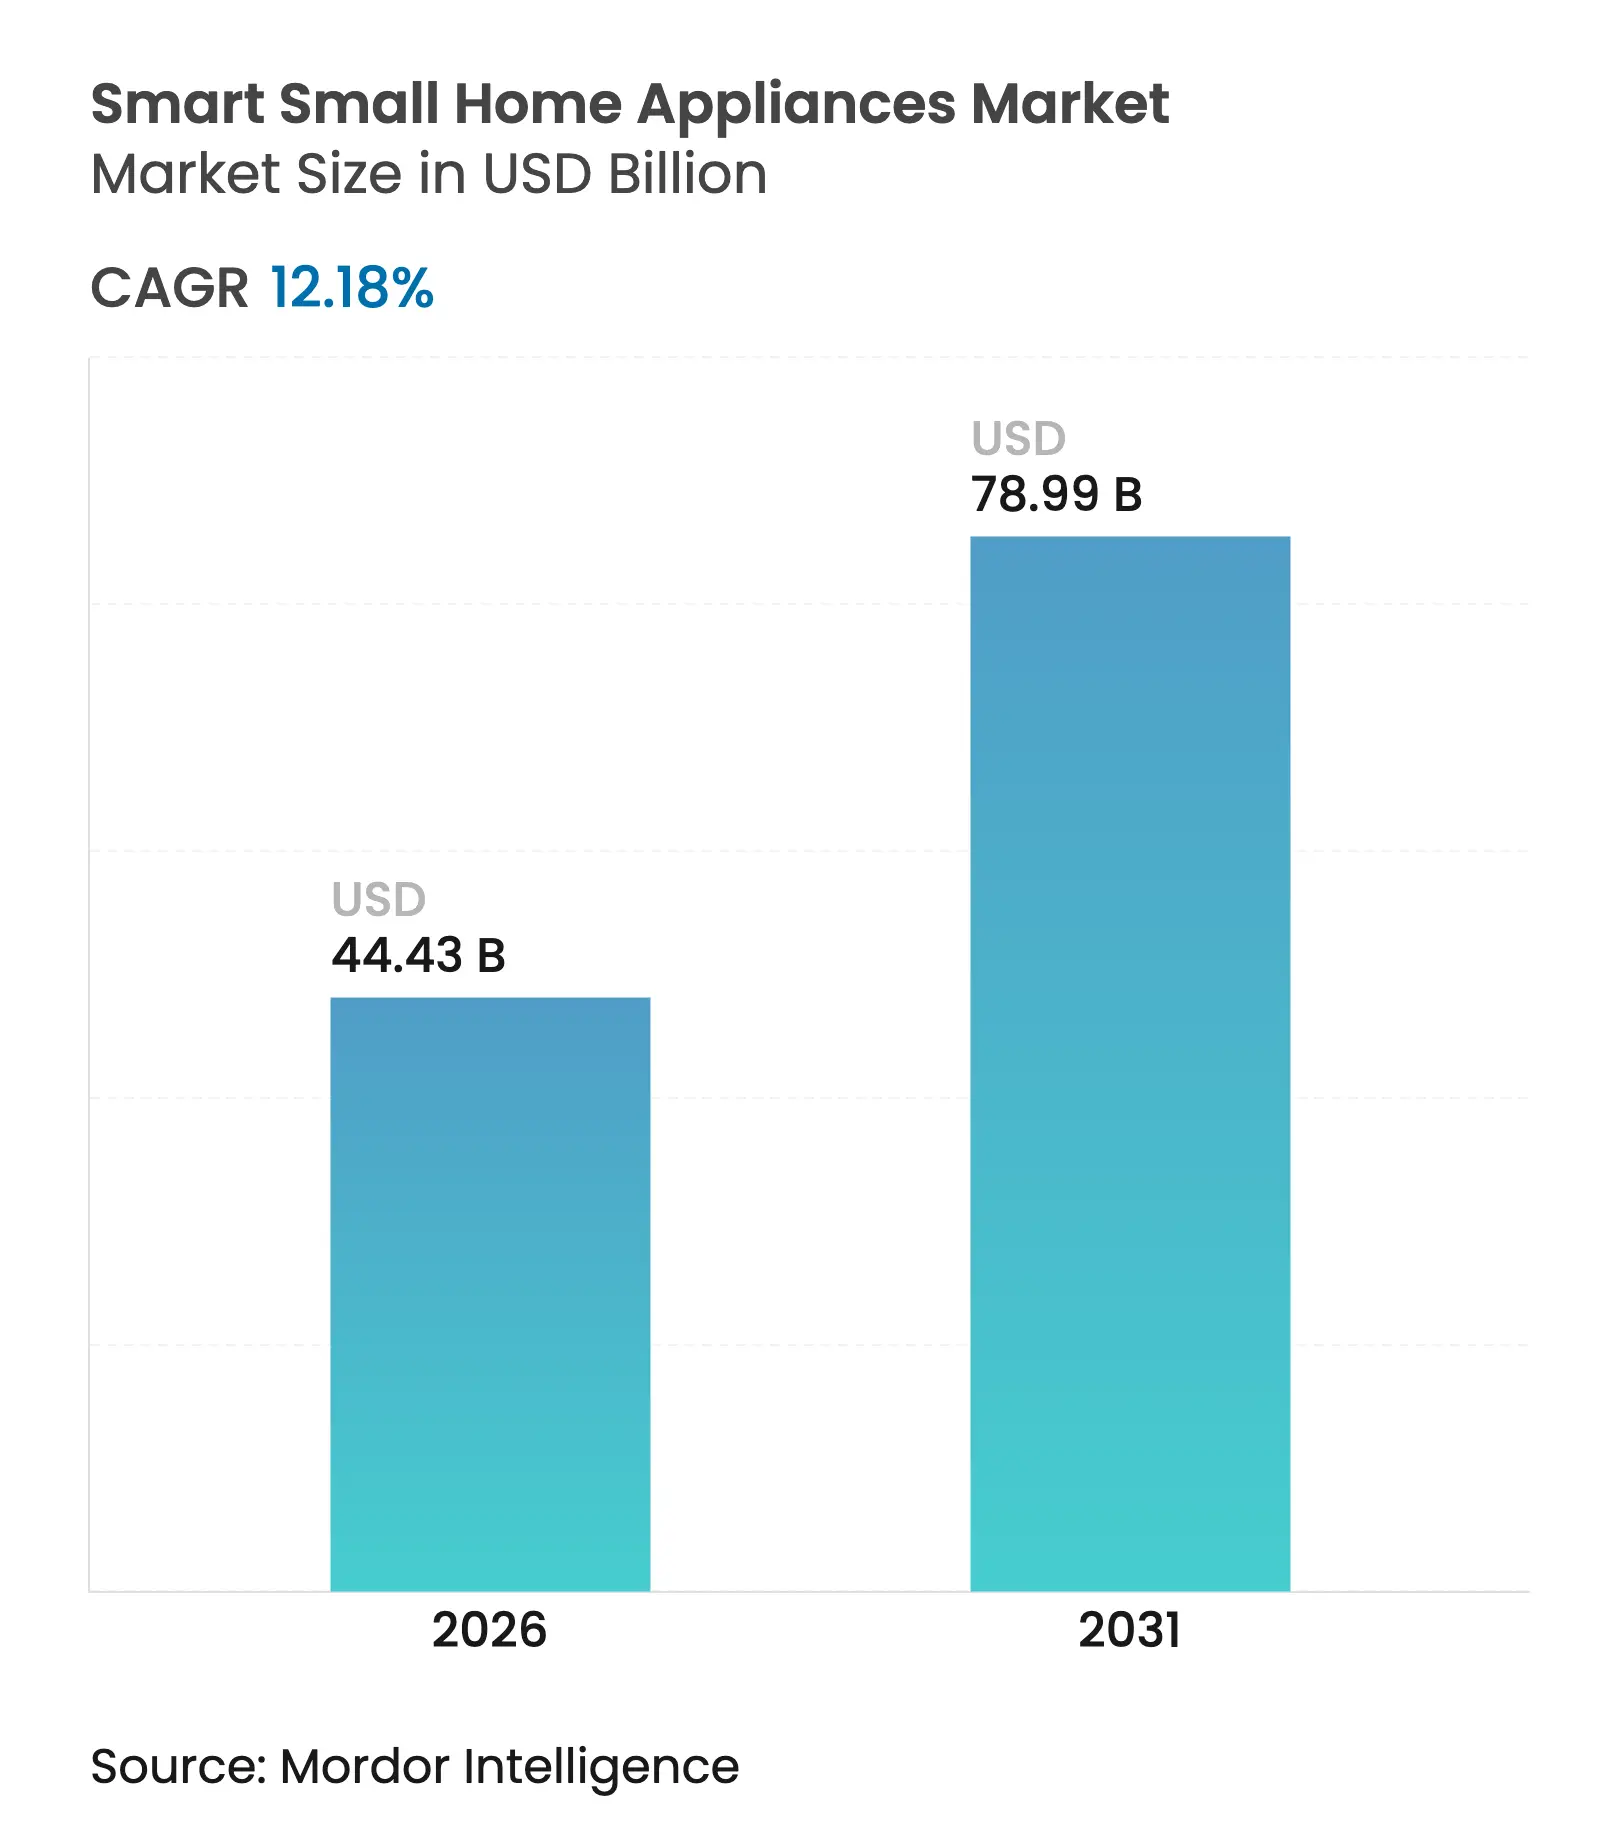
The smart small home appliances market size in 2026 is estimated at USD 44.43 billion, growing from 2025 value of USD 39.60 billion with 2031 projections showing USD 78.99 billion, growing at 12.18% CAGR over 2026-2031. Strong momentum originates from the convergence of Internet-of-Things (IoT) adoption, stricter energy-efficiency mandates, and lifestyle shifts toward convenience. Dual-income households purchase connected devices that save time, while governments in North America, Europe, and Asia-Pacific mandate power-consumption limits that favor intelligent models over conventional alternatives. Competitive intensity rises as Chinese brands dominate robotics, North American and European firms pivot toward artificial-intelligence (AI) features, and online channels enable direct-to-consumer pricing. Geographically, Asia-Pacific holds 38% of 2024 revenue on the back of rapid urbanization and disposable-income gains, and it shapes global pricing through its manufacturing base. Cybersecurity concerns and trade-policy shocks add cost and credibility risks, yet the larger trend toward fully connected homes keeps the demand outlook resilient.
Key Report Takeaways
Note: Market size and forecast figures in this report are generated using Mordor Intelligence's proprietary estimation framework, updated with the latest available data and insights as of 2026.
Drivers Impact Analysis
| Driver | (~) % Impact on CAGR Forecast | Geographic Relevance | Impact Timeline | |||
|---|---|---|---|---|---|---|
IoT-enabled smart-home ecosystems
IoT-enabled smart-home ecosystems
| +2.8% | Global, Asia-Pacific lead | Medium term (2–4 years) |
(~) % Impact on CAGR Forecast
:
+2.8%
|
Geographic Relevance
:
Global, Asia-Pacific lead
|
Impact Timeline
:
Medium term (2–4 years)
|
Energy-efficiency & sustainability
mandates
Energy-efficiency & sustainability
mandates
| +2.1% | North America, EU, Asia-Pacific | Long term (≥ 4 years) | |||
Growth in dual-income households
Growth in dual-income households
| +1.9% | Global urban centers | Short term (≤ 2 years) | |||
Generative-AI for maintenance &
auto-replenishment
Generative-AI for maintenance &
auto-replenishment
| +1.7% | North America, EU, Asia-Pacific | Medium term (2–4 years) | |||
Subscription-as-a-service models
Subscription-as-a-service models
| +1.4% | Europe lead, Asia-Pacific rising | Medium term (2–4 years) | |||
Localized voice-assistant support
Localized voice-assistant support
| +1.2% | Asia-Pacific emerging markets, Latin America | Short term (≤ 2 yrs) | |||
| Source: Mordor Intelligence | ||||||
Rising Adoption of IoT-Enabled Smart-Home Ecosystems
Global households link multiple appliances to central assistants as IoT device counts soar. Amazon reported a 200% jump in Alexa-connected devices in India over three years. The February 2025 debut of Alexa+, a USD 19.99 monthly service with generative-AI capabilities, illustrates how recurring-revenue models deepen user lock-in. The Matter 1.4 standard, released in November 2024, eases interoperability worries by letting rival brands communicate seamlessly. Samsung leverages SmartThings rather than building a proprietary protocol, thereby speeding ecosystem uptake.
Consumer Preference for Energy-Efficient Appliances & Sustainability Mandates
Regulators accelerate demand for connected devices that optimize power consumption. The EU’s Regulation 2023/826, effective May 2025, caps standby draw at 0.5 watts and will save an estimated 32.5 TWh yearly by 2030. The US Department of Energy finalized cooking-product efficiency rules in January 2024, targeting a 30% usage cut by 2028[1]U.S. Department of Energy, “Energy Conservation Program: Cooking Products,” energy.gov. In April 2025, the United Kingdom introduced standards that let consumers shift usage to off-peak tariffs and save up to GBP 332 per year when paired with smart-charging functions[2]U.K. Department for Energy Security & Net Zero, “Smart Appliance Standards 2025,” gov.uk.
Growth in Dual-Income Households Driving Convenience Purchases
Rising two-earner families rely on automation to reclaim personal time. According to the National Association of Home Builders, homeowners prefer multifunctional appliances[3]National Association of Home Builders, “Multifunction Appliance Preferences,” nahb.org. Samsung’s AI Subscription Club, launched in February 2025, converts large upfront purchases into a monthly payment plan; within weeks, the model contributed nearly 30% of domestic appliance revenue. GE Appliances expanded its SmartHQ platform with AI recipe and laundry-care features that reduce cognitive load for busy users.
Integration of Generative AI for Predictive Maintenance & Auto-Replenishment
Connected devices evolve from reactive control points to proactive assistants. Samsung’s multi-year partnership with Instacart allows Vision AI fridges to detect 37 food items and propose orders directly from the door screen. Panasonic’s Anthropic-backed “Umi” aims for 30% of group revenue from AI-enabled products by 2035, starting with a 2025 wellness appliance. Qualcomm’s QCS8550 processor brings on-device large-language-model inference, lowering latency while keeping data private.
Restraints Impact Analysis
| Restraint | (~) % Impact on CAGR Forecast | Geographic Relevance | Impact Timeline | |||
|---|---|---|---|---|---|---|
High upfront cost & perceived
short replacement cycles
High upfront cost & perceived
short replacement cycles
| −1.8% | Global, especially price-sensitive markets | Short term (≤ 2 years) |
(~) % Impact on CAGR Forecast
:
−1.8%
|
Geographic Relevance
:
Global, especially price-sensitive
markets
|
Impact Timeline
:
Short term (≤ 2 years)
|
Cybersecurity & data-privacy
concerns
Cybersecurity & data-privacy
concerns
| −1.3% | EU & North America | Medium term (2–4 years) | |||
Trade tariffs on motors, LiDAR, other
components
Trade tariffs on motors, LiDAR, other
components
| −1.1% | US-China trade corridors | Short term (≤ 2 years) | |||
Fragmented interoperability standards
causing app fatigue
Fragmented interoperability standards
causing app fatigue
| −0.9% | Global | Medium term (2–4 years) | |||
| Source: Mordor Intelligence | ||||||
High Upfront Cost & Perceived Short Replacement Cycles
Consumer price sensitivity intensifies as tariffs drive appliance costs higher. For instance, the U.S. Department of Commerce’s Bureau of Industry and Security (BIS) Section 232 tariffs of 50% on steel-based home appliances took effect in June 2025 and lifted production costs on refrigerators, dishwashers, and ranges. Whirlpool’s Q1 2025 revenue fell 19.4% to USD 3.62 billion as price increases suppressed unit sales despite margin gains. Renters avoid high-ticket purchases due to mobility concerns, slowing premium adoption. European vendors soften pricing through promotions to protect volumes, illustrating the delicate balance between feature expansion and affordability.
Cybersecurity & Data-Privacy Concerns
Consumer advocacy groups flagged smart air fryers that request audio-recording permissions and transmit data overseas, eroding consumer trust. For example, certain smart air fryers ask to record audio and send that information abroad, prompting many shoppers to question whether these products can be trusted and, in turn, slowing adoption. The United Kingdom’s Information Commissioner plans updated 2025 guidance to tighten compliance expectations, while the US FCC’s voluntary “Cyber Trust Mark” label remains delayed and sparsely adopted. Brands that fail to invest in transparent data-handling and device-level security face reputational damage and slowed sales in privacy-sensitive regions.
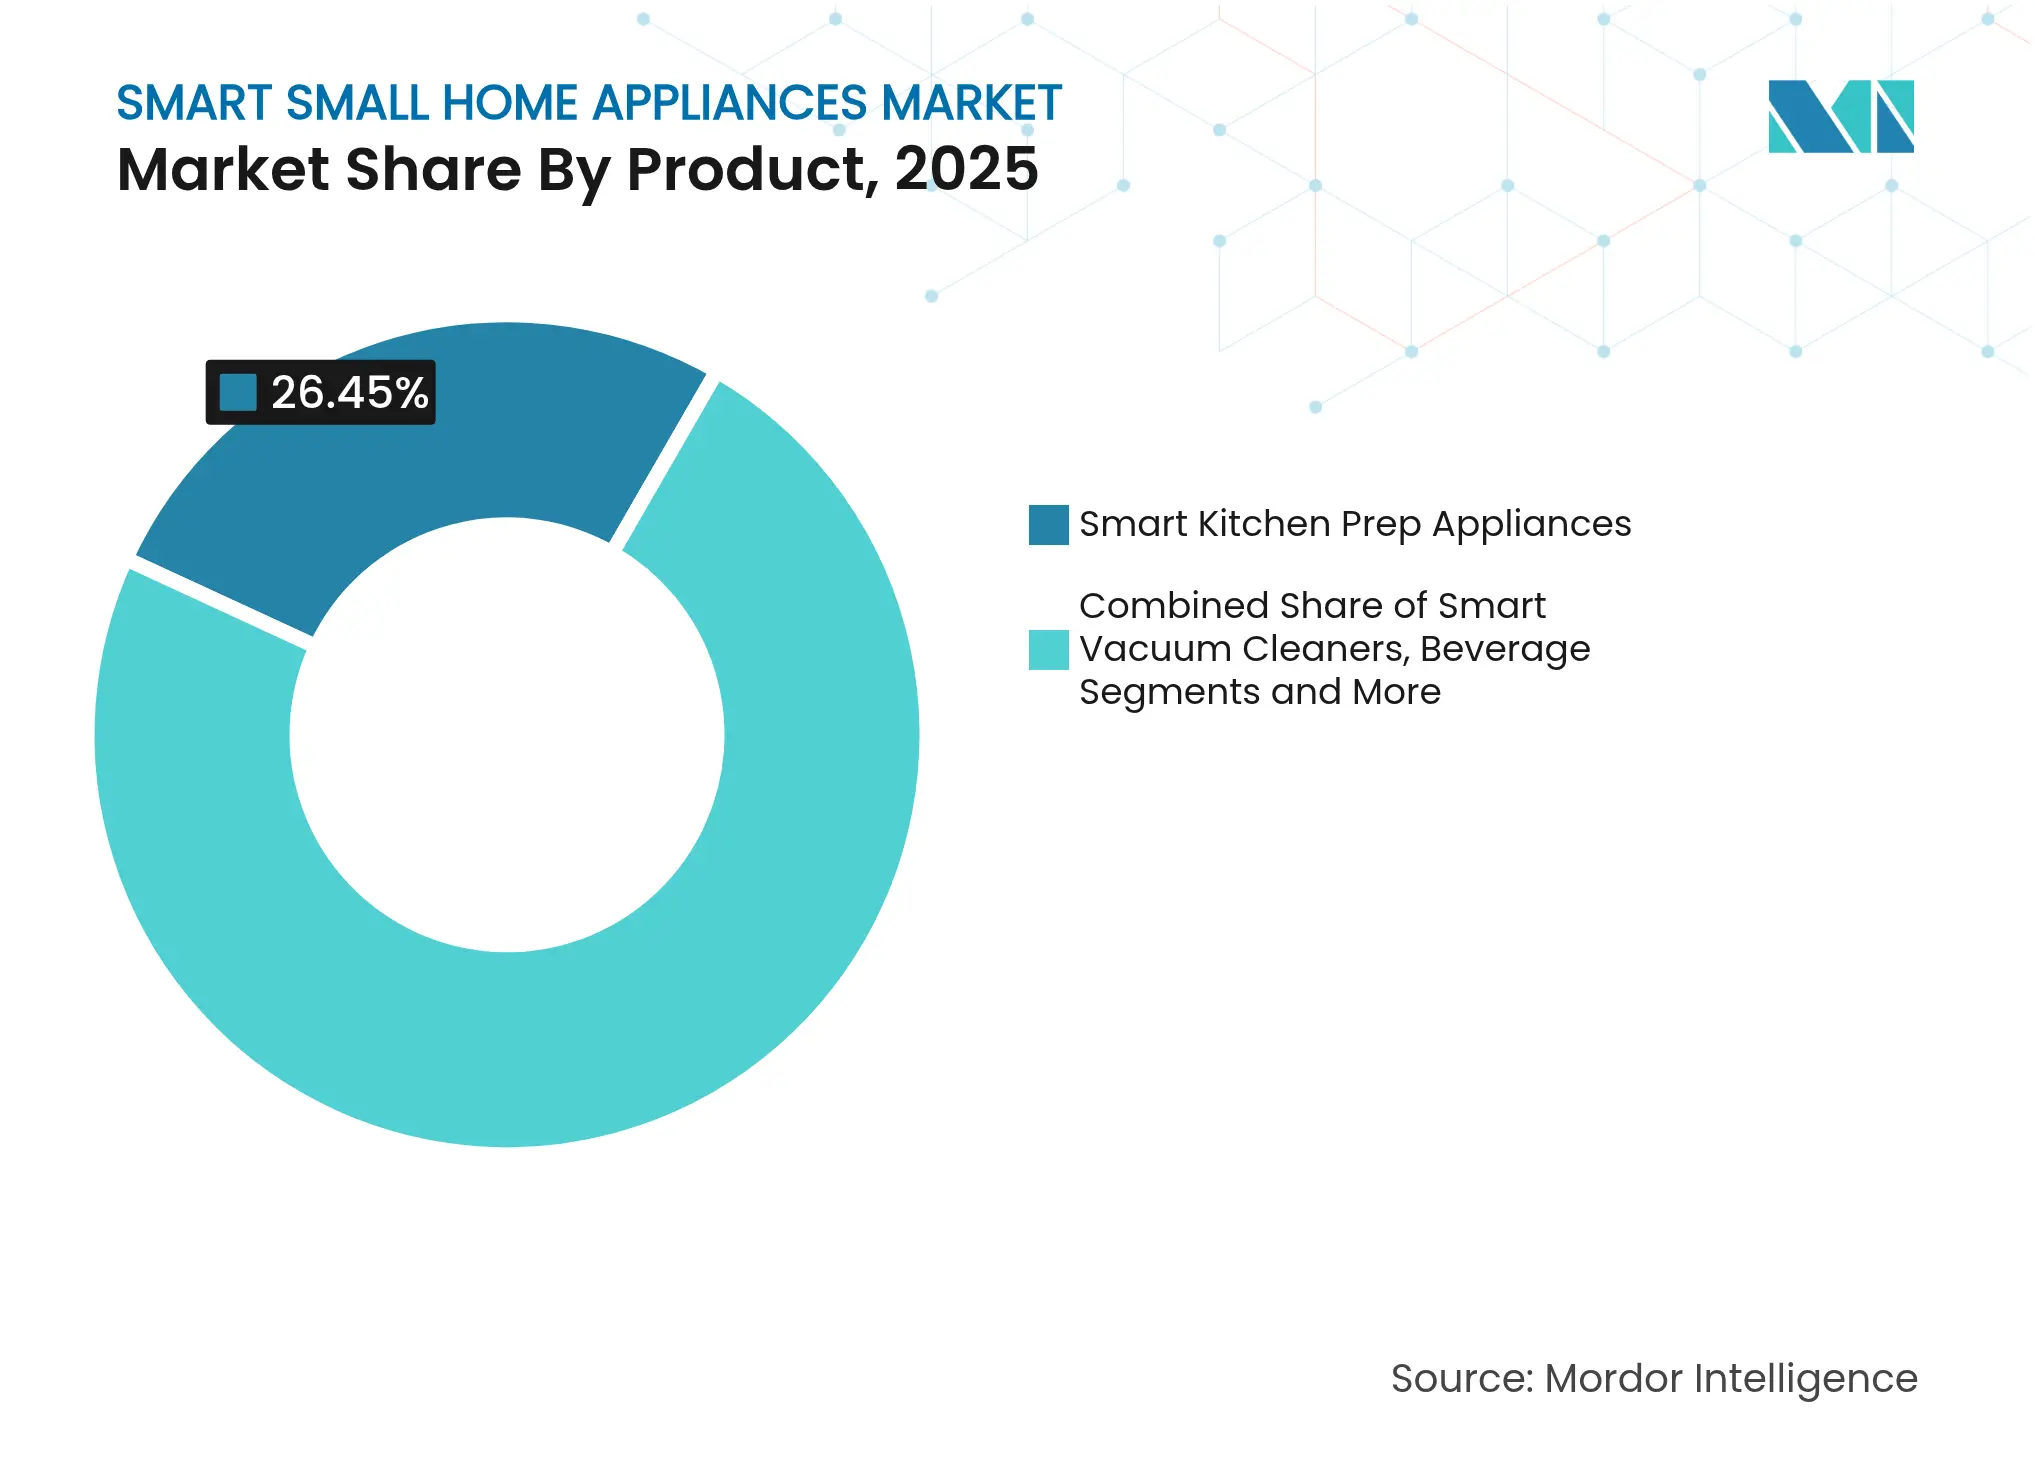
By Product: Kitchen Appliances Anchor Early Adoption
Kitchen prep appliances captured 26.45% of 2025 revenue, making them the largest slice of the smart small home appliances market. Consumers' first experience connected-device benefits in cooking, where recipe integration and guided modes deliver tangible daily value. Robotics is the breakout star: smart vacuum cleaners log a 15.76% CAGR to 2031. As Chinese firms Ecovacs and Roborock refine AI navigation, helping Chinese companies secure a significant share of the global robotic-vacuum smart small home appliances market share in 2025. Smart air-treatment equipment rises on post-pandemic health awareness, while beverage-automation devices find niches among coffee enthusiasts seeking one-touch brewing. Frigidaire’s March 2025 entry into air purifiers shows mainstream manufacturers chasing indoor-air quality demand. Manufacturers also experiment in emerging categories—such as countertop fermenters or compact washers—to command premium price points through connectivity differentiation. The innovation pace within the product mix underscores how the smart small home appliances market size will tilt incrementally toward categories that provide quantifiable time savings.
Note: Segment shares of all individual segments available upon report purchase
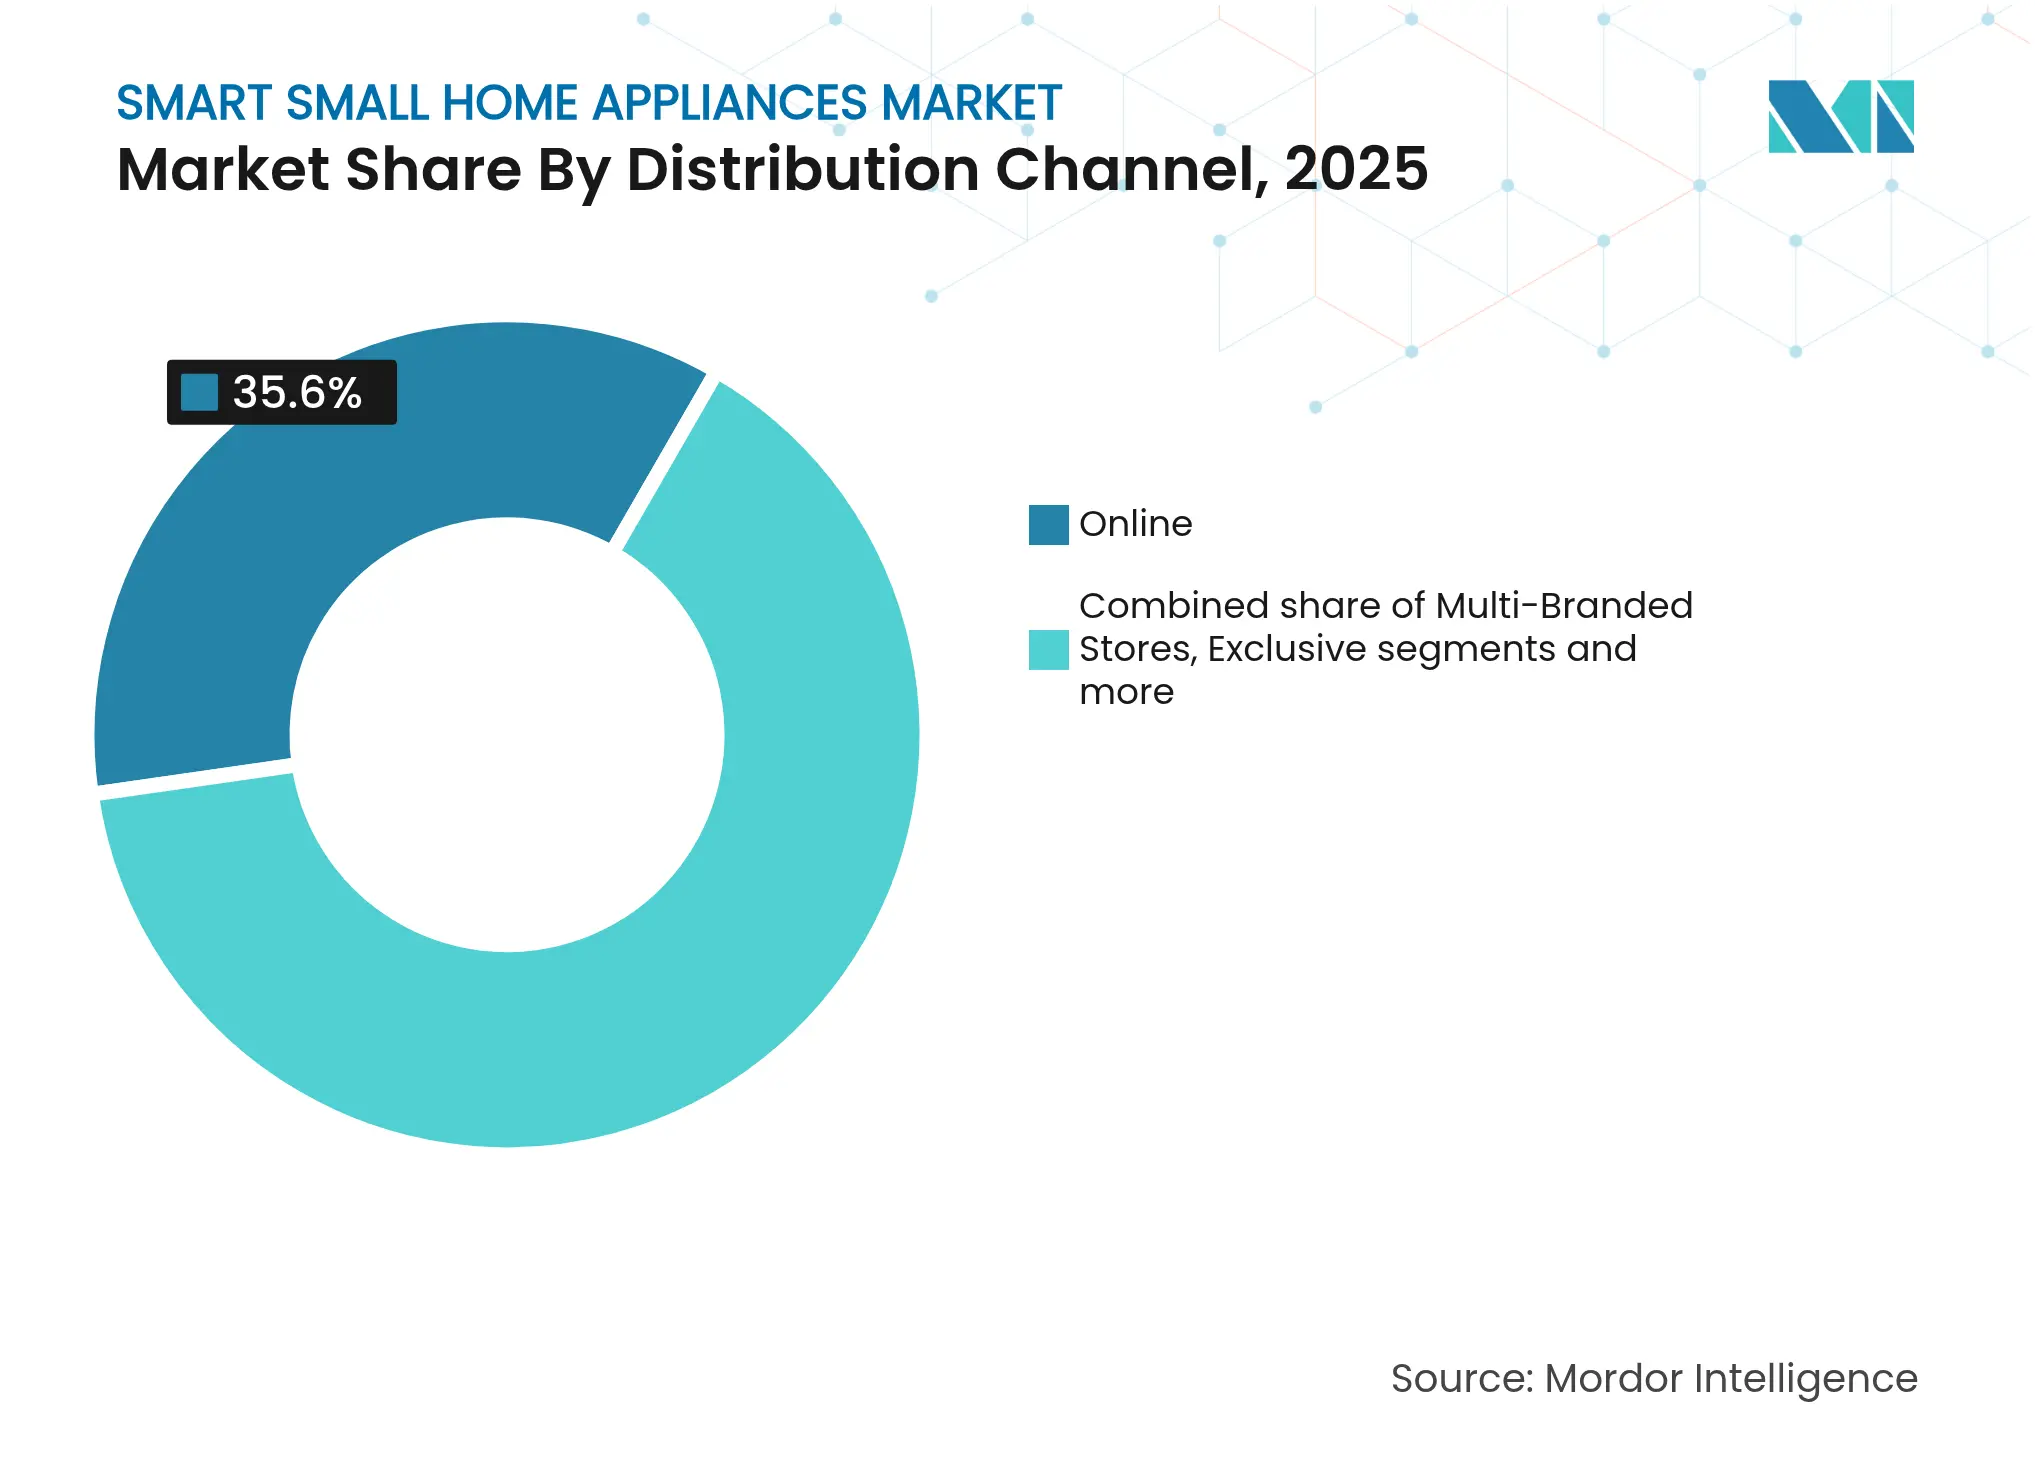
By Distribution Channel: E-Commerce Powers Margin Expansion
Online platforms controlled 35.60% of 2025 revenue and are expected to post an 18.2% CAGR through 2031, the fastest among all routes. Direct shipping lets brands capture higher margins, offer configuration options, and deliver software updates seamlessly. Research from the Home Improvement Research Institute found that small appliances represent 45% of online home-improvement purchases.
Traditional dealers still matter for high-touch demonstrations, yet they face margin compression. Exclusive brand showrooms focus on experiential merchandising that articulates AI benefits. SharkNinja achieved 29.7% Q4 2024 sales growth largely via direct-to-consumer channels, validating web-centric strategies. Specialty chains counter by bundling installation and service guarantees that pure-play e-commerce cannot easily match. The channel mix evolution signals that the smart small home appliances market will hinge increasingly on digital engagement and data-rich post-purchase relationships.
Note: Segment shares of all individual segments available upon report purchase
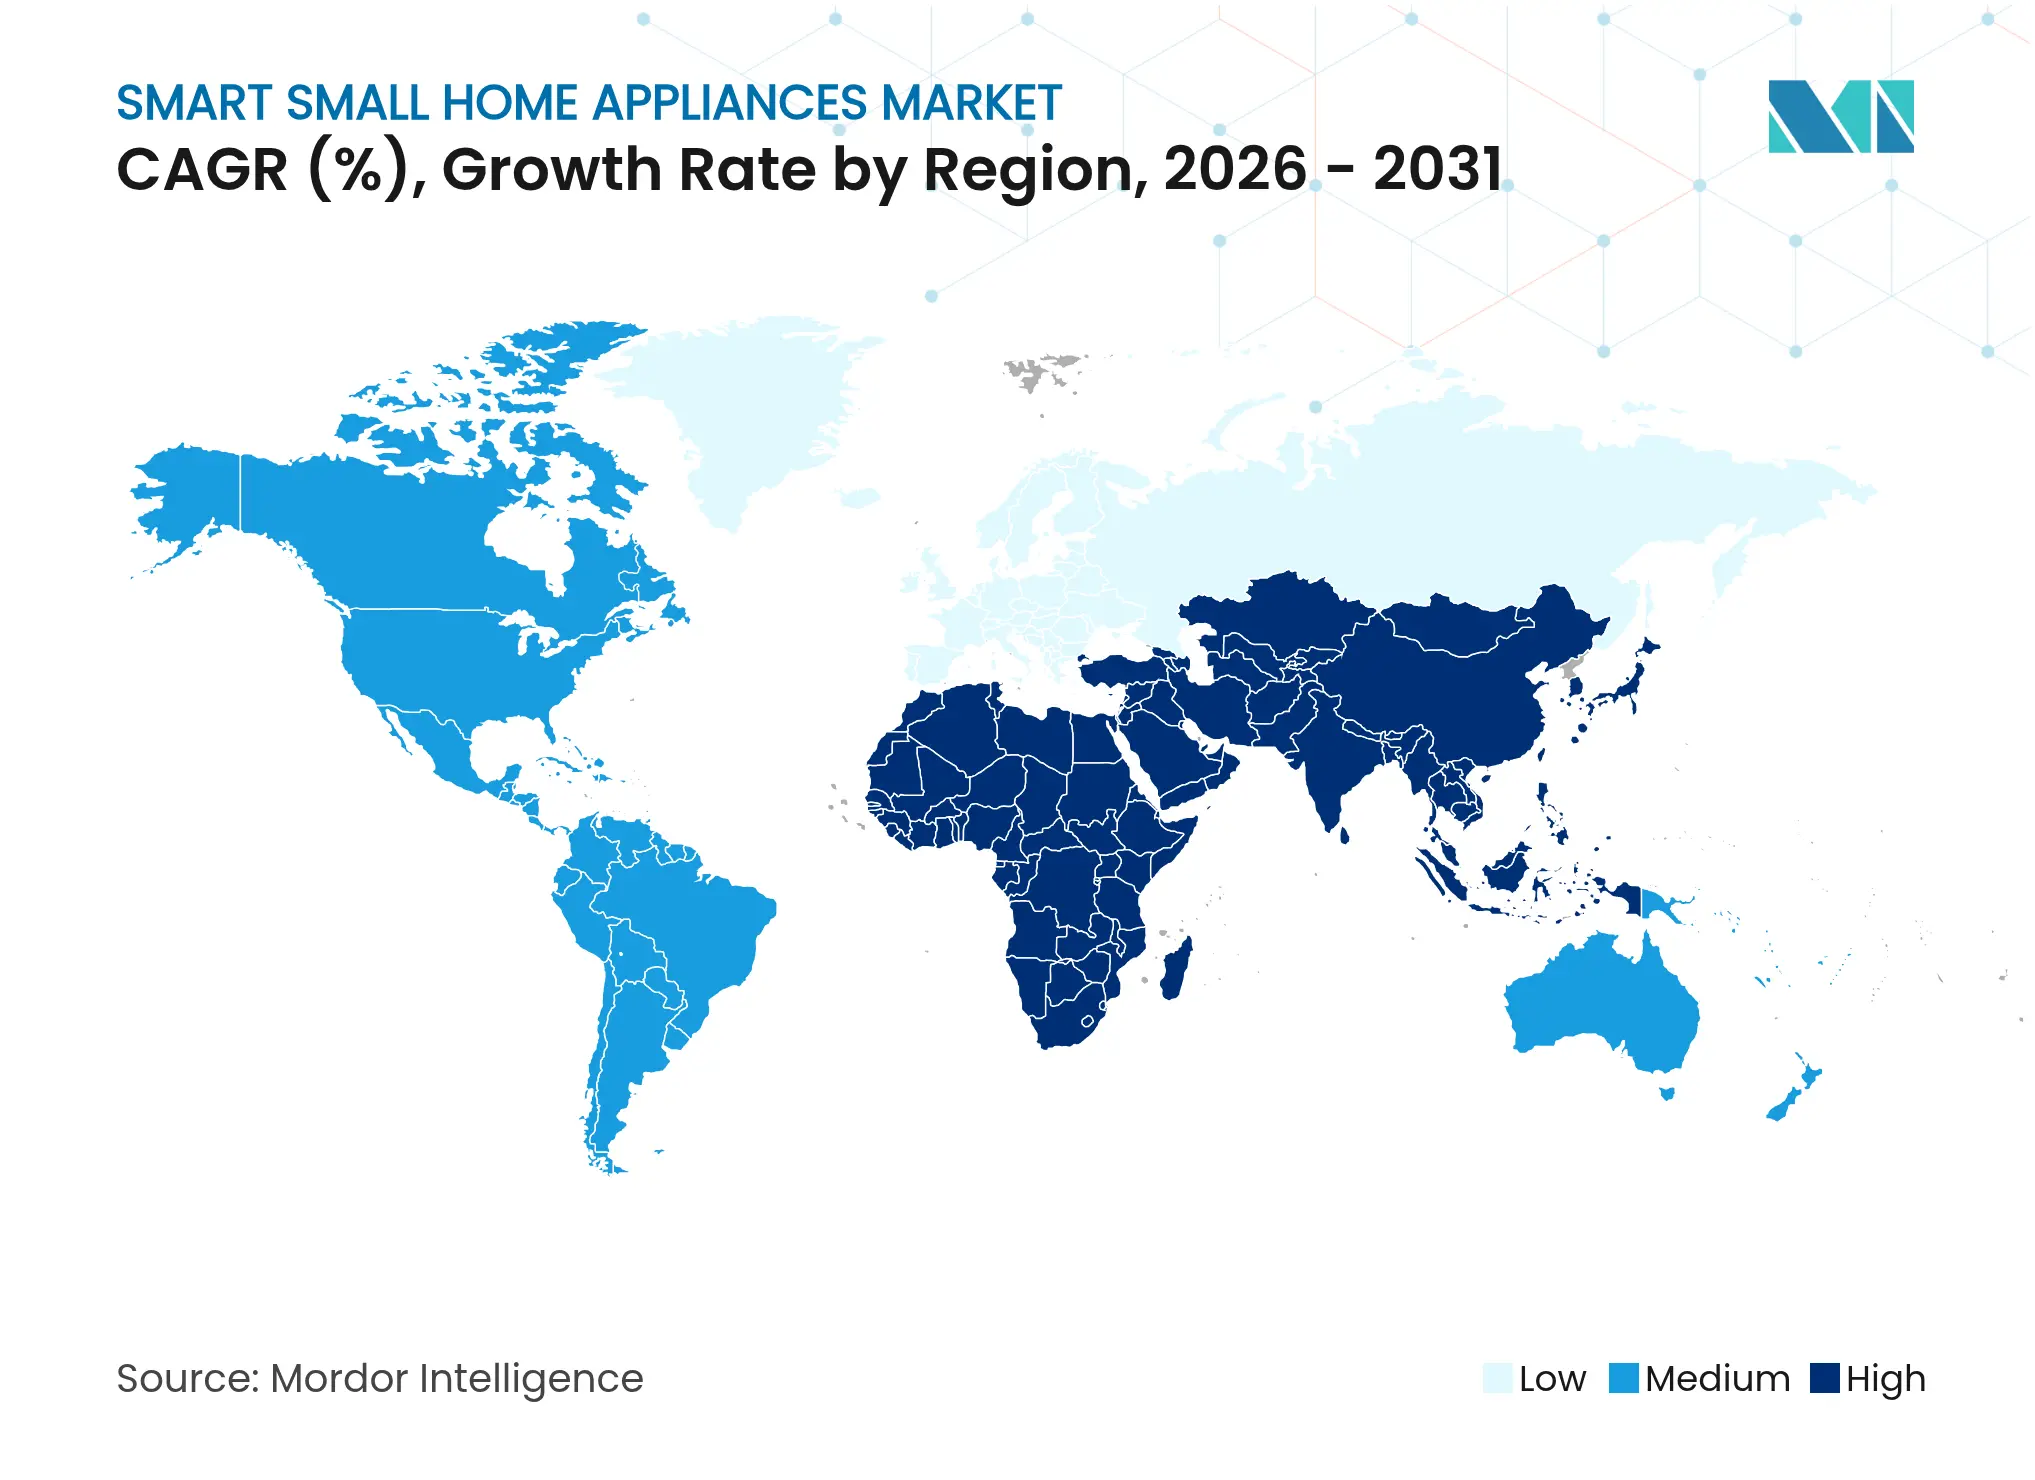
Asia-Pacific owns 37.55% of 2025 global revenue and is projected to climb at a 15.05% CAGR to 2031, making it both the largest and fastest-growing region within the smart small home appliances market. China exported 4.48 billion appliances in 2024, up 20.8% year on year, and domestic trade-in subsidies accelerate refresh cycles. Haier alone commands 40-50% of Chinese refrigeration and laundry sales, illustrating how local giants influence category roadmaps.North America demonstrates mature penetration but ongoing upgrades toward AI and energy-efficiency compliance. GE Appliances’ EcoBalance integration with ABB’s ReliaHome Smart Panel showcases a holistic energy-management pitch tailored to US electrification incentives. Canadian buyers show similar preferences, with emphasis on insulation-enhanced dwellings that magnify appliance energy-savings benefits.Europe couples stringent regulation with sustainability branding. EU Regulation 2023/826 pressures vendors to minimize standby draw, spurring rapid smart-feature adoption because connected devices can meet the load-management targets more readily. Rising residential electricity prices also nudge consumers toward devices that optimize off-peak usage.The Middle East and Africa market builds on infrastructure expansion and a young demographic eager for smartphone-centric control. Gulf Cooperation Council states leverage high per-capita incomes to import premium smart appliances, whereas African growth aligns with electrification programs. South America’s opportunity is tempered by exchange-rate volatility but remains attractive as connectivity costs fall and urban middle classes expand.
Market Concentration
Industry structure is moderate and increasingly software-oriented. Chinese players upended robotic vacuum leadership as Ecovacs and Roborock combined advanced LiDAR navigation with competitive pricing, siphoning share from early Western incumbents. Traditional multinationals respond by embedding connectivity into legacy lines; Whirlpool, Electrolux, and Bosch integrate app control and AI cycles to protect their installed base.
Three strategic archetypes emerge. First, legacy hardware champions such as Whirlpool bolster digital features primarily through acquisitions and joint ventures; Bosch’s exploratory talks to acquire Whirlpool would constitute the largest merger in sector history and underscore the growing need for scale plus digital talent. Second, technology-diversified conglomerates like Samsung and LG lean on vertically integrated ecosystems—SmartThings and ThinQ—to deliver cross-category stickiness. Third, category-focused innovators such as SharkNinja or Dyson pursue niche leadership with differentiated design and aggressive social-media outreach.
Subscription economics alter the profit pool. LG’s KRW 1 trillion subscription milestone in 2023 proves that recurring revenue can stabilize cash flows during hardware downturns. BSH’s BlueMovement and Homie’s pay-per-wash model signal EU momentum toward circular-economy offerings. As AI maintenance features mature, vendors who own both hardware and data platforms enjoy higher switching costs and richer upsell pathways.

*Disclaimer: Major Players sorted in no particular order
1. Introduction
2. Research Methodology
3. Executive Summary
4. Market Landscape
5. Market Size & Growth Forecasts (Value)
6. Competitive Landscape
7. Market Opportunities & Future Outlook
Market Definitions and Key Coverage
Segmentation Overview
Detailed Research Methodology and Data Validation
Primary Research
Desk Research
Market-Sizing & Forecasting
Data Validation & Update Cycle
Why Mordor's Smart Small Home Appliances Baseline Earns Confidence
Benchmark comparison
| Market Size | Anonymized source | Primary gap driver | ||
|---|---|---|---|---|
USD 39.60 B (2025) | Mordor Intelligence | - | Anonymized source:Mordor Intelligence | Primary gap driver:- |
USD 42.51 B (2025) | Global Consultancy A | Includes large appliances and smart-meter devices | ||
USD 33.80 B (2023) | Industry Association B | Older base year and straight-line growth | ||
USD 29.03 B (2022) | Regional Consultancy C | Limited geography, flat ASP assumption |
A Leading Sanitaryware Company’s Journey in Saudi Arabia
4 Min Read
Strategic Expansion in the Russia Laundry Appliances Market
3 Min Read
US Market Entry for Taiwanese Machine Tool Manufacturers
5 Min Read
When decisions matter, industry leaders turn to our analysts. Let’s talk.