Market Overview
| Study Period | 2021 - 2031 |
|---|---|
| Forecast Data Period | 2026 - 2031 |
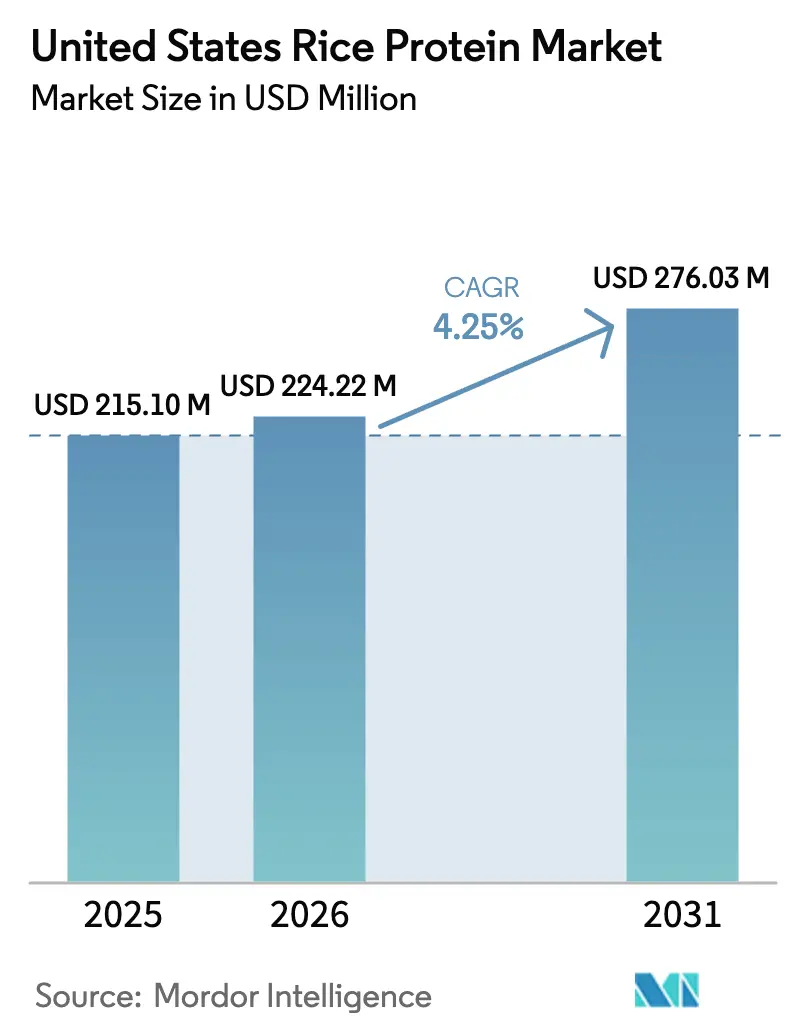
| Base Year Market Size (2025) | USD 215.10 Million |
| Market Size (2026) | USD 224.22 Million |
| Market Size (2031) | USD 276.03 Million |
| Growth Rate (2026 - 2031) | 4.25% CAGR |
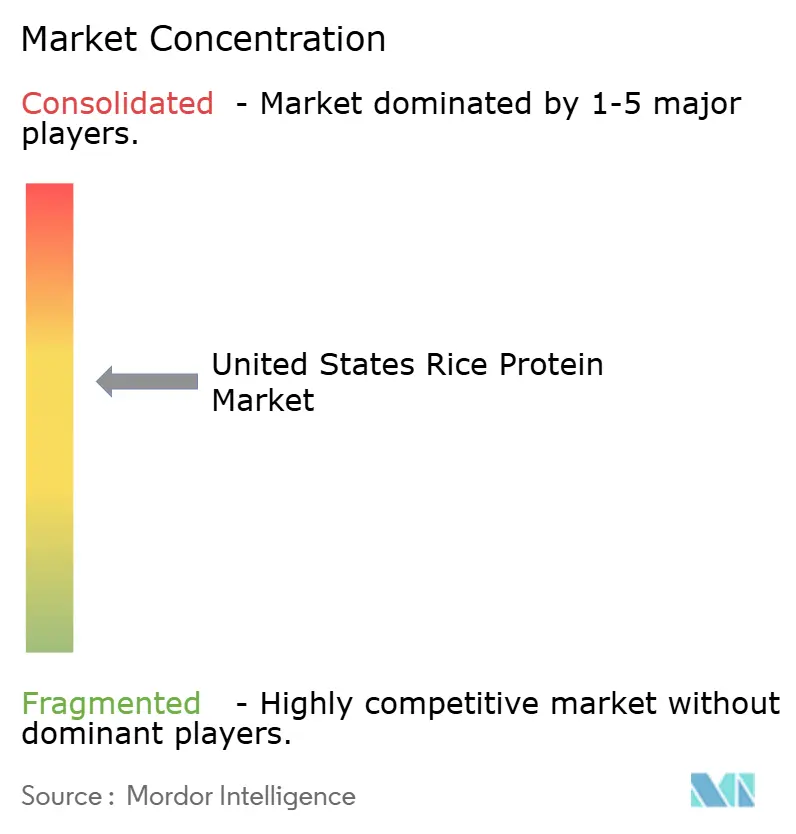
| Market Concentration | Medium |
Major Players *Disclaimer: Major Players sorted in no particular order Image © Mordor Intelligence. Reuse requires attribution under CC BY 4.0. | |
United States Rice Protein Market Analysis by Mordor Intelligence
The United States Rice Protein Market size was valued at USD 215.10 million in 2025 and estimated to grow from USD 224.22 million in 2026 to reach USD 276.03 million by 2031, at a CAGR of 4.25% during the forecast period (2026-2031). As rice protein transitioned from a niche allergen-free ingredient to a more mainstream option, its presence expanded across categories such as sports nutrition, infant formula, and clean-label bakery applications, even as soy and pea proteins continued to exert pricing pressure. This shift was reinforced by regulatory and supply-side developments, including the U.S. Department of Agriculture’s (USDA) 2024 Strengthening Organic Enforcement rule promoting traceable domestic feedstock, an 8% rise in California rice acreage to 434,000 acres for the 2025 season, and the Food and Drug Administration’s (FDA) recognition of rice protein isolates as GRAS for use in infant nutrition. These developments spurred investment in extraction technologies, near-shoring initiatives, and premium product positioning. Competitive activity also accelerated, with Axiom Foods expanding its organic Oryzatein® production capacity and BENEO introducing organic waxy rice starch to strengthen value capture. Although rice protein continued to face higher production costs relative to pea and soy proteins and some tariff-related headwinds in 2025, its hypoallergenic nature, non-GMO profile, and clean-label perception underpinned steady, long-term growth across the U.S. food, beverage, and dietary supplement sectors.
Key Report Takeaways
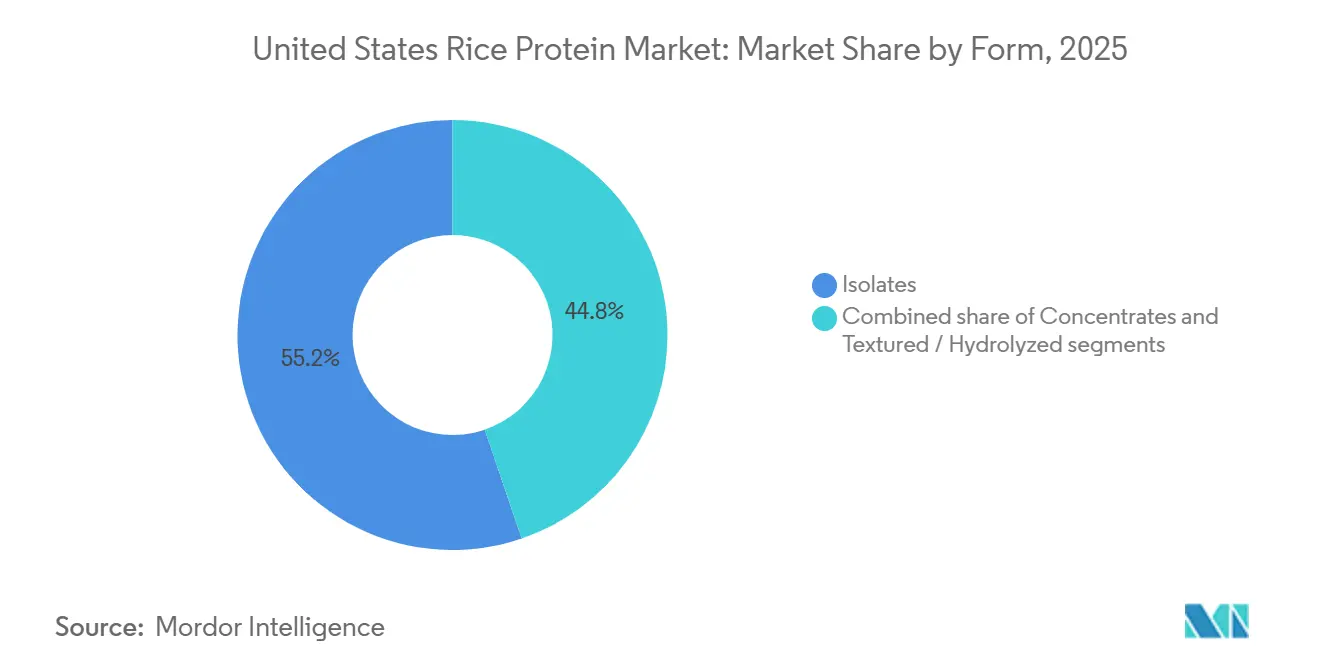
- By form, isolates captured 55.21% of the United States rice protein market share in 2025. Textured and hydrolyzed formats are projected to expand at a 5.49% CAGR through 2031.
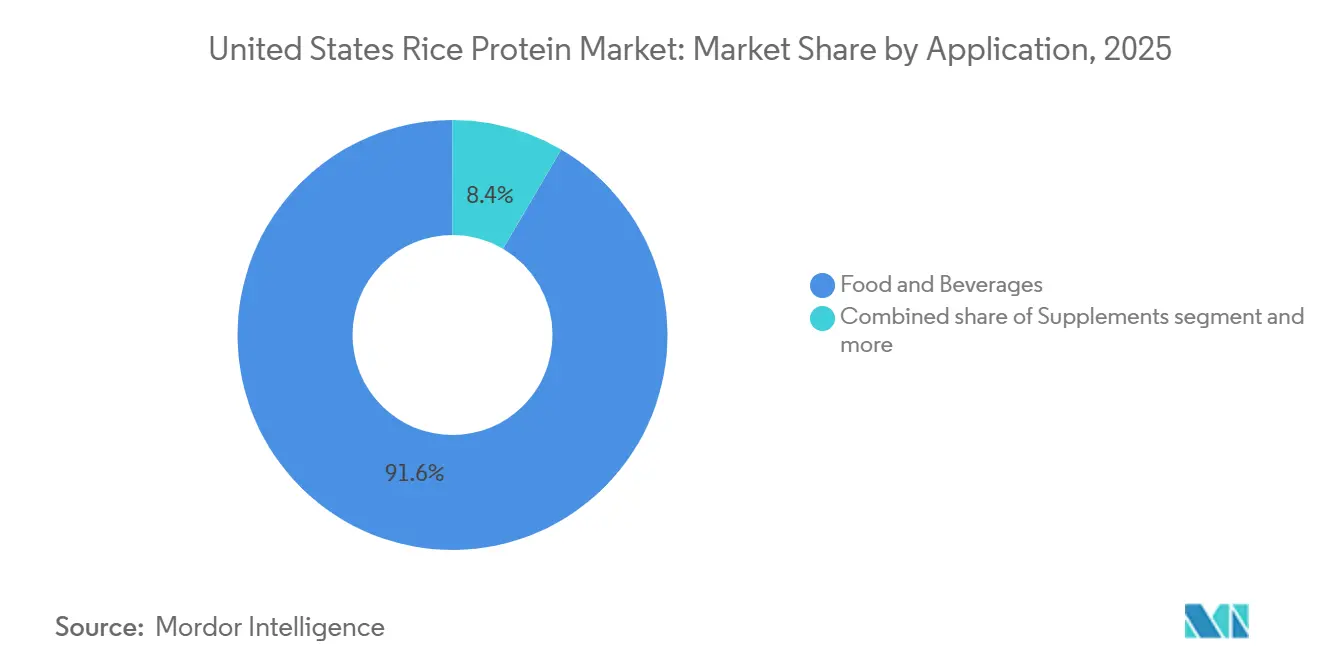
- By application, food and beverages held 91.57% of the United States rice protein market size in 2025, while supplements registered the fastest growth at a 5.91% CAGR to 2031.
Note: Market size and forecast figures in this report are generated using Mordor Intelligence’s proprietary estimation framework, updated with the latest available data and insights as of January 2026.
United States Rice Protein Market Trends and Insights
Drivers Impact Analysis*
| Driver | (~) % Impact on CAGR Forecast | Geographic Relevance | Impact Timeline |
|---|---|---|---|
| Surge in plant-based sports-nutrition launches | +0.8% | National, concentrated in California, Texas, Northeast | Medium term (2-4 years) |
| Growing prevalence of food allergies | +0.7% | National metropolitan clusters | Long term (≥4 years) |
| Clean-label and non-GMO preference | +0.6% | West Coast and Northeast | Medium term (2-4 years) |
| 2025 tariff shifts driving near-shore processing | +0.5% | California and Arkansas | Short term (≤2 years) |
| Expansion of California acreage | +0.4% | California, Pacific Northwest | Medium term (2-4 years) |
| Demand for rice-protein crisps in cereals | +0.3% | Midwest and South | Long term (≥4 years) |
| Source: Mordor Intelligence | |||


Surge in plant-based sports-nutrition launches
In 2024, North America's sports nutrition market was growing, with protein powders dominating at 53% of sales[1]Source: Glanbia PLC, “Investor Presentation 2024,” glanbia.com. As lactose intolerance impacts about 36% of U.S. adults (Glanbia), plant-based formulations are rapidly gaining traction. Rice protein isolates offer a hypoallergenic alternative for formulators, avoiding the nine major allergens listed by the FDA. This allows brands to adopt a "free-from" label while maintaining protein density. The Good Food Institute noted a USD 450 million surge in plant-based protein powder sales in 2024, marking 11% annual growth. Rice-pea blends are increasingly finding their way onto shelves in specialty retail and e-commerce. Axiom Foods introduced Oryzatein® 2.0 in January 2025, boasting improved solubility and a neutral color. This innovation directly addresses athletes' concerns about grittiness and off-flavors that previously relegated rice protein to a secondary role. According to the Plant Based Foods Association, 2024 saw 59% of households embracing plant-based foods, highlighting a shift in acceptance from just vegan consumers to a broader audience, including flexitarians and those with allergen sensitivities.
Growing prevalence of food allergies (dairy/soy/gluten)
According to the Centers for Disease Control and Prevention (CDC), 6.2% of U.S. adults and 5.8% of children suffer from food allergies. Dairy, soy, and wheat are among the nine major allergens responsible for 90% of serious reactions[2]Source: Centers for Disease Control and Prevention, “Food Allergies,” cdc.gov. Notably, rice protein's absence from this list makes it a preferred choice for infant formulas, medical nutrition, and sports supplements, especially for those with multiple sensitivities. Food Allergy Research & Education highlights that while cow's milk and soy are the primary culprits of food-protein-induced enterocolitis syndrome, a severe delayed allergic reaction, rice can also trigger this reaction (FPIES) in certain pediatric cases, challenging the notion of its blanket hypoallergenicity. A regulatory milestone was set in 2016 when the FDA granted Generally Recognized as Safe (GRAS) affirmation to Axiom's Oryzatein®, a move that rice-protein suppliers now cite in their safety dossiers, expediting their market entry. To address lysine deficiencies without compromising their allergen-free status, formulators are increasingly blending rice protein with pea or pumpkin-seed protein. This approach not only enhances nutritional value but also expands their market reach beyond those seeking single-protein solutions.
Clean-label and non-GMO preference among U.S. consumers
By 2024, the Non-GMO Project had verified over 60,000 products. Consumer surveys reveal that 65% of shoppers are inclined to buy items with third-party non-GMO certification[3]Source: Non-GMO Project, “About the Non-GMO Project,” nongmoproject.org. Rice protein enjoys an advantage due to the crop's limited genetic modification. Notably, commercial GMO rice varieties haven't received cultivation approval in the U.S. This status enables processors to obtain non-GMO feedstock without incurring premium costs or navigating intricate identity-preservation protocols. A 2024 survey by the International Food Information Council highlighted that 71% of Americans are actively seeking to boost their protein intake. Furthermore, 79% of respondents weigh the processing level of their protein sources, showing a preference for ingredients with concise and familiar supply chains. In March 2024, the USDA enforced the Strengthening Organic Enforcement rule, sealing loopholes that allowed fraudulent organic imports. This move tightened the supply and boosted the value of domestically certified organic rice bran. In response, Axiom Foods expanded its organic Oryzatein® production capacity threefold in August 2024, foreseeing continued demand from brands prioritizing transparency and traceability.
2025 U.S. tariff shifts driving near-shore rice-protein processing
The Congressional Research Service documented a complex 2025 tariff environment characterized by reciprocal duties and retaliatory measures on agricultural imports, which narrowed the landed-cost advantage that Asian rice-protein suppliers historically enjoyed. U.S. rice production totaled approximately 6.4 million metric tons in 2024, with California contributing roughly 1.9 million tons despite an 8% acreage recovery to 434,000 acres in 2025 following drought-induced contractions as per the USDA's National Agricultural Statistics Service. Domestic processors benefit from proximity to feedstock and the elimination of ocean freight lead times, enabling faster responses to formulation changes and quality specifications. Medium-grain rice, which accounts for approximately 70% of California's output, yields higher protein per ton of bran than long-grain varieties, making West Coast extraction facilities cost-competitive even before tariff adjustments, according to the Economic Research Service of the U.S. Department of Agriculture. Near-shoring also aligns with corporate sustainability commitments to reduce Scope 3 emissions, as shorter supply chains lower carbon footprints and simplify life-cycle assessments for food manufacturers pursuing validation of their Science-Based Targets initiative.
Restraints Impact Analysis*
| Restraint | (~) % Impact on CAGR Forecast | Geographic Relevance | Impact Timeline |
|---|---|---|---|
| Price competition from soy and pea protein | -0.6% | National, affecting all end-use segments | Short term (≤2 years) |
| Higher production and processing costs compared to U.S.-sourced plant proteins | -0.5% | National, with acute pressure on West Coast processors | Medium term (2-4 years) |
| Taste and texture acceptance challenges among U.S. consumers | -0.4% | National, particularly in sports nutrition and ready-to-drink beverages | Medium term (2-4 years) |
| Limited lysine profile restricting single-source-protein claims | -0.3% | National, impacting sports nutrition and medical nutrition formulations | Long term (≥4 years) |
| Source: Mordor Intelligence | |||
Price competition from soy and pea protein
Due to the higher protein content in their raw feedstock and a more mature extraction infrastructure, soy protein isolate and pea protein isolate generally command lower per-kilogram prices than rice protein isolate. For instance, soybean meal boasts a protein content of 35-40%, while rice bran lags behind at 12-15%. As a result, formulators, often constrained by strict cost-of-goods targets, tend to prioritize soy or pea proteins, relegating rice to a secondary or even tertiary role in multi-protein blends. The plant-based protein-powder category, which grew by 11% to reach USD 450 million in 2024, saw pea-protein brands disproportionately capturing the market. These brands managed to undercut their rice-based counterparts on retail shelf pricing by 15-25%, as highlighted by the Good Food Institute[4]Source: Good Food Institute, “State of the Industry: Plant-Based Protein 2024,” gfi.org. While rice protein touts advantages like hypoallergenicity and non-GMO sourcing, these attributes don't position it as a cost leader. This limitation curtails its appeal in price-sensitive markets, including private-label sports nutrition and bulk ingredient sales to contract manufacturers. Axiom Foods, in February 2025, unveiled a heavy-metal-free rice protein line, aiming to command premium pricing through its touted superior safety profiles. However, the success of this initiative hinges on whether brands are willing to absorb the elevated input costs or shift them onto consumers.
Higher production and processing costs compared to U.S.-sourced plant proteins
To achieve 80-90% isolate purity from rice bran, processors must navigate multiple steps: alkaline extraction, enzymatic hydrolysis, membrane filtration, and spray drying. Each step adds costs in labor, energy, and equipment depreciation. In contrast, soy and pea proteins enjoy simpler extraction methods and start with higher protein concentrations, leading to reduced manufacturing costs per pound. While California's rice acreage is set to rebound to 434,000 acres in 2025, enhancing feedstock availability, it doesn't erase the inherent cost disadvantages of rice bran, as highlighted by the USDA's National Agricultural Statistics Service. Processors on the West Coast grapple with heightened energy tariffs and labor costs, especially when compared to their counterparts in Midwest soy-crushing facilities. This disparity tightens margins and curtails capacity expansion investments. Additionally, the USDA's Strengthening Organic Enforcement rule, which took effect in March 2024, has further constrained the organic rice-bran supply. This has led to a 10-15% surge in certified feedstock prices, a premium that organic rice-protein suppliers now face, forcing them to either absorb the costs or pass them downstream.
*Our forecasts treat driver/restraint impacts as directional, not additive. The impact forecasts reflect baseline growth, mix effects, and variable interactions.
Segment Analysis
By Form: Isolates Dominate on Purity and Versatility
In January 2025, Axiom Foods unveiled Oryzatein® 2.0, a white, grit-free isolate free from detectable heavy metals. This launch underscores the innovation cycle propelling isolates to capture a 55.21% market share in 2025. Brands increasingly seek ingredients that seamlessly blend into clear, ready-to-drink beverages and light-hued baked goods, without altering color or flavor. Defined by an 80-90% protein content, isolates command a premium price yet offer the functional neutrality essential for sports shakes, infant formulas, and dairy-alternative yogurts. Textured and hydrolyzed forms are set to grow at a rate of 5.49% through 2031. This growth is driven by breakfast-cereal manufacturers who are incorporating extruded rice-protein crisps to meet "high protein" claims under FDA labeling thresholds. Concentrates, with a protein content of 60-75%, cater to budget-conscious applications like baked snacks and meat extenders, where the emphasis is on bulk protein contribution rather than absolute purity. The industry's pivot towards isolates mirrors broader clean-label trends. The International Food Information Council highlights that 79% of U.S. consumers weigh processing intensity in their protein source choices, leaning towards ingredients they perceive as minimally altered[5]Source: International Food Information Council, “2024 Food & Health Survey,” foodinsight.org.
Textured rice protein, achieved through extrusion or texturization, replicates meat's fibrous mouthfeel. It's commonly used in plant-based burgers and nuggets. However, pea and soy proteins dominate this segment, thanks to their superior water-holding capacity. Hydrolyzed rice protein, processed into smaller peptides through enzymatic treatment, boasts enhanced solubility and quicker digestion. This positions it as a prime choice for sports-recovery beverages and medical nutrition, where swift amino-acid delivery is crucial. BENEO's April 2024 debut of Remyline O AX DR, an organic waxy rice starch, hints at innovations in rice-bran fractionation. This could lead to co-product protein streams and bolster extraction economics. While concentrates and isolates together make up over 90% of the volume, it's the textured and hydrolyzed forms that are rapidly emerging as the frontier. Formulators are keenly exploring these novel textures and bioavailability profiles to set their products apart in the saturated plant-based market.


By Application: Food and Beverages Anchor Demand, Supplements Accelerate
In 2025, U.S. rice-protein shipments saw a dominant 91.57% absorption by the food and beverage sector. This encompassed a wide array of products, including bakery items, confectionery items, beverages, dairy alternatives, meat substitutes, snacks, breakfast cereals, baby food, and infant formula. Meanwhile, the supplements sector, covering areas like elderly medical nutrition and sports performance, anticipates a 5.91% CAGR through 2031. This growth is driven by the increasing demand for hypoallergenic protein sources among lactose-intolerant athletes and an aging population. The Good Food Institute highlighted a notable trend in 2024: plant-based protein powders in North America experienced an 11% surge in sales, reaching a valuation of USD 450 million. Notably, rice-pea blends are starting to take market share from the traditionally dominant whey formulations. Dairy and its alternatives are harnessing rice protein's neutral flavor to enhance plant-based yogurts and creamers, without overshadowing delicate notes like fruit or vanilla. This offers a sensory edge over pea protein, which has more pronounced earthy undertones. In the realm of meat and its alternatives, textured rice protein is being used to enhance bite and juiciness. However, soy and pea proteins remain favored for their superior binding capabilities.
Snacks and breakfast cereals are emerging as a high-growth sub-segment. Extruded rice-protein crisps are helping cereal manufacturers achieve the FDA's "high protein" benchmark of 10-15 grams per serving, all while preserving the light, crunchy texture that consumers love. When it comes to baby food and infant formula, there's a clear demand for rice protein isolates. These isolates not only meet the FDA's hypoallergenicity standards but are especially crucial for infants sensitive to cow's milk or soy. However, a word of caution from Food Allergy Research & Education: while rice protein is beneficial, rice itself can, in rare cases, trigger food-protein-induced enterocolitis syndrome in a small subset of children. In the beverage sector, ready-to-drink shakes and protein-fortified juices are seeking rice protein isolates that offer enhanced solubility. Axiom's Oryzatein® 2.0, which debuted in January 2025, is making waves with its improved dispersibility, specifically targeting this market. The personal care and cosmetics industry is leveraging rice protein's film-forming and moisturizing properties. However, it's worth noting that this segment remains relatively small compared to the vast food applications. Lastly, in the animal feed sector, covering both pet food and livestock nutrition, lower-grade rice-protein concentrates are being utilized. These offer a cost-effective source of amino acids, albeit without the stringent purity standards mandated for human consumption.
Geography Analysis
California's rice acreage is set to rebound to 434,000 planted acres in 2025, marking an 8% rise from the previous year's drought-hit 402,000 acres. This recovery ensures a steady feedstock supply for West Coast protein-extraction facilities, which predominantly process medium-grain rice. According to the USDA's National Agricultural Statistics Service, this rice variety boasts a bran protein content of 12-15%. Concentrated in the Sacramento Valley, rice mills and stabilization plants benefit from geographic clustering. This is crucial since rice bran, to avoid rancidity, needs enzymatic deactivation shortly after milling, thus limiting economical transport distances. Axiom Foods, a California-based company, seized this advantage. In August 2024, they tripled their organic Oryzatein® production capacity. This move was in response to the USDA's March 2024 enforcement of the Strengthening Organic Enforcement rule, which targeted fraudulent organic imports and tightened the certified supply chain.
California's 2024 rice harvest was about 1.9 million tons. With promising water allocations for 2025, a stable output is anticipated. This stability is expected to mitigate feedstock-price volatility, a historical challenge that has compressed processor margins, as noted by the Economic Research Service, U.S. Department of Agriculture. Consumption trends show a tilt towards urban centers on the West Coast and Northeast. In 2024, plant-based food penetration in households hit 59%. Clean-label preferences in these regions have fostered a tolerance for premium pricing, as highlighted by the Plant Based Foods Association. Meanwhile, Texas and the Southeast are emerging as growth hotspots. Here, sports-nutrition brands are broadening their distribution, leveraging specialty retail and e-commerce channels to sidestep traditional grocery gatekeepers.
In the Midwest, the production capacity for ready-to-eat cereals is creating a demand for extruded rice-protein crisps. Breakfast-cereal manufacturers are incorporating these crisps to prominently feature "high protein" claims on their packaging, in line with FDA labeling regulations. While Arkansas stands as the second-largest rice-producing state in the U.S., it primarily cultivates long-grain varieties. These varieties yield lower protein per ton of bran, thereby limiting Arkansas's influence in the rice-protein supply chain compared to California's medium-grain leadership. The 2025 U.S. tariff landscape, characterized by reciprocal duties and retaliatory actions on agricultural imports, has diminished the cost advantage that Asian rice-protein suppliers once enjoyed. This shift has spurred an increase in domestic processing capacities, especially in California and the Pacific Northwest, as reported by the Congressional Research Service.
Competitive Landscape
In the U.S. rice-protein market, moderate consolidation is evident. Key players like Axiom Foods, RiceBran Technologies, Kerry Group, Archer Daniels Midland, and Südzucker's BENEO unit dominate with established extraction capacities and strong customer ties. Meanwhile, regional co-packers and organic specialists are seizing opportunities in certified non-GMO isolates and tailored formulations. Axiom Foods' January 2025 debut of Oryzatein® 2.0, a white, grit-free isolate, showcases the industry's technological race. Validated by Dyad Labs to be free of detectable heavy metals, this launch aims to address rice protein's past contamination and texture challenges, positioning Axiom for premium accounts in sports nutrition and infant formulas.
In April 2024, BENEO rolled out Remyline O AX DR, marking the debut of organic waxy rice starch in the market. This move not only underscores BENEO's expertise in rice-bran fractionation but also hints at diversifying revenue avenues beyond just protein isolates. A trend of vertical integration emerges, with top players, like BENEO, securing long-term agreements with California mills. This strategy locks in feedstock pricing and guarantees traceability for both organic and non-GMO certifications. Notable opportunities lie in enzymatically hydrolyzed rice protein, ideal for sports-recovery drinks due to its quicker amino-acid absorption, and in textured rice protein for plant-based meats, where advancements in water-binding could rival the dominance of soy and pea proteins.
Disruptors are on the rise, with brands like Sunwarrior taking the lead. Sunwarrior produces fermented brown rice protein at its Southern Utah facility and sells directly to consumers online, sidestepping traditional distribution and reaping higher profits. In March 2024, the USDA's enforcement of Strengthening Organic Enforcement rules reshaped supplier dynamics. By curbing fraudulent organic imports, the move boosted the worth of domestically certified organic rice bran, benefiting processors with strong traceability. Axiom's Oryzatein® received FDA's GRAS affirmation in 2016, setting a regulatory benchmark. This precedent now aids other suppliers in crafting their safety dossiers, expediting market entry for new isolates and easing the path for well-funded newcomers.
United States Rice Protein Industry Leaders
Axiom Foods Inc.
RiceBran Technologies
Kerry Group PLC
Archer Daniels Midland Co.
Südzucker Group (BENEO)
- *Disclaimer: Major Players sorted in no particular order

Recent Industry Developments
- February 2025: Axiom Foods launched a heavy-metal-free rice protein line targeting food and beverage applications, addressing industry concerns about arsenic and cadmium contamination in rice-derived ingredients and positioning the company for infant formula and clean-label sports nutrition accounts.
- January 2025: Axiom Foods introduced Oryzatein® 2.0, a white, grit-free, extra-low-heavy-metal rice protein isolate validated by Dyad Labs to contain undetectable contaminants, offering enhanced solubility and neutral sensory properties for infant nutrition and plant-based beverage applications.
- May 2024: SunOpta completed a USD 26 million expansion at its Modesto, California, facility to increase oat-extraction and oatmilk production capacity, reflecting the broader growth of plant-based beverages that indirectly supports demand for complementary proteins, such as rice isolates, in dairy-alternative formulations.
- April 2024: BENEO launched Remyline O AX DR, the first-to-market organic waxy rice starch derived from organic rice, with global commercial availability beginning in July 2024, demonstrating adjacent innovation in rice-bran fractionation that could yield co-product protein streams.


United States Rice Protein Market Report Scope
The rice protein market comprises plant-based protein ingredients derived from rice, primarily valued for their hypoallergenic nature, non-GMO profile, and suitability for clean-label and specialized nutrition applications. Its scope encompasses formulation and use across the food, nutrition, and non-food industries. By form, the market is segmented into concentrates, isolates, and textured or hydrolyzed rice proteins, which differ in protein content, functionality, and application suitability. By application, the market spans food and beverages, including bakery and confectionery, beverages, dairy and dairy-alternative products, meat and meat-alternative products, snacks and breakfast cereals, baby food and infant formula, as well as other food applications, where rice protein is utilized for nutritional fortification, allergen avoidance, and texture enhancement. The scope also includes supplements, such as elderly and medical nutrition, as well as sports and performance nutrition, where digestibility and hypoallergenicity are critical. Additionally, it encompasses personal care and cosmetics applications that leverage rice protein for conditioning and skin-friendly properties, and animal feed formulations where it serves as a plant-based protein source.
By Form
| Concentrates |
| Isolates |
| Textured / Hydrolyzed |
By Application
| Food and Beverages | Bakery and Confectionery |
| Beverages | |
| Dairy and Dairy Alternative Products | |
| Meat and Meat-Alternative Products | |
| Snacks and Breakfast Cereals | |
| Baby Food and Infant Formula | |
| Other Food and Beverages | |
| Supplements | Elderly and Medical Nutrition |
| Sports/Performance Nutrition | |
| Personal Care and Cosmetics | |
| Animal Feed |
| By Form | Concentrates | |
| Isolates | ||
| Textured / Hydrolyzed | ||
| By Application | Food and Beverages | Bakery and Confectionery |
| Beverages | ||
| Dairy and Dairy Alternative Products | ||
| Meat and Meat-Alternative Products | ||
| Snacks and Breakfast Cereals | ||
| Baby Food and Infant Formula | ||
| Other Food and Beverages | ||
| Supplements | Elderly and Medical Nutrition | |
| Sports/Performance Nutrition | ||
| Personal Care and Cosmetics | ||
| Animal Feed | ||


Market Definition
- End User - The Protein Ingredients Market operates on a B2B basis. Food, Beverages, Supplements, Animal Feed, and Personal Care & Cosmetic manufacturers are considered to be end-consumers in the market studied. The scope excludes manufacturers buying liquid/dry whey to be used for application as a binding agent or thickener or other non-protein applications.
- Penetration Rate - Penetration Rate is defined as the percentage of Protein-Fortified End User Market Volume in the Overall End User Market Volume.
- Average Protein Content - Average protein content is the average protein content present per 100 g of product manufactured by all end-user companies considered under the scope of this report.
- End User Market Volume - End-user market volume is the consolidated volume of all types and forms of end-user products in the country or region.
| Keyword | Definition |
|---|---|
| Alpha-lactalbumin (α-Lactalbumin) | It is a protein that regulates the production of lactose in the milk of almost all mammalian species. |
| Amino acid | It is an organic compound that contains both amino and carboxylic acid functional groups, which are required for the synthesis of body protein and other important nitrogen-containing compounds, such as creatine, peptide hormones, and some neurotransmitters. |
| Blanching | It is the process of briefly heating vegetables with steam or boiling water. |
| BRC | British Retail Consortium |
| Bread improver | It is a flour-based blend of several components with specific functional properties designed to modify dough characteristics and give quality attributes to bread. |
| BSF | Black Soldier Fly |
| Caseinate | It is a substance produced by adding an alkali to acid casein, a derivative of casein. |
| Celiac disease | Celiac disease is an immune reaction to eating gluten, a protein found in wheat, barley, and rye. |
| Colostrum | It is a milky fluid that’s released by mammals that have recently given birth before breast milk production begins. |
| Concentrate | It is the least processed form of protein and has a protein content ranging from 40-90% by weight. |
| Dry protein basis | It refers to the percentage of "pure protein" present in a supplement after the water in it is completely removed through heat. |
| Dry whey | It is the product resulting from drying fresh whey which has been pasteurized and to which nothing has been added as a preservative. |
| Egg protein | It is a mixture of individual proteins, including ovalbumin, ovomucoid, ovoglobulin, conalbumin, vitellin, and vitellenin. |
| Emulsifier | It is a food additive that facilitates the blending of foods that are immiscible with one another, such as oil and water. |
| Enrichment | It is the process of addition of micronutrients that are lost during the processing of the product. |
| ERS | Economic Research Service of the USDA |
| Extrusion | It is the process of forcing soft mixed ingredients through an opening in a perforated plate or die designed to produce the required shape. The extruded food is then cut to a specific size by blades. |
| Fava | Also known as Faba, it is another word for yellow split beans. |
| FDA | Food and Drug Administration |
| Flaking | It is a process in which typically a cereal grain (like corn, wheat, or rice) is broken down into grits, cooked with flavors and syrups, and then pressed into flakes between cooled rollers. |
| Foaming agent | It is a food ingredient that makes it possible to form or maintain a uniform dispersion of a gaseous phase in a liquid or solid food. |
| Foodservice | It refers to the part of the food industry which includes businesses, institutions, and companies which prepare meals outside the home. It includes restaurants, school and hospital cafeterias, catering operations, and many other formats. |
| Fortification | It is the deliberate addition of micronutrients that are not found in them naturally or which are lost during processing, to improve a food product's nutritional value. |
| FSANZ | Food Standards Australia New Zealand |
| FSIS | Food Safety and Inspection Service |
| FSSAI | Food Safety and Standards Authority of India |
| Gelling agent | It is an ingredient that functions as a stabilizer and thickener to provide thickening without stiffness through the formation of gel. |
| GHG | Greenhouse Gas |
| Gluten | It is a family of proteins found in grains, including wheat, rye, spelt, and barley. |
| Hemp | It is a botanical class of Cannabis sativa cultivars grown specifically for industrial or medicinal use. |
| Hydrolysate | It is a form of protein manufactured by exposing the protein to enzymes that can partially break the bonds between the protein's amino acids and break down large, complicated proteins into smaller pieces. Its processing makes it easier and quicker to digest. |
| Hypoallergenic | It refers to a substance that causes fewer allergic reactions. |
| Isolate | It is the purest and most processed form of protein which has undergone separation to obtain a pure protein fraction. It typically contains ≥ 90% of protein by weight. |
| Keratin | It is a protein that helps form hair, nails, and the outer layer of skin. |
| Lactalbumin | It is the albumin contained in milk and obtained from whey. |
| Lactoferrin | It is an iron‑binding glycoprotein that is present in the milk of most mammals. |
| Lupin | It is the yellow legume seeds of the genus Lupinus. |
| Millenial | Also known as Generation Y or Gen Y, it refers to the people born from 1981 to 1996. |
| Monogastric | It refers to an animal with a single-compartmented stomach. Examples of monogastric include humans, poultry, pigs, horses, rabbits, dogs, and cats. Most monogastric are generally unable to digest much cellulose food materials such as grasses. |
| MPC | Milk protein concentrate |
| MPI | Milk protein isolate |
| MSPI | Methylated soy protein isolate |
| Mycoprotein | Mycoprotein is a form of single-cell protein, also known as fungal protein, derived from fungi for human consumption. |
| Nutricosmetics | It is a category of products and ingredients that act as nutritional supplements to care for skin, nails, and hair natural beauty. |
| Osteoporosis | It is a medical condition in which the bones become brittle and fragile from loss of tissue, typically as a result of hormonal changes, or deficiency of calcium or vitamin D. |
| PDCAAS | Protein digestibility-corrected amino acid score (PDCAAS) is a method of evaluating the quality of a protein based on both the amino acid requirements of humans and their ability to digest it. |
| Per-capita consumption of animal protein | It is the average amount of animal protein (such as milk, whey, gelatin, collagen, and egg proteins) that is readily available for consumption by each person in an actual population. |
| Per-capita consumption of plant protein | It is the average amount of plant protein (such as soy, wheat, pea, oat, and hemp proteins) that is readily available for consumption by each person in an actual population. |
| Quorn | It is a microbial protein manufactured using mycoprotein as an ingredient, in which the fungus culture is dried and mixed with egg albumen or potato protein, which acts as a binder, and then is adjusted in texture and pressed into various forms. |
| Ready-to-Cook (RTC) | It refers to food products that include all of the ingredients, where some preparation or cooking is required through a process that is given on the package. |
| Ready-to-Eat (RTE) | It refers to a food product prepared or cooked in advance, with no further cooking or preparation required before being eaten. |
| RTD | Ready-to-Drink |
| RTS | Ready-to-Serve |
| Saturated fat | It is a type of fat in which the fatty acid chains have all single bonds. It is generally considered unhealthy. |
| Sausage | It is a meat product made of finely chopped and seasoned meat, which may be fresh, smoked, or pickled and which is then usually stuffed into a casing. |
| Seitan | It is a plant-based meat substitute made out of wheat gluten. |
| Softgel | It is a gelatin-based capsule with a liquid fill. |
| SPC | Soy protein concentrate |
| SPI | Soy protein isolate |
| Spirulina | It is a biomass of cyanobacteria that can be consumed by humans and animals. |
| Stabilizer | It is an ingredient added to food products to help maintain or enhance their original texture, and physical and chemical characteristics. |
| Supplementation | It is the consumption or provision of concentrated sources of nutrients or other substances that are intended to supplement nutrients in the diet and is intended to correct nutritional deficiencies. |
| Texturant | It is a specific type of food ingredient that is used to control and alter the mouthfeel and texture of food and beverage products. |
| Thickener | It is an ingredient that is used to increase the viscosity of a liquid or dough and make it thicker, without substantially changing its other properties. |
| Trans fat | Also called trans-unsaturated fatty acids or trans fatty acids, it is a type of unsaturated fat that naturally occurs in small amounts in meat. |
| TSP | Textured soy protein |
| TVP | Textured vegetable protein |
| WPC | Whey protein concentrate |
| WPI | Whey protein isolate |


Research Methodology
Mordor Intelligence follows a four-step methodology in all our reports.
- Step-1: Identify Key Variables: The quantifiable key variables (industry and extraneous) pertaining to the specific product segment and country are selected from a group of relevant variables & factors based on desk research & literature review; along with primary expert inputs. These variables are further confirmed through regression modeling (wherever required).
- Step-2: Build a Market Model: In order to build a robust forecasting methodology, the variables and factors identified in Step-1 are tested against available historical market numbers. Through an iterative process, the variables required for market forecast are set and the model is built on the basis of these variables.
- Step-3: Validate and Finalize: In this important step, all market numbers, variables and analyst calls are validated through an extensive network of primary research experts from the market studied. The respondents are selected across levels and functions to generate a holistic picture of the market studied.
- Step-4: Research Outputs: Syndicated Reports, Custom Consulting Assignments, Databases & Subscription Platforms


