Market Overview
| Study Period | 2021 - 2031 |
|---|---|
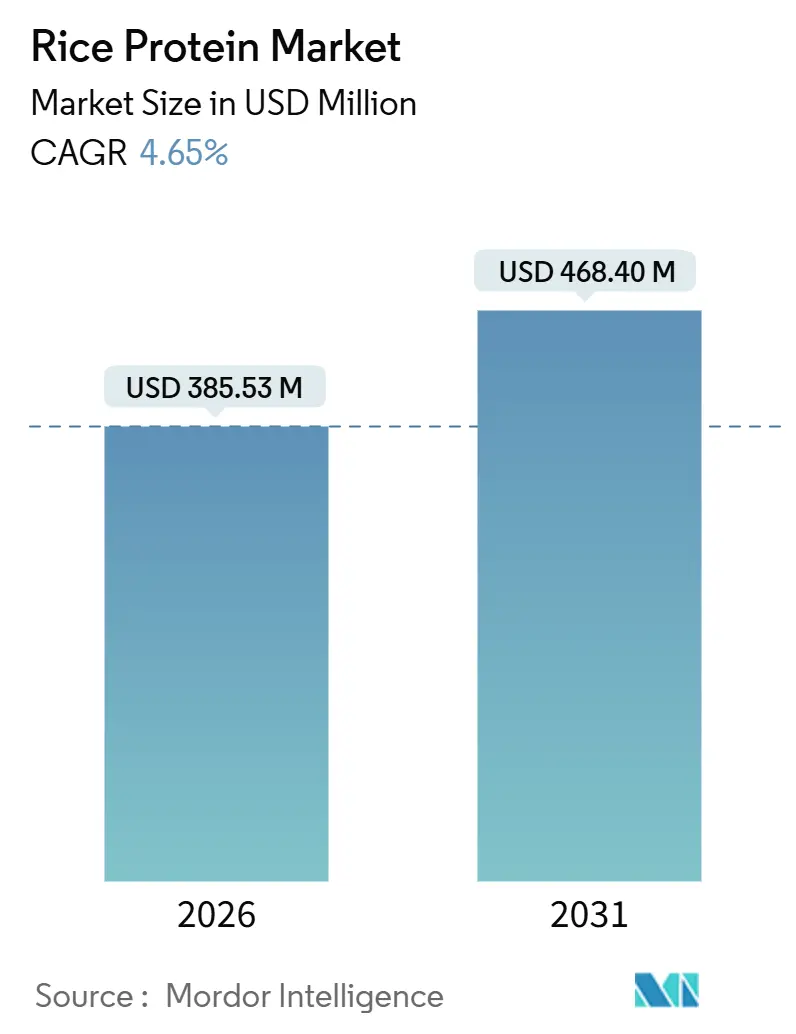
| Market Size (2026) | USD 385.53 Million |
| Market Size (2031) | USD 468.40 Million |
| Growth Rate (2026 - 2031) | 4.65% CAGR |
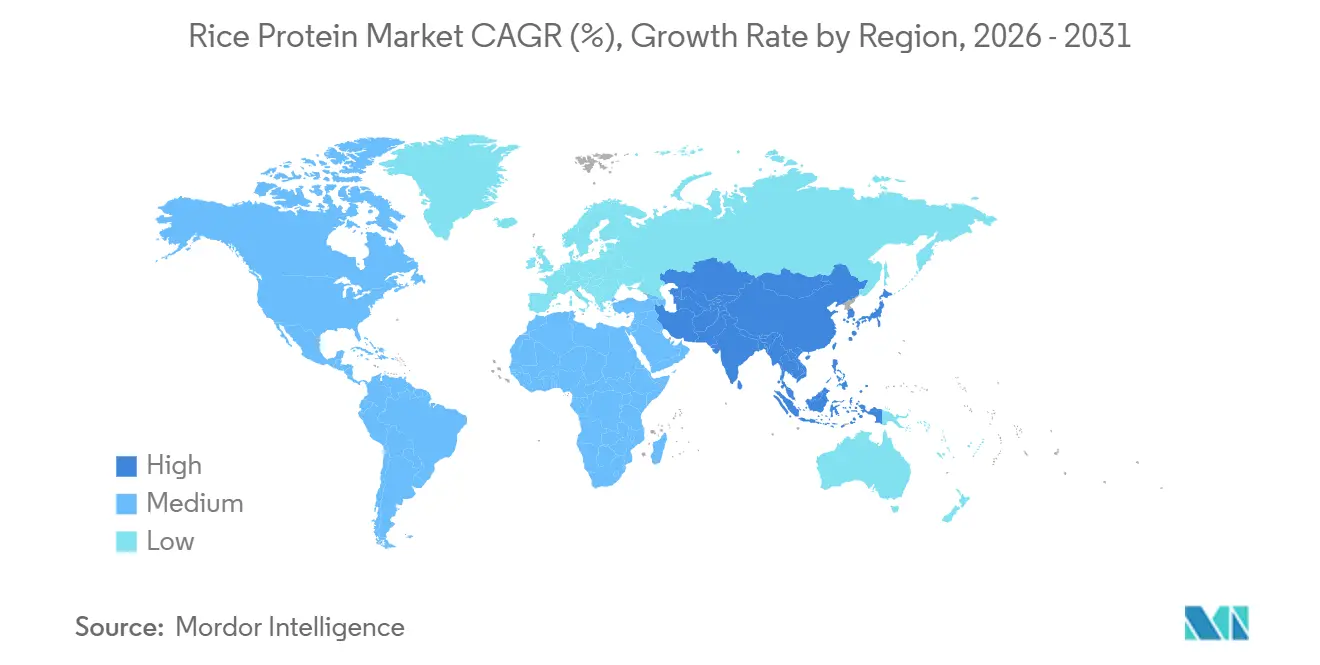
| Fastest Growing Market | Asia Pacific |
| Largest Market | Asia-Pacific |
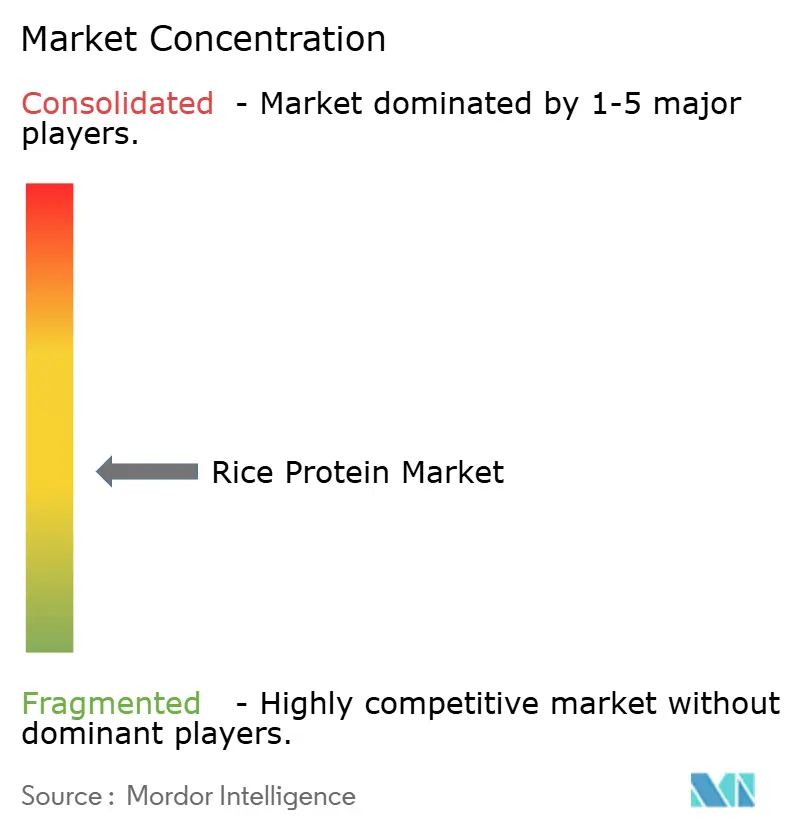
| Market Concentration | Medium |
Major Players
*Disclaimer: Major Players sorted in no particular order Image © Mordor Intelligence. Reuse requires attribution under CC BY 4.0. |
|
Rice Protein Market Analysis by Mordor Intelligence
The rice protein market size hit USD 385.53 million in 2026 and is projected to climb to USD 468.40 million by 2031, reflecting a 4.65% CAGR. Robust demand comes from hypoallergenic infant nutrition, clean-label sports supplements, and plant-based meat analogs, even though the ingredient’s lower native protein content raises extraction costs. Broken-rice valorization is easing some input-price pressure, while investments in heavy-metal remediation technology enable suppliers to satisfy the FDA’s 100 ppb arsenic ceiling and access premium infant-formula contracts. Competitive strategies now emphasize taste-masking systems and hydrolysate development, signaling that functionality rather than protein yield will decide near-term share gains. Finally, growth opportunities remain strong in acidic beverage matrices and high-protein bakery, where solubility and mouthfeel gaps are not yet closed.
Key Report Takeaways
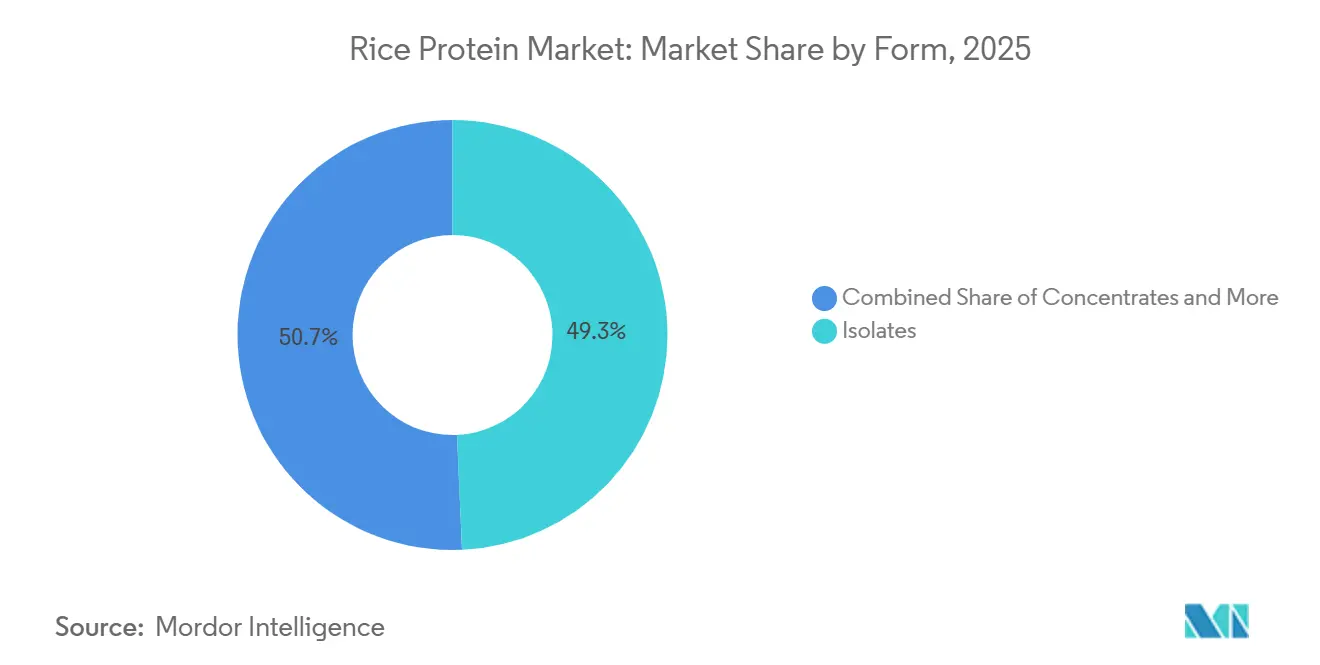
- Isolates captured 49.30% of the rice protein market share in 2025.
- Hydrolyzed formats are advancing at a 5.62% CAGR, the fastest among form segments through 2031.
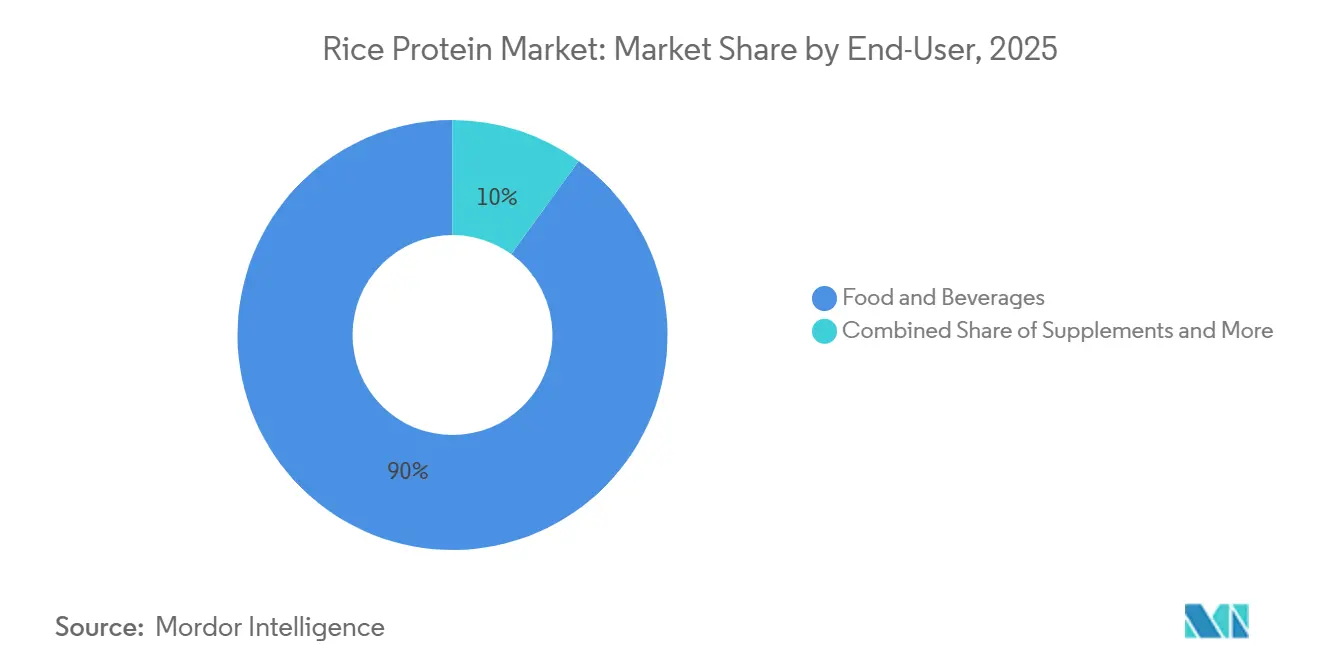
- Food and beverages secured 90.04% of 2025 revenue, the largest slice of the rice protein market.
- Supplements are forecast to expand at a 6.24% CAGR, outpacing every other end-user category.
- Asia-Pacific commanded 33.87% of the 2025 value and is set to grow at a 5.45% CAGR, the quickest regional climb.
Note: Market size and forecast figures in this report are generated using Mordor Intelligence’s proprietary estimation framework, updated with the latest available data and insights as of January 2026.
Global Rice Protein Market Trends and Insights
Drivers Impact Analysis*
| DRIVER | (~)% IMPACT ON CAGR FORECAST | GEOGRAPHIC RELEVANCE | IMPACT TIMELINE |
|---|---|---|---|
| Rising demand for plant-based proteins in sports nutrition | +0.8% | Global, with concentration in North America and Europe | Medium term (2-4 years) |
| Increasing vegan and lactose-intolerant consumer base | +1.2% | Global, strongest in Asia-Pacific (90% lactose intolerance in East Asian populations) | Long term (≥ 4 years) |
| Favorable regulations for hypo-allergenic infant nutrition | +0.6% | North America and EU, early adoption in Australia | Short term (≤ 2 years) |
| Functional edge of rice protein in high-moisture meat analog extrusion | +0.5% | Asia-Pacific core, spill-over to North America plant-based meat hubs | Medium term (2-4 years) |
| Cost advantages from up-cycling broken rice streams | +0.4% | Asia-Pacific (China, India, Thailand, Vietnam) | Long term (≥ 4 years) |
| Clean-label positioning strengthens brand differentiation | +0.7% | Global, premium segments in North America and Western Europe | Medium term (2-4 years) |
| Source: Mordor Intelligence | |||


Rising Demand for Plant-Based Proteins in Sports Nutrition
Peer-reviewed trials show muscle-protein synthesis rates equal to whey when leucine is co-supplemented, boosting the rice protein market among athletes. North American and European specialty retailers have expanded shelf space for blends that couple rice with pea or hemp to deliver complete amino-acid profiles. Hydrolyzed variants ease chalky mouthfeel, helping ready-to-drink shakes address texture complaints. Axiom Foods leverages clinical data to position Oryzatein as a hypoallergenic option for lactose-intolerant consumers. The sports-nutrition channel is therefore growing at roughly double the overall rice protein market, even though flavor challenges remain a hurdle
Increasing Vegan and Lactose-Intolerant Consumer Base
Approximately 65% to 70% of the global population exhibits some degree of lactose malabsorption[1]National Library of Medicine, "Lactose Intolerance", www.ncbi.nlm.nih.gov, with prevalence exceeding 90% among individuals of East Asian descent. This genetic reality, coupled with the rise of flexitarian diets, is pushing food manufacturers to reformulate dairy-centric products with plant proteins. According to the latest findings from The Vegan Society, around 2 million individuals in Great Britain in 2024, or 3% of the population, now identify as vegan or adhere to a plant-based diet[2]The Vegan Society, "Nationwide trends highlight growing shift toward plant-based diets", www.vegansociety.com. Rice protein appeals to this cohort because it is inherently free of the top 8 allergens and carries a "clean" label perception relative to soy, which faces GMO concerns in certain markets. However, the segment's growth is tempered by competition from oat, almond, and pea proteins that deliver creamier textures in plant-based milk and yogurt applications. Suppliers that invest in enzymatic modification to improve emulsification and water-holding capacity will capture a disproportionate share of dairy-alternative innovation pipelines.
Cost Advantages from Up-Cycling Broken Rice Streams
Broken rice kernels fractured during milling historically sold at a 20% to 30% discount to whole grain and found use in animal feed or low-grade flour. Converting this byproduct into protein isolate adds significant value; a tonne of broken rice yielding 70 kilograms of 80% isolate can generate revenue multiples higher than commodity grain sales. The USDA's December 2024 World Agricultural Supply and Demand Estimates report projected global rice ending stocks at 190 million tonnes for 2025/26, up 1.5 million tons from the previous forecast, ensuring ample feedstock availability[3]USDA, "Rice Outlook: January 2026", ers.usda.gov. India's intermittent export restrictions on non-basmati rice have periodically tightened supply, yet Thailand, Vietnam, and China maintain surplus capacity. Processors in these countries are investing in alkaline-extraction and enzymatic-hydrolysis lines to capture margin from what was previously a waste stream, effectively lowering the floor price for rice protein and pressuring pea and soy suppliers in price-sensitive applications.
Clean-Label Positioning Strengthens Brand Differentiation
A 2024 consumer survey by Label Insight found that 73% of respondents are willing to pay a premium for products with recognizable, minimally processed ingredients. Rice protein marketed as "just rice and water" resonates with this demand, particularly in North America and Western Europe, where skepticism of soy's GMO prevalence and pea protein's earthy flavor persists. Brands such as NutriBiotic and The Green Labs emphasize non-GMO, organic sourcing, and third-party heavy-metal testing to reinforce transparency. This positioning is most effective in premium segments like ready-to-drink protein shakes, plant-based infant formula, and sports-nutrition powders, where consumers scrutinize ingredient lists and are less price-sensitive. However, clean-label claims alone do not overcome functional deficits; suppliers must pair transparency with taste and texture improvements to convert trial into repeat purchase.
Restraints Impact Analysis*
| RESTRAINT | (~)% IMPACT ON CAGR FORECAST | GEOGRAPHIC RELEVANCE | IMPACT TIMELINE |
|---|---|---|---|
| High production cost vs. pea and soy protein | -0.9% | Global, most acute in cost-sensitive food and beverage applications | Long term (≥ 4 years) |
| Gritty mouthfeel limits use in certain beverages | -0.3% | North America and Europe ready-to-drink segment | Short term (≤ 2 years) |
| Limited solubility/functionality in acidic matrices | -0.4% | Global beverage applications (pH < 4.5) | Medium term (2-4 years) |
| Arsenic-related supply chain scrutiny and batch rejections | -0.6% | Asia-Pacific sourcing, regulatory impact in North America and EU | Short term (≤ 2 years) |
| Source: Mordor Intelligence | |||
High Production Cost vs. Pea and Soy Protein
Rice grain contains 7% to 9% protein by weight, compared to 35% to 45% in soybeans and 20% to 25% in yellow peas, meaning processors must handle 4 to 6 times more raw material to yield equivalent isolate volumes. This mass imbalance drives up energy, water, and enzyme costs in alkaline-extraction or enzymatic-hydrolysis workflows. While broken rice trades at a discount, the capital intensity of protein-separation equipment and the need for multi-stage purification to remove starch and fiber erode the margin. Ingredion and Lantmännen's November 2024 announcement of a EUR 100 million+ pea-protein facility in Sweden, scheduled for 2027 commissioning, underscores how competitors are scaling legume-based capacity to capture cost-sensitive food manufacturers. Rice-protein suppliers can partially offset this disadvantage by co-locating extraction plants at rice mills to minimize logistics and by targeting premium applications—infant formula, sports nutrition, cosmetics, where hypoallergenicity commands a price premium that absorbs higher input costs.
Arsenic-Related Supply Chain Scrutiny and Batch Rejections
Rice naturally accumulates inorganic arsenic from soil and irrigation water, particularly in flooded paddy systems. The FDA's 100 parts per billion action level for infant rice cereals and the European Union's 100 ppb limit for rice destined for young children have prompted buyers to demand batch-level certificates of analysis. Suppliers sourcing from regions with high groundwater arsenic, parts of Bangladesh, India, and southern China, face elevated rejection rates and must invest in pre-screening or switch to lower-risk geographies such as California, Italy, or specific provinces in Thailand. Axiom Foods mitigates this risk by contracting with growers who use aerobic irrigation and by implementing proprietary washing protocols that reduce heavy-metal carryover into the final isolate. Smaller processors lacking these controls risk margin compression from rework, disposal costs, and reputational damage if contaminated product reaches retail. This dynamic is consolidating the infant-nutrition segment around a few certified suppliers, while commodity-grade rice protein for animal feed or industrial use operates under less stringent oversight.
*Our forecasts treat driver/restraint impacts as directional, not additive. The impact forecasts reflect baseline growth, mix effects, and variable interactions.
Segment Analysis
By Form: Hydrolyzed Formats Gain Traction in Clinical Nutrition
Isolates captured 49.30% of the rice protein market share in 2025, fueled by near-neutral taste and ≥80% protein purity demanded by sports drinks and plant-based shakes. Hydrolyzed rice protein ranks as the fastest-growing form, expanding at 5.62% annually thanks to peptide sizes that boost solubility and accelerate gastric absorption. Concentrates at 60% to 70% protein remain popular in cost-conscious bakery and snack lines, yet their share is slipping as brands pursue higher protein claims that isolates deliver. Textured rice protein, produced via extrusion, is a niche but steadily adopted in Asian meat analogs. Suppliers that deploy multi-enzyme cascades, such as alcalase for primary cleavage and flavourzyme for bitterness reduction, can command premium pricing in elderly and clinical nutrition, and this capability is expected to support the rice protein market size for hydrolysates through 2031.
Concentrates and textured formats together accounted for roughly half of the 2025 volume, but cost pressure from pea and soy keeps their growth in check. Hydrolyzed variants attract infant-formula brands seeking minimal allergenicity, yet higher processing costs limit use in budget categories. Axiom Foods’ Oryzatein 2.0 isolate, launched in January 2025, raises the performance bar with a white, grit-free powder that stays suspended in clear drinks. The long-term trajectory will hinge on scaling hydrolysis economically and masking residual bitterness to maintain consumer acceptance.


By End-User: Supplements Outpace Food and Beverages on Vegan Tailwinds
Food and beverages generated 90.04% of 2025 revenue, underscoring their central role in the rice protein market. Within this umbrella, bakery fortification, plant-based meat analogs, and ready-to-drink shakes dominate demand. However, supplements are expanding at a 6.24% CAGR, the fastest among end users, propelled by vegan athletes who value clinical data showing rice-protein bioavailability equal to whey. Personal-care applications hold a small share but are gaining traction as rice peptides find use as humectants in skin-care serums.
The supplements channel splits into sports nutrition, where peer-reviewed evidence supports performance claims, and elderly or medical nutrition that favors hydrolysates for rapid digestion. Glanbia’s flavor-modulation expertise now helps formulators mute grain notes in chocolate or vanilla shakes, a step critical for mainstream adoption. The rice protein market size for personal care remains modest, but growth prospects improve as brands chase plant-derived actives for clean-beauty lines. Suppliers must juggle multiple SKUs isolates for sports drinks, concentrates for snacks, and hydrolysates for clinical formulations to meet divergent functional targets.
Geography Analysis
Asia-Pacific owned 33.87% of global revenue in 2025 and is projected to post a 5.45% CAGR to 2031, the top regional rate. Abundant broken rice, coupled with expanding plant-based meat consumption aligned with Buddhist and Hindu dietary norms, underpins growth. Chinese processors in Hunan and Jiangxi convert low-grade grain into 80% isolates for export. India’s occasional non-basmati export bans have tightened supply, yet domestic demand is climbing as urban consumers seek lactose-free proteins. Japan and South Korea command premium prices for organic, low-arsenic isolates used in infant-formula and cosmetics. The USDA projects ample rice supplies through 2025, supporting the rice protein market even amid policy swings.
North America and Europe together delivered roughly 45% of the 2025 value, buoyed by sports nutrition and plant-based infant formula. The FDA’s arsenic limit concentrates U.S. demand among certified suppliers, raising entry barriers. Europe’s protein landscape is diversifying as BENEO’s EUR 50 million faba-bean plant launched in April 2025 and Ingredion-Lantmännen’s forthcoming pea facility intensify legume-protein competition. Rice-protein suppliers thus differentiate on hypoallergenicity rather than price to retain share.
South America and the Middle East and Africa remain nascent but promising. Brazil’s vegan community is expanding, and the UAE’s food-security initiatives favor local production of plant proteins. Limited milling infrastructure and consumer awareness constrain immediate volumes, yet rising health consciousness could spur uptake post-2028. Across all regions, suppliers that operate dual supply chains commodity concentrates for local food processing and certified isolates for export can hedge against regulatory divergence and price sensitivity.

Competitive Landscape
The rice protein market shows moderate concentration, but leadership has shifted. Axiom Foods Inc., ET Chem, Südzucker AG, The Scoular Company, and Ingredion Incorporated now rank as the five major players, together controlling an estimated 35% to 40% of global isolate capacity. Each leverages vertical integration, proprietary enzymatic extraction, or long-term contracts with infant-formula and sports-nutrition brands. Axiom Foods maintains an edge through sub-50 ppb arsenic guarantees, while ET Chem and Südzucker capitalize on European feedstock security. Scoular extends its U.S. grain-handling network into plant-protein distribution, and Ingredion invests in multi-protein platforms that let customers blend rice with pea or faba bean for tailored functionality.
Second-tier competitors, including Kerry Group, BENEO GmbH, Shafi Gluco Chem, Roquette Frères, and Golden Grain, focus on flavor systems, hydrolysates, and textured formats to carve out niches. Chinese producers such as Shaanxi Fuheng, Wuxi Jinnong, and Rizsource chase commodity concentrate contracts in Asia-Pacific but lack the heavy-metal testing suites demanded by U.S. and EU infant-formula buyers. Technology themes include pH-shift processing for better solubility, enzymatic cascades that boost digestibility, and precision-fermentation peptides that sidestep arsenic risk, an area where several start-ups backed by Südzucker’s venture arm are active.
Regulatory compliance doubles as a moat. The FDA’s 100 ppb arsenic ceiling for infant foods forces suppliers to certify every lot, a cost that squeezes smaller firms. Major players also patent extraction methods that deliver neutral flavor and fine particle size, locking in formulation stickiness with beverage and bar manufacturers. Despite incremental consolidation, the rice protein market remains competitive because new regional mills continue to up-cycle broken rice, and no single company exceeds a 15% share.
Rice Protein Industry Leaders
-
Axiom Foods Inc.
-
ET Chem
-
Südzucker AG
-
The Scoular Company
-
Ingredion Incorporated
- *Disclaimer: Major Players sorted in no particular order

Recent Industry Developments
- January 2025: Axiom Foods launched Oryzatein 2.0 rice protein, a grit-free isolate with heavy-metal content below 50 ppb, aimed at infant-formula and sports-nutrition brands
- May 2022: BENEO, a subsidiary of Südzucker, entered a purchase agreement to acquire 100% of Meatless BV, a producer of functional ingredients. BENEO is expanding its existing product offering with the acquisition to offer an even broader range of texturizing solutions for meat and fish alternatives.


Global Rice Protein Market Report Scope
Concentrates, Isolates, Textured/Hydrolyzed are covered as segments by Form. Food and Beverages, Personal Care and Cosmetics, Supplements are covered as segments by End User. Africa, Asia-Pacific, Europe, Middle East, North America, South America are covered as segments by Region.
By Form
| Concentrates |
| Isolates |
| Textured/Hydrolyzed |
By End-User
| Food and Beverages | Bakery |
| Beverages | |
| Meat/ Poultry/Seafood and Meat Alternative Products | |
| Snacks | |
| Personal Care and Cosmetics | |
| Supplements | Elderly Nutrition and Medical Nutrition |
| Sport/Performance Nutrition |
By Geography
| North America | United States |
| Canada | |
| Mexico | |
| Rest of North America | |
| Europe | Germany |
| United Kingdom | |
| Italy | |
| France | |
| Spain | |
| Netherlands | |
| Russia | |
| Rest of Europe | |
| Asia-Pacific | China |
| India | |
| Japan | |
| Australia | |
| Indonesia | |
| South Korea | |
| Thailand | |
| Singapore | |
| Rest of Asia-Pacific | |
| South America | Brazil |
| Argentina | |
| Rest of South America | |
| Middle East and Africa | South Africa |
| Saudi Arabia | |
| United Arab Emirates | |
| Nigeria | |
| Turkey | |
| Rest of Middle East and Africa |
| By Form | Concentrates | |
| Isolates | ||
| Textured/Hydrolyzed | ||
| By End-User | Food and Beverages | Bakery |
| Beverages | ||
| Meat/ Poultry/Seafood and Meat Alternative Products | ||
| Snacks | ||
| Personal Care and Cosmetics | ||
| Supplements | Elderly Nutrition and Medical Nutrition | |
| Sport/Performance Nutrition | ||
| By Geography | North America | United States |
| Canada | ||
| Mexico | ||
| Rest of North America | ||
| Europe | Germany | |
| United Kingdom | ||
| Italy | ||
| France | ||
| Spain | ||
| Netherlands | ||
| Russia | ||
| Rest of Europe | ||
| Asia-Pacific | China | |
| India | ||
| Japan | ||
| Australia | ||
| Indonesia | ||
| South Korea | ||
| Thailand | ||
| Singapore | ||
| Rest of Asia-Pacific | ||
| South America | Brazil | |
| Argentina | ||
| Rest of South America | ||
| Middle East and Africa | South Africa | |
| Saudi Arabia | ||
| United Arab Emirates | ||
| Nigeria | ||
| Turkey | ||
| Rest of Middle East and Africa | ||


Market Definition
- End User - The Protein Ingredients Market operates on a B2B basis. Food, Beverages, Supplements, Animal Feed, and Personal Care & Cosmetic manufacturers are considered to be end-consumers in the market studied. The scope excludes manufacturers buying liquid/dry whey to be used for application as a binding agent or thickener or other non-protein applications.
- Penetration Rate - Penetration Rate is defined as the percentage of Protein-Fortified End User Market Volume in the Overall End User Market Volume.
- Average Protein Content - Average protein content is the average protein content present per 100 g of product manufactured by all end-user companies considered under the scope of this report.
- End User Market Volume - End-user market volume is the consolidated volume of all types and forms of end-user products in the country or region.
| Keyword | Definition |
|---|---|
| Alpha-lactalbumin (α-Lactalbumin) | It is a protein that regulates the production of lactose in the milk of almost all mammalian species. |
| Amino acid | It is an organic compound that contains both amino and carboxylic acid functional groups, which are required for the synthesis of body protein and other important nitrogen-containing compounds, such as creatine, peptide hormones, and some neurotransmitters. |
| Blanching | It is the process of briefly heating vegetables with steam or boiling water. |
| BRC | British Retail Consortium |
| Bread improver | It is a flour-based blend of several components with specific functional properties designed to modify dough characteristics and give quality attributes to bread. |
| BSF | Black Soldier Fly |
| Caseinate | It is a substance produced by adding an alkali to acid casein, a derivative of casein. |
| Celiac disease | Celiac disease is an immune reaction to eating gluten, a protein found in wheat, barley, and rye. |
| Colostrum | It is a milky fluid that’s released by mammals that have recently given birth before breast milk production begins. |
| Concentrate | It is the least processed form of protein and has a protein content ranging from 40-90% by weight. |
| Dry protein basis | It refers to the percentage of "pure protein" present in a supplement after the water in it is completely removed through heat. |
| Dry whey | It is the product resulting from drying fresh whey which has been pasteurized and to which nothing has been added as a preservative. |
| Egg protein | It is a mixture of individual proteins, including ovalbumin, ovomucoid, ovoglobulin, conalbumin, vitellin, and vitellenin. |
| Emulsifier | It is a food additive that facilitates the blending of foods that are immiscible with one another, such as oil and water. |
| Enrichment | It is the process of addition of micronutrients that are lost during the processing of the product. |
| ERS | Economic Research Service of the USDA |
| Extrusion | It is the process of forcing soft mixed ingredients through an opening in a perforated plate or die designed to produce the required shape. The extruded food is then cut to a specific size by blades. |
| Fava | Also known as Faba, it is another word for yellow split beans. |
| FDA | Food and Drug Administration |
| Flaking | It is a process in which typically a cereal grain (like corn, wheat, or rice) is broken down into grits, cooked with flavors and syrups, and then pressed into flakes between cooled rollers. |
| Foaming agent | It is a food ingredient that makes it possible to form or maintain a uniform dispersion of a gaseous phase in a liquid or solid food. |
| Foodservice | It refers to the part of the food industry which includes businesses, institutions, and companies which prepare meals outside the home. It includes restaurants, school and hospital cafeterias, catering operations, and many other formats. |
| Fortification | It is the deliberate addition of micronutrients that are not found in them naturally or which are lost during processing, to improve a food product's nutritional value. |
| FSANZ | Food Standards Australia New Zealand |
| FSIS | Food Safety and Inspection Service |
| FSSAI | Food Safety and Standards Authority of India |
| Gelling agent | It is an ingredient that functions as a stabilizer and thickener to provide thickening without stiffness through the formation of gel. |
| GHG | Greenhouse Gas |
| Gluten | It is a family of proteins found in grains, including wheat, rye, spelt, and barley. |
| Hemp | It is a botanical class of Cannabis sativa cultivars grown specifically for industrial or medicinal use. |
| Hydrolysate | It is a form of protein manufactured by exposing the protein to enzymes that can partially break the bonds between the protein's amino acids and break down large, complicated proteins into smaller pieces. Its processing makes it easier and quicker to digest. |
| Hypoallergenic | It refers to a substance that causes fewer allergic reactions. |
| Isolate | It is the purest and most processed form of protein which has undergone separation to obtain a pure protein fraction. It typically contains ≥ 90% of protein by weight. |
| Keratin | It is a protein that helps form hair, nails, and the outer layer of skin. |
| Lactalbumin | It is the albumin contained in milk and obtained from whey. |
| Lactoferrin | It is an iron‑binding glycoprotein that is present in the milk of most mammals. |
| Lupin | It is the yellow legume seeds of the genus Lupinus. |
| Millenial | Also known as Generation Y or Gen Y, it refers to the people born from 1981 to 1996. |
| Monogastric | It refers to an animal with a single-compartmented stomach. Examples of monogastric include humans, poultry, pigs, horses, rabbits, dogs, and cats. Most monogastric are generally unable to digest much cellulose food materials such as grasses. |
| MPC | Milk protein concentrate |
| MPI | Milk protein isolate |
| MSPI | Methylated soy protein isolate |
| Mycoprotein | Mycoprotein is a form of single-cell protein, also known as fungal protein, derived from fungi for human consumption. |
| Nutricosmetics | It is a category of products and ingredients that act as nutritional supplements to care for skin, nails, and hair natural beauty. |
| Osteoporosis | It is a medical condition in which the bones become brittle and fragile from loss of tissue, typically as a result of hormonal changes, or deficiency of calcium or vitamin D. |
| PDCAAS | Protein digestibility-corrected amino acid score (PDCAAS) is a method of evaluating the quality of a protein based on both the amino acid requirements of humans and their ability to digest it. |
| Per-capita consumption of animal protein | It is the average amount of animal protein (such as milk, whey, gelatin, collagen, and egg proteins) that is readily available for consumption by each person in an actual population. |
| Per-capita consumption of plant protein | It is the average amount of plant protein (such as soy, wheat, pea, oat, and hemp proteins) that is readily available for consumption by each person in an actual population. |
| Quorn | It is a microbial protein manufactured using mycoprotein as an ingredient, in which the fungus culture is dried and mixed with egg albumen or potato protein, which acts as a binder, and then is adjusted in texture and pressed into various forms. |
| Ready-to-Cook (RTC) | It refers to food products that include all of the ingredients, where some preparation or cooking is required through a process that is given on the package. |
| Ready-to-Eat (RTE) | It refers to a food product prepared or cooked in advance, with no further cooking or preparation required before being eaten. |
| RTD | Ready-to-Drink |
| RTS | Ready-to-Serve |
| Saturated fat | It is a type of fat in which the fatty acid chains have all single bonds. It is generally considered unhealthy. |
| Sausage | It is a meat product made of finely chopped and seasoned meat, which may be fresh, smoked, or pickled and which is then usually stuffed into a casing. |
| Seitan | It is a plant-based meat substitute made out of wheat gluten. |
| Softgel | It is a gelatin-based capsule with a liquid fill. |
| SPC | Soy protein concentrate |
| SPI | Soy protein isolate |
| Spirulina | It is a biomass of cyanobacteria that can be consumed by humans and animals. |
| Stabilizer | It is an ingredient added to food products to help maintain or enhance their original texture, and physical and chemical characteristics. |
| Supplementation | It is the consumption or provision of concentrated sources of nutrients or other substances that are intended to supplement nutrients in the diet and is intended to correct nutritional deficiencies. |
| Texturant | It is a specific type of food ingredient that is used to control and alter the mouthfeel and texture of food and beverage products. |
| Thickener | It is an ingredient that is used to increase the viscosity of a liquid or dough and make it thicker, without substantially changing its other properties. |
| Trans fat | Also called trans-unsaturated fatty acids or trans fatty acids, it is a type of unsaturated fat that naturally occurs in small amounts in meat. |
| TSP | Textured soy protein |
| TVP | Textured vegetable protein |
| WPC | Whey protein concentrate |
| WPI | Whey protein isolate |


Research Methodology
Mordor Intelligence follows a four-step methodology in all our reports.
- Step-1: Identify Key Variables: The quantifiable key variables (industry and extraneous) pertaining to the specific product segment and country are selected from a group of relevant variables & factors based on desk research & literature review; along with primary expert inputs. These variables are further confirmed through regression modeling (wherever required).
- Step-2: Build a Market Model: In order to build a robust forecasting methodology, the variables and factors identified in Step-1 are tested against available historical market numbers. Through an iterative process, the variables required for market forecast are set and the model is built on the basis of these variables.
- Step-3: Validate and Finalize: In this important step, all market numbers, variables and analyst calls are validated through an extensive network of primary research experts from the market studied. The respondents are selected across levels and functions to generate a holistic picture of the market studied.
- Step-4: Research Outputs: Syndicated Reports, Custom Consulting Assignments, Databases & Subscription Platforms


