United States Pet Care And Services Market Size and Share
Market Overview
| Study Period | 2020 - 2031 |
|---|---|
| Forecast Data Period | 2026 - 2031 |
| Historical Data Period | 2020 - 2024 |
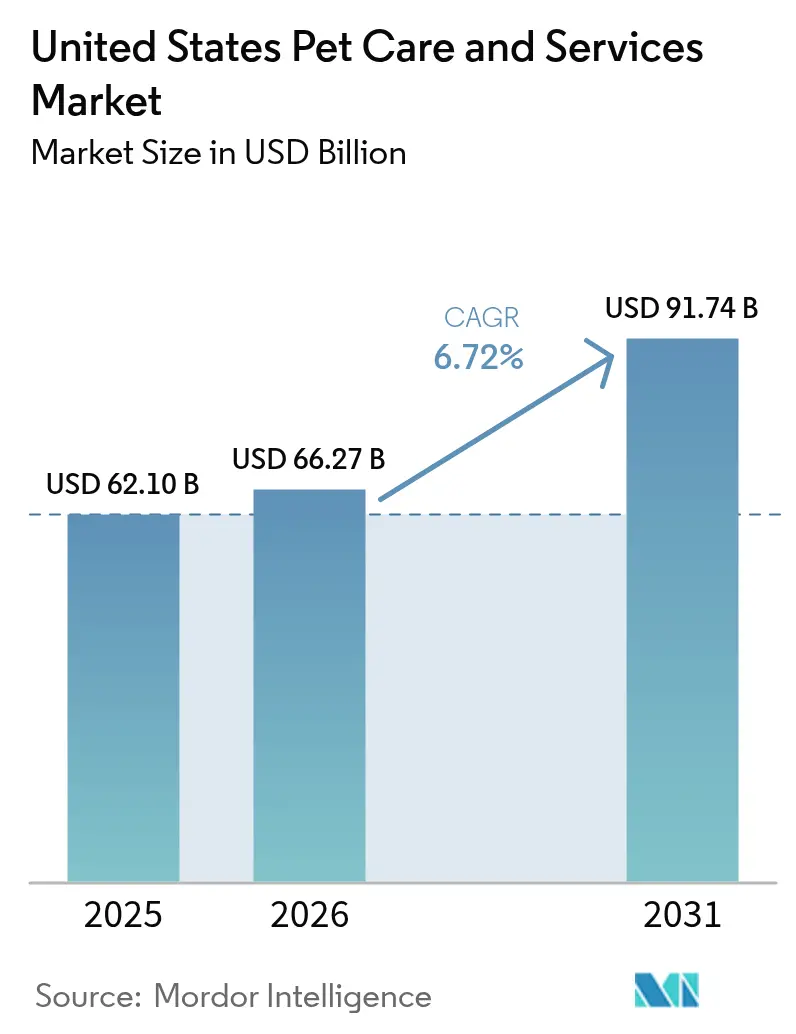
| Base Year Market Size (2025) | USD 62.1 Billion |
| Market Size (2026) | USD 66.27 Billion |
| Market Size (2031) | USD 91.74 Billion |
| Growth Rate (2026 - 2031) | 6.72% CAGR |
Major Players*Disclaimer: Major Players sorted in no particular order Image © Mordor Intelligence. Reuse requires attribution under CC BY 4.0. | |
United States Pet Care And Services Market Analysis by Mordor Intelligence
The United States pet care and services market size is expected to grow from USD 62.1 billion in 2025 to USD 66.27 billion in 2026 and is forecast to reach USD 91.74 billion by 2031 at 6.72% CAGR over 2026-2031. Sustained premium spending, pet humanization, and rapid digital adoption underpin the expansion of the United States pet care and services market as 94 million households now own pets. Heightened corporate consolidation, employer-sponsored pet benefits, and AI-enabled tele-health broaden revenue streams while stabilizing margins in the United States pet care and services market. Premium product innovation, especially fresh and functional nutrition, deepens customer loyalty, whereas rising veterinary-cost inflation compels greater reliance on insurance. Intensifying competition from e-commerce titans, coupled with subscription models, shifts value toward data-rich, direct-to-consumer relationships that reinforce lifetime customer value in the United States pet care and services market.
Key Report Takeaways
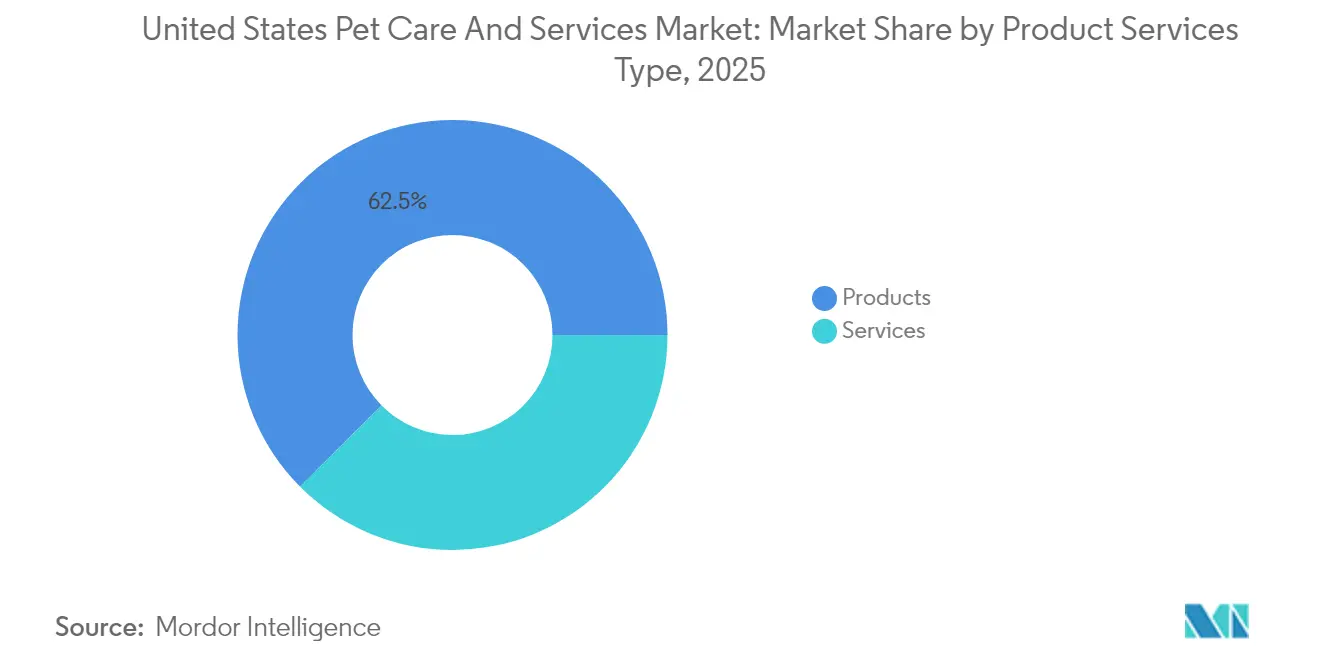
By product category, pet products commanded 63.20% revenue share in 2024; services are forecast to expand at a 7.12% CAGR to 2030.
By pet type, dogs held 63.78% of the United States pet care and services market share in 2024, while cats post the highest projected CAGR at 7.46% through 2030.
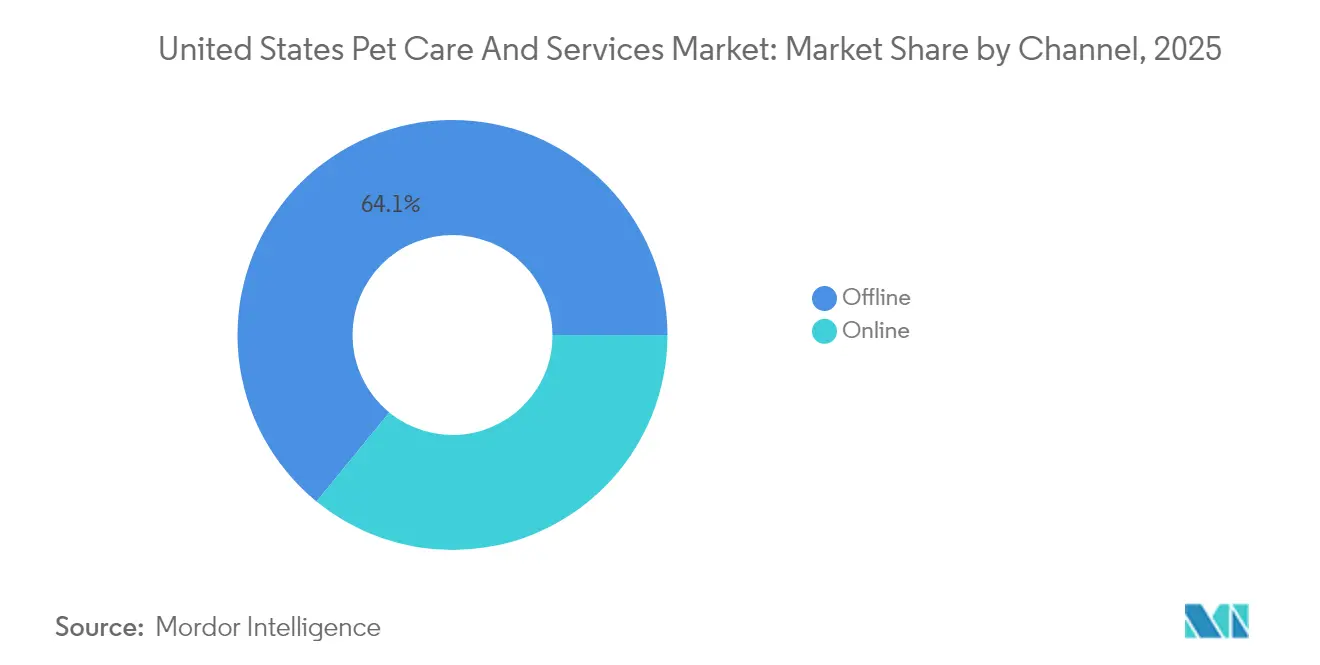
By channel, offline retail captured 64.82% share of the United States pet care and services market size in 2024 and online channels are advancing at a 7.94% CAGR through 2030.
Note: Market size and forecast figures in this report are generated using Mordor Intelligence’s proprietary estimation framework, updated with the latest available data and insights as of 2026.
United States Pet Care And Services Market Trends and Insights
Drivers Impact Analysis*
| Driver | (~) % Impact on CAGR Forecast | Geographic Relevance | Impact Timeline |
|---|---|---|---|
| Rising pet humanization & service premiumization | +1.8% | National, strongest in urban centers | Long term (≥ 4 years) |
| Expanding pet-insurance coverage & awareness | +1.2% | National, led by California, New York, Florida | Medium term (2-4 years) |
| Surge in e-commerce & subscription models for pet services | +1.5% | National, accelerated in tech-forward states | Short term (≤ 2 years) |
| Growing investment in AI-enabled veterinary tele-health | +0.9% | National, concentrated in metropolitan areas | Medium term (2-4 years) |
| Employer-sponsored "paw-ternity" & pet-benefit programs | +0.6% | National, pioneered by tech companies | Long term (≥ 4 years) |
| Pet-friendly real-estate boosting daycare/walking demand | +0.8% | Urban markets, strongest in West Coast | Medium term (2-4 years) |
| Source: Mordor Intelligence | |||
Rising Pet Humanization & Service Premiumization
Average monthly pet spend reached USD 318 in 2024 as owners equate animal wellness with household wellbeing. Demand for advanced diagnostics mirrors human healthcare, with 67% of owners ready to pay more for perceived health benefits. These dynamics reinforce premium-price elasticity across veterinary, grooming, and boarding subcategories in the United States pet care and services market.
Expanding Pet-Insurance Coverage & Awareness
Premiums exceeded USD 4 billion in 2024, yet only 4% of pets are insured, signaling vast headroom. Standardization under the 2024 NAIC Model Act in 14 states heightens transparency and consumer trust. Employer sponsorship accelerates uptake as 32% of owners would switch jobs for pet coverage. However, rising loss ratios tied to veterinary-service inflation strain carrier profitability, prompting selective policy exits that may temper short-term growth in the United States pet care and services market.
Surge in E-commerce & Subscription Models
E-commerce captured 36% of pet product volume in 2025, doubling its 2017 share. Autoship now represents 75% of Chewy sales, while direct-to-consumer pet food reached USD 2.1 billion in 2024 with a 25.1% CAGR outlook. Amazon’s logistics edge intensifies pressure on specialty retailers to integrate same-day delivery and membership perks, reshaping channel economics across the United States pet care and services market.
Growing Investment in AI-Enabled Veterinary Tele-health
Roughly 40% of U.S. veterinarians deploy AI tools for diagnostics, and the tele-health segment is forecast to balloon from USD 369 million in 2025 to USD 1.96 billion by 2034. Zoetis’ 32,000 sq ft reference lab in Louisville illustrates corporate commitment to scalable, data-driven care. AI reduces burnout costs estimated at USD 2 billion annually, but capital intensity and data-standardization barriers favor large consolidators over independents.
Restraints Impact Analysis*
| Restraint | (~) % Impact on CAGR Forecast | Geographic Relevance | Impact Timeline |
|---|---|---|---|
| Escalating veterinary-service inflation | -1.4% | National, acute in metropolitan areas | Short term (≤ 2 years) |
| Veterinary-workforce shortage & burnout | -1.1% | National, severe in rural areas | Medium term (2-4 years) |
| High-premium cancellations in pet-insurance segment | -0.7% | National, concentrated in price-sensitive demographics | Short term (≤ 2 years) |
| Data-privacy concerns in connected pet devices | -0.4% | National, heightened in privacy-conscious states | Long term (≥ 4 years) |
| Source: Mordor Intelligence | |||
Escalating Veterinary-Service Inflation
Service prices have outpaced general inflation by 60% since 2005 and rose 8% year-over-year to August 2024. Cost drivers include labor shortages, high-tech equipment, and local monopoly pricing. Veterinary visits fell 3% in 2023, indicating income sensitivity and potential deferred care consequences. Regulatory scrutiny of consolidation is nascent, but rising political attention could reshape pricing power in the United States pet care and services market.
Veterinary-Workforce Shortage & Burnout
Despite adequate graduate supply, high debt burdens (USD 200,000+) and mental-health stress create functional staff shortages. Up to 75% of pets may lack necessary care by 2030, reinforcing tele-health and mid-level practitioner models as partial solutions. Technician enrollment decline undermines clinic efficiency, widening rural care gaps that impede equitable growth of the United States pet care and services market.
*Our forecasts treat driver/restraint impacts as directional, not additive. The impact forecasts reflect baseline growth, mix effects, and variable interactions.
Segment Analysis
By Product and Service Type: Services Propel Growth
Service revenues accelerate at a 6.98% CAGR even as products retain 62.45% of 2025 revenue, underscoring a clear shift toward experiential spending within the United States pet care and services market. Veterinary care sits atop the service hierarchy, supported by a USD 66 billion subsector, while pet-insurance premiums of USD 4.5 billion in 2025 mark the fastest momentum. Subscription bundles blur product–service lines, locking in cash flow and raising lifetime value. Dietary supplements and veterinary diets outpace staple kibble margins, while the PURR Act could cut multistate compliance costs and speed product launches.
Services already account for 37.55% of the United States pet care and services market size, and their share is projected to exceed 40% by 2031 as insurance, tele-health, and in-store clinics deepen penetration. Product makers respond with premium upgrades—fresh, functional, and single-serve meals—that command higher price points without cannibalizing volume. Cross-selling between preventive-care plans and tailored nutrition boosts retention, while bundled loyalty programs temper switching. Together, these moves tighten the ecosystem around each household, raising barriers for late-stage challengers.


By Pet Type: Cats Capture Incremental Spend
Dogs comprised 63.42% of U.S. pets in 2025, yet cats post the strongest 7.11% CAGR as affordability and low-maintenance appeal fit urban life. Cat-food volume grew 2% in 2025 while dog-food volume slipped 2%. Premium cat nutrition already tops USD 5 billion and could hit USD 6 billion by 2028. Multi-pet households climbed to 24%, opening cross-category bundling for insurers and retailers. Other companion animals—birds, reptiles, small mammals—maintain niche stability, underpinned by specialized diets and higher per-unit veterinary spend.
Cats currently generate 29.35% of the United States pet care and services market share yet absorb 34% of premium-food outlays, proving an outsized revenue engine. Litter, scratch-furniture, and interactive-toy sales extend wallet share, while tele-health consults for feline chronic disease create service upsell paths. Brands leverage species-specific nutrition research to justify premium pricing, and insurers court cat owners with lower accident-frequency risk pools. As apartment living rises, this segment is poised to deliver sustained incremental growth.
By Service Channel: Omnichannel Maturity
Offline outlets held 64.10% of 2025 revenue, but their grip loosens as online channels expand at a 7.55% CAGR, steadily enlarging the United States pet care and services market size for e-commerce. Mass merchandisers capture 35% of brick-and-mortar sales, while specialty stores protect share through on-site clinics and grooming. Amazon’s logistics scale pressures rivals to match next-day fulfillment or pivot to experiential value. Subscription autoship already fuels 75% of Chewy sales, illustrating sticky digital behavior.
Mobile shopping, social-media discovery, and buy-online-pick-up-in-store integrate channels, forcing retailers into data-driven personalization. State-level privacy laws demand transparent data handling, favoring large players with compliance scale. Physical stores respond with appointment-based services and community events, converting foot traffic into higher-margin interactions and reinforcing omnichannel loyalty.
Geography Analysis
Spending is uneven across regions, with West Coast households shelling out USD 276 more annually than the national average. California, Texas, and Florida together represent 29% of national pet-care sales measured by retail scanner data. Higher disposable income and dense urban centers in these states sustain premium-service uptake, from daycare subscriptions to AI-enabled veterinary clinics. Midwest markets trail on per-pet outlays but post the fastest regional volume growth as population migration boosts household formation.
Insurance penetration illustrates geographic divergence, averaging 6% of pets in California, New York, and Florida versus 2% in the South-Central region. Veterinary-clinic density peaks in the Northeast at 4.3 practices per 10,000 pets, compared with 2.1 in rural Plains states, encouraging tele-health startups to target underserved counties. Regional clinic shortages also inflate price dispersion, with metropolitan New York exam fees running 38% above the national mean. Corporate groups expand fastest in Sun Belt states where new-build real estate is cheaper and regulatory approval timelines are shorter.
Urbanization drives service revenue, as 71% of U.S. households in high-density ZIP codes purchase at least one premium pet service annually. Suburban owners prioritize convenience, fueling curbside pickup and same-day delivery that strengthen omnichannel loyalty programs. Rural consumers rely on mobile veterinary vans that now operate in 42 states, bridging access gaps and generating cross-sell opportunities for nutritional products. Federal infrastructure grants earmarked for broadband expansion are expected to widen tele-medicine reach, boosting the United States pet care and services market share for digital channels.
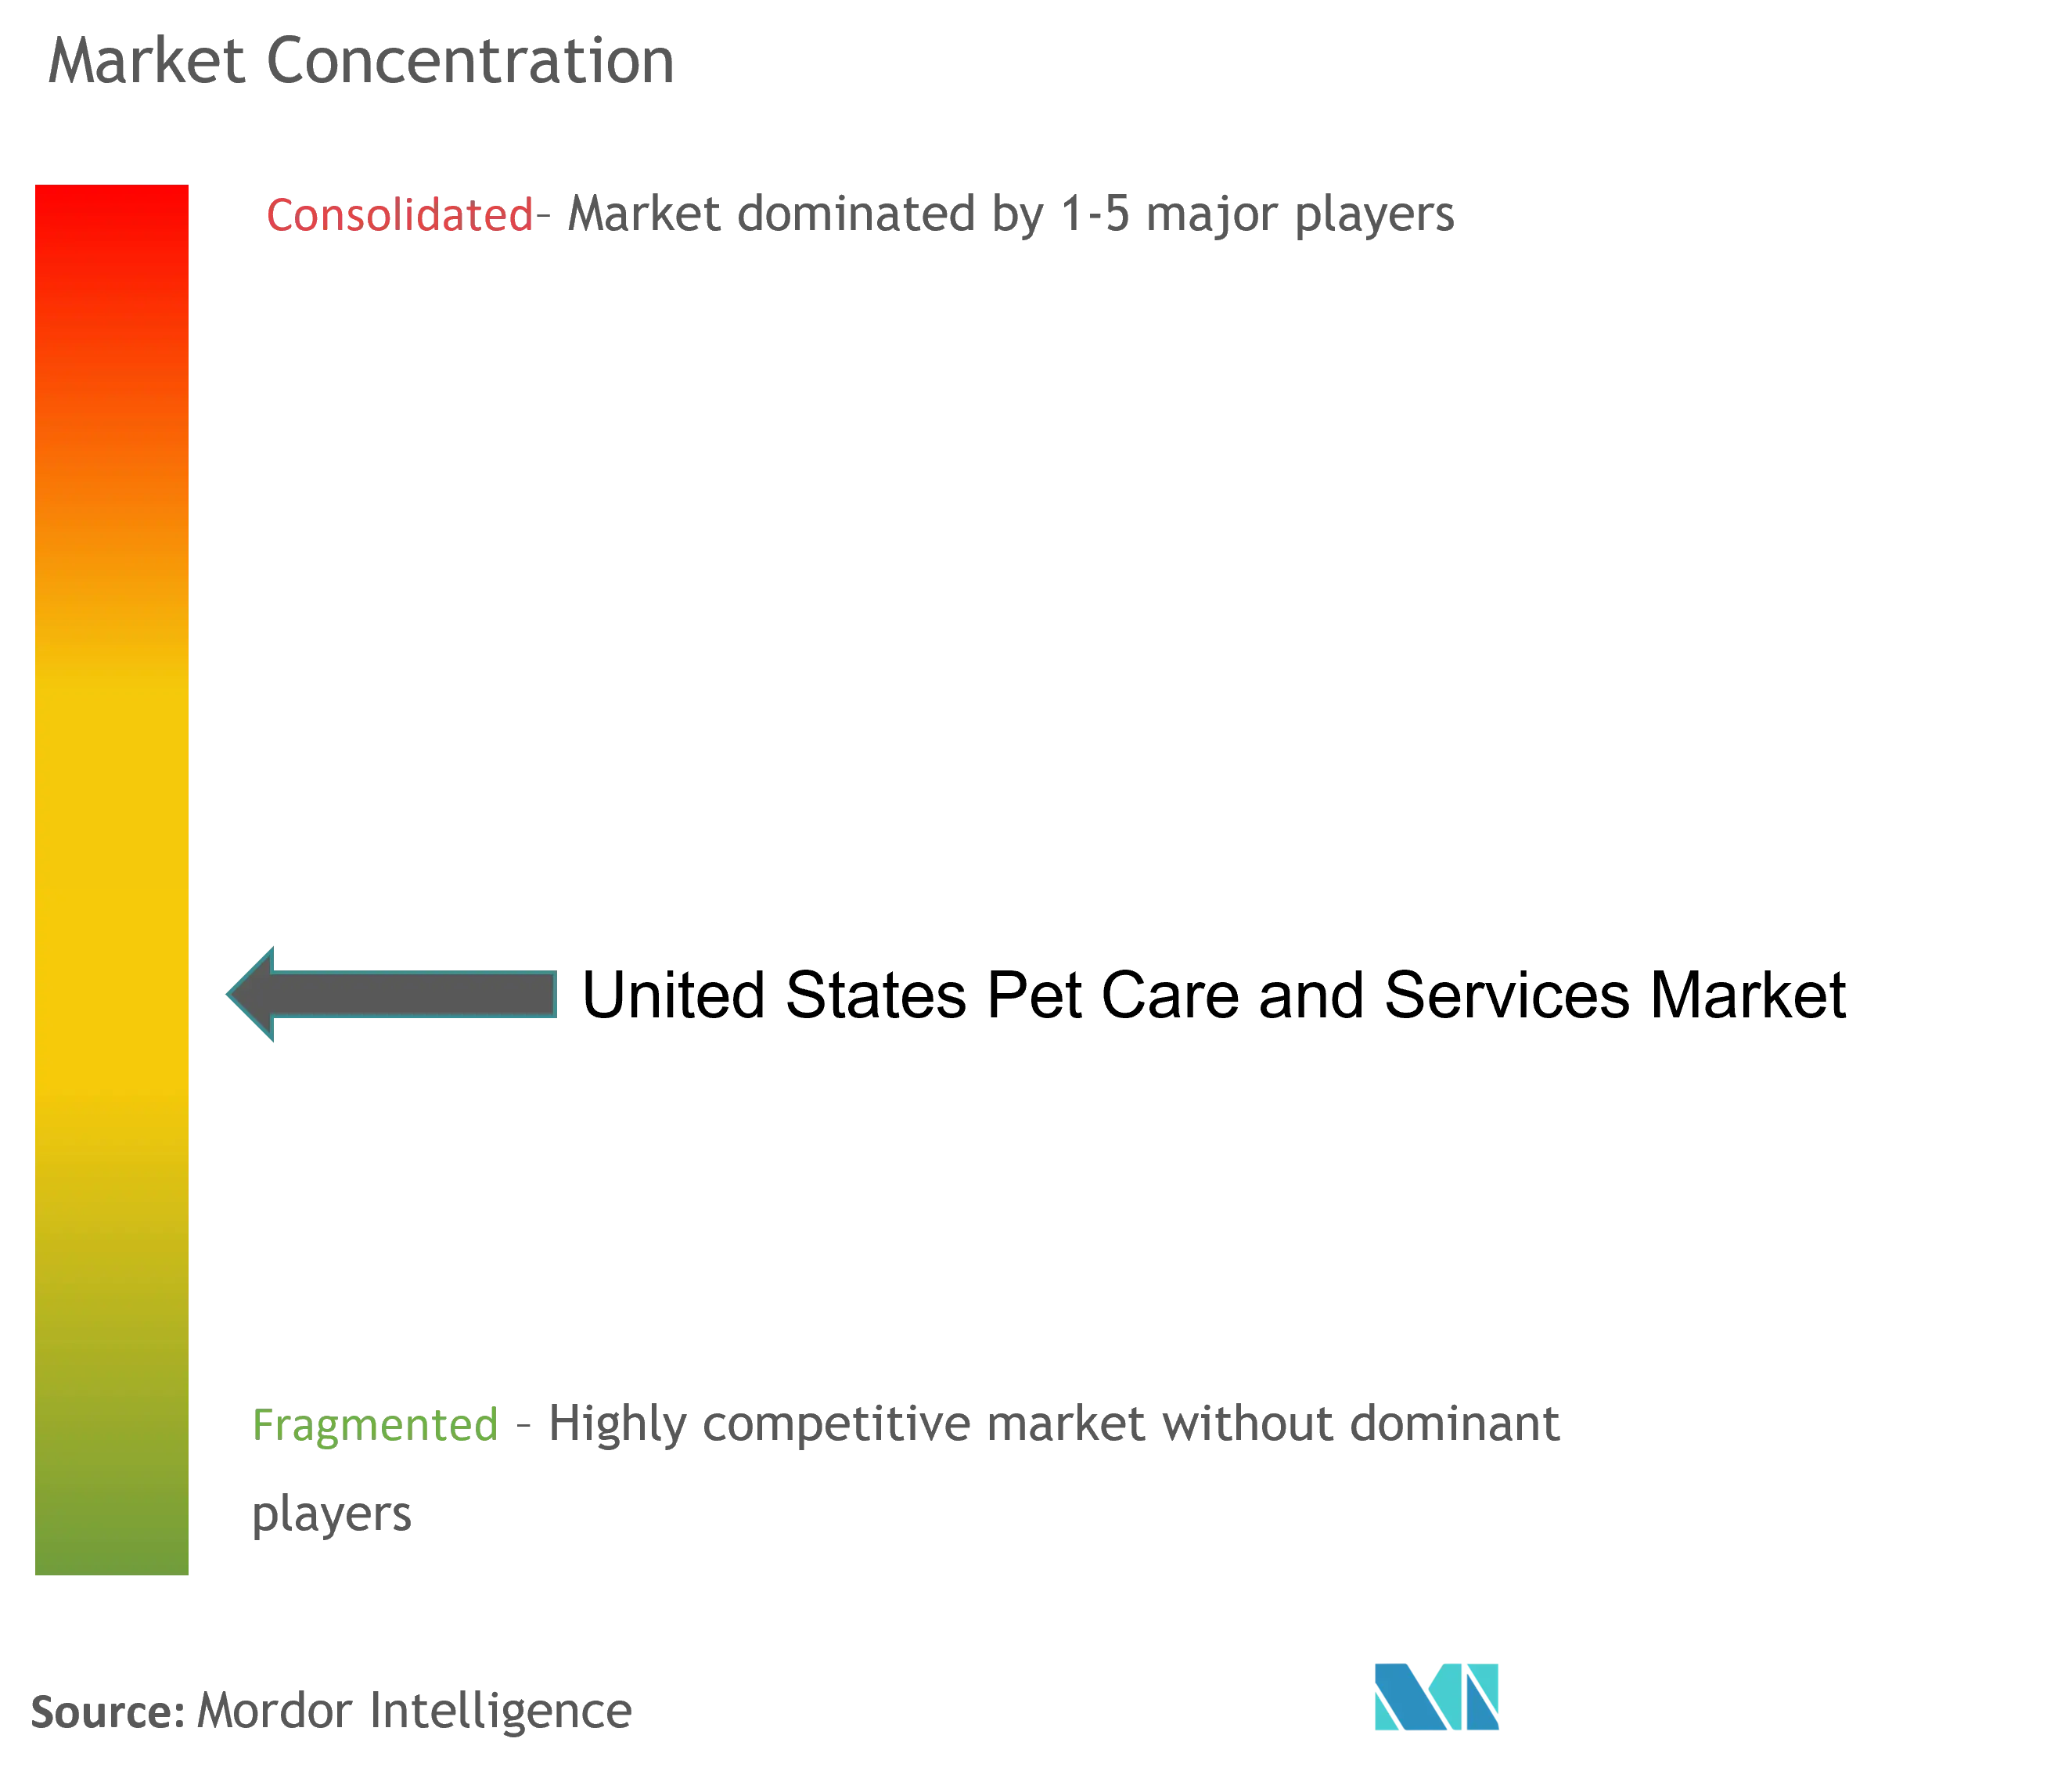
Competitive Landscape
Corporate groups employ 35% of U.S. small-animal veterinarians; Mars Petcare alone runs 2,300 clinics and employs 14,000+ doctors. The top 10 insurers write 90% of premiums, concentrating risk pricing power. Chewy’s push into veterinary software pursues the USD 11.5 billion medical opportunity, while Tractor Supply’s pharmacy acquisition enhances omnichannel reach. Mars’ USD 2 billion manufacturing pledge and diagnostics acquisitions exemplify scale-driven integration. Regulatory attention on antitrust in veterinary medicine may temper M&A pace but is unlikely to derail technology-driven disruptors in the United States pet care and services market.
United States Pet Care And Services Industry Leaders
PetSmart LLC
Mars, Incorporated
ViaGen LC
Nestlé S.A
Hill's Pet Nutrition, Inc.
- *Disclaimer: Major Players sorted in no particular order

Recent Industry Developments
- July 2025: Mars to invest USD 2 billion in new U.S. pet-food facilities
- May 2025: Zoetis opens 32,000 sq ft Louisville diagnostics lab
- December 2024: General Mills acquires Whitebridge Pet Brands for USD 1.45 billion


United States Pet Care And Services Market Report Scope
As per the scope of the report, the pet care and services market depicts a detailed analysis of products and services used in food and safety, nourishment, exercise, and medical attention. It includes services such as vaccination, pet sitting, pet grooming, pet feeding, pet training, and others. The United States Pet Care and Services Market is segmented by pet type (cat, dog, horse, and other animals), product type (pet food, grooming products, and pet care (oral care, dietary supplements, and veterinary diets), and service type (grooming, pet transportation, pet boarding, pet sitting, pet walking, and other services).
The report offers the value (in USD) for the above segments.


Key Questions Answered in the Report
How large is the United States pet care and services market in 2026?
The market size stands at USD 66.27 billion in 2026 with a 6.72% CAGR outlook to 2031.
Which segment grows fastest through 2031?
Services, led by insurance, grooming, and daycare, are forecast to grow 6.98% annually.
Why is cat ownership accelerating?
Cats align with urban, cost-conscious lifestyles, boosting their forecast 7.11% CAGR and fueling premium cat-food demand.
What role does e-commerce play in pet spending?
Online channels cover 36% of product volume, and subscription models secure 75% of Chewys revenue, underscoring digital dominance.
How is technology reshaping veterinary care?
About 40% of veterinarians deploy AI tools, and tele-health revenue could quintuple by 2034, reducing burnout and expanding access.
Are veterinary costs expected to ease soon?
Inflationary pressures remain high; insurance uptake and regulatory scrutiny may help, but meaningful relief is unlikely in the near term.
Page last updated on:


