Market Overview
| Study Period | 2021 - 2031 |
|---|---|
| Forecast Data Period | 2026 - 2031 |
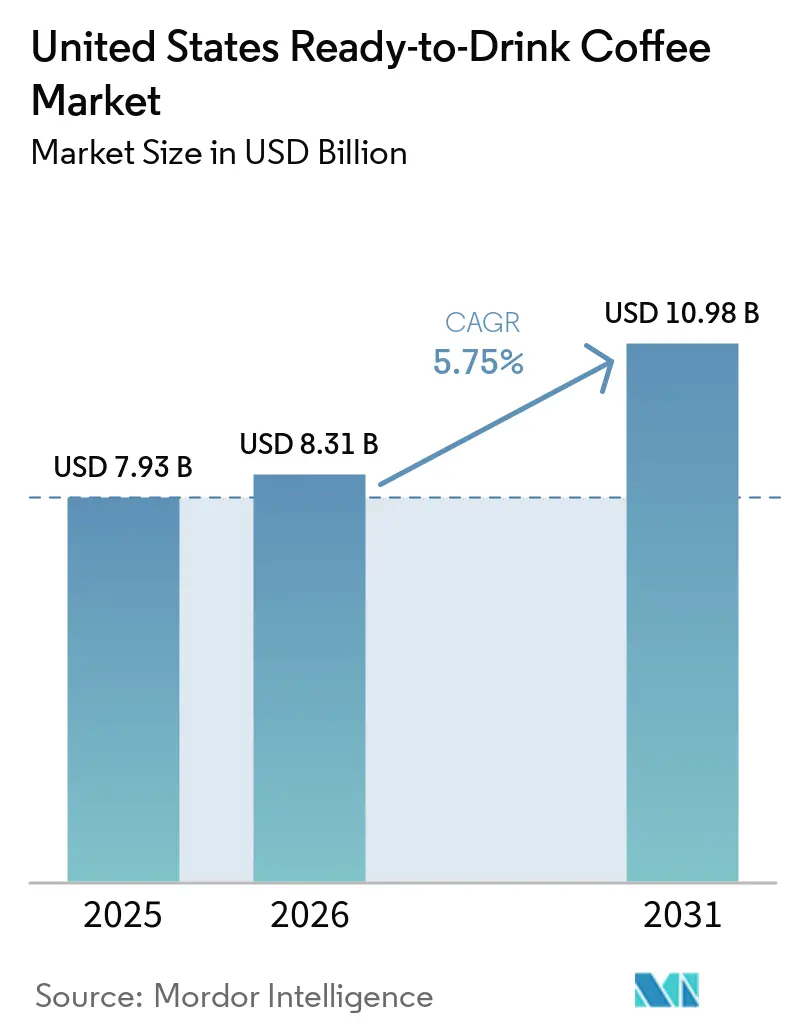
| Base Year Market Size (2025) | USD 7.93 Billion |
| Market Size (2026) | USD 8.31 Billion |
| Market Size (2031) | USD 10.98 Billion |
| Growth Rate (2026 - 2031) | 5.75% CAGR |
| Market Concentration | High |
Major Players
*Disclaimer: Major Players sorted in no particular order Image © Mordor Intelligence. Reuse requires attribution under CC BY 4.0. |
|
United States Ready-to-Drink Coffee Market Analysis by Mordor Intelligence
The United States ready-to-drink Coffee Market size is expected to grow from USD 7.93 billion in 2025 to USD 8.31 billion in 2026 and is forecast to reach USD 10.98 billion by 2031 at 5.75% compound annual growth rate (CAGR) over 2026-2031. This growth is fueled by the combination of convenience, premium flavor profiles, and functional nutrition, which are redefining coffee as a performance-oriented beverage. Cold brew technology has expanded from specialty cafés to mainstream retail shelves, while energy-infused formulations now account for 38.01% of functionality-based value. Additionally, plant-based ingredients have become a significant preference among Generation Z (Gen Z) and millennial consumers. Fluctuations in commodity prices have encouraged vertical integration, and regulations from the United States Food and Drug Administration (FDA) on "healthy" claims have driven low-sugar reformulations and greater transparency in labeling. The market remains highly competitive, with brands that successfully combine functionality and sustainability earning consumer loyalty in an increasingly omnichannel environment.
Key Report Takeaways
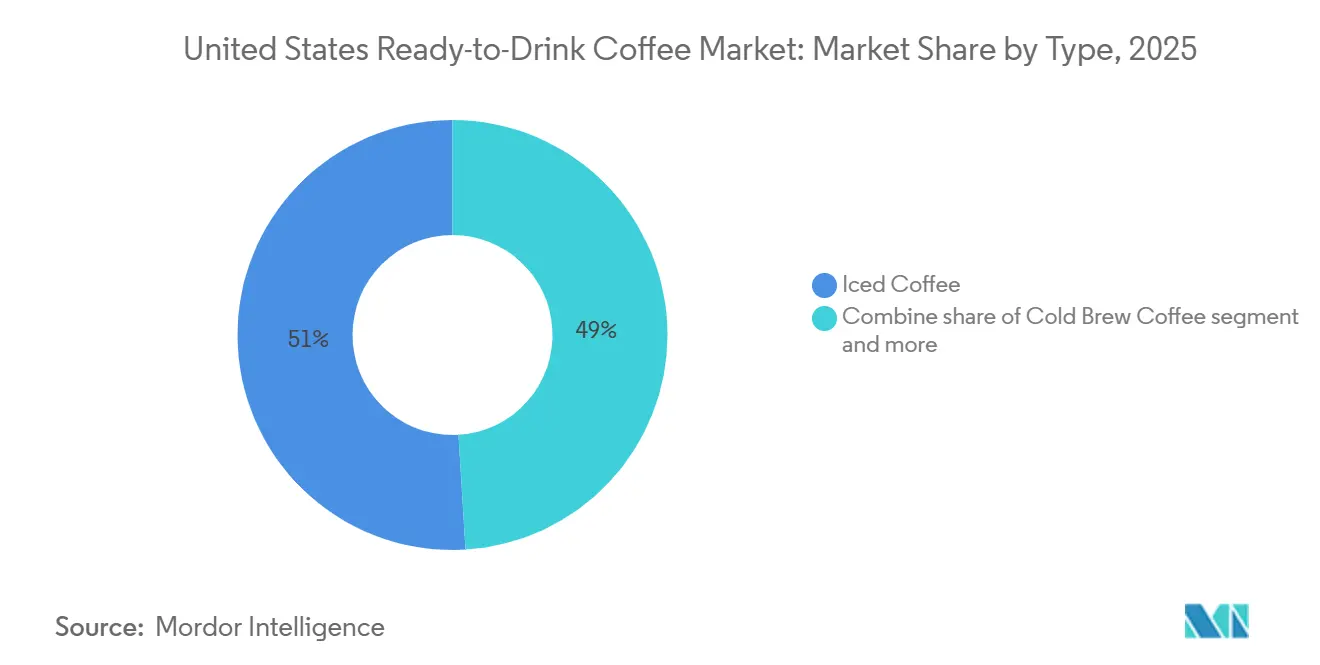
- By type, iced coffee led with 50.96% of the United States ready to drink coffee market share in 2025, while cold brew is forecast to grow at a 6.71% CAGR through 2031.
- By packaging, PET bottles commanded 35.82% of the United States ready to drink coffee market size in 2025 and are advancing at a 6.50% CAGR.
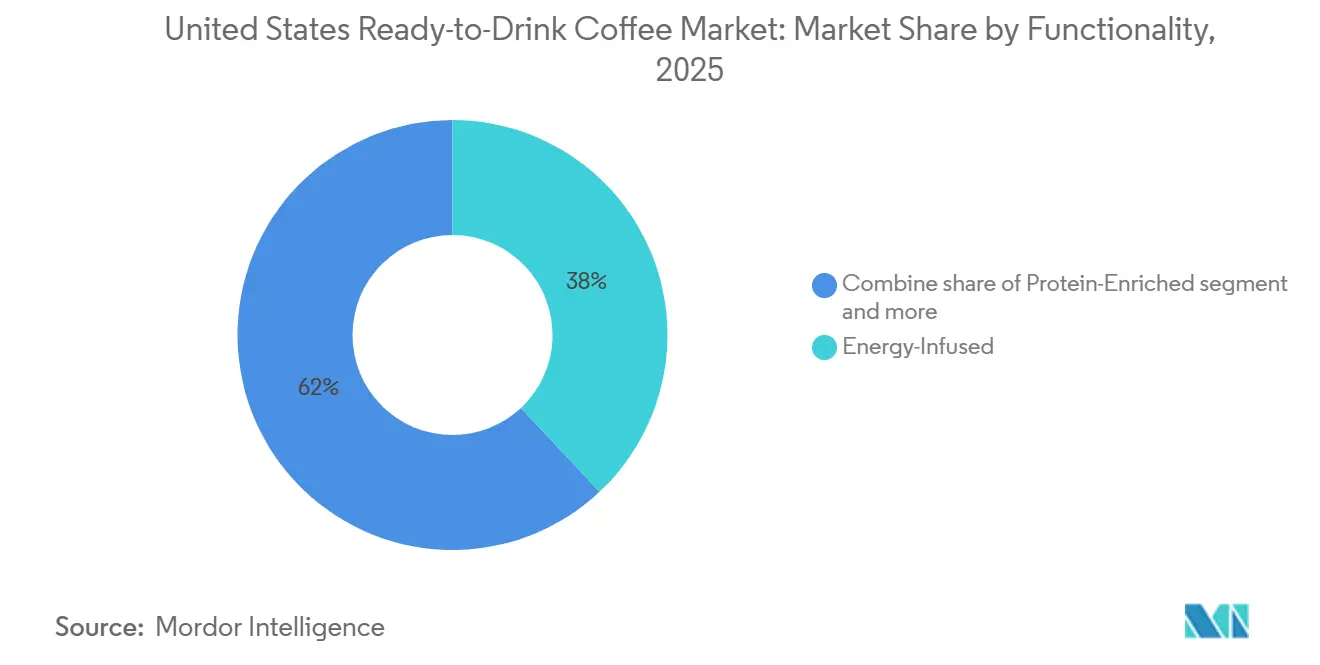
- By functionality, energy-infused formulations held 38.01% of sales in 2025 and are projected to expand at a 6.56% CAGR to 2031.
- By distribution, off-trade channels accounted for 66.71% of revenue in 2025 and are growing at a 6.53% CAGR, underscoring the power of supermarkets, convenience stores, and e-commerce.
Note: Market size and forecast figures in this report are generated using Mordor Intelligence’s proprietary estimation framework, updated with the latest available data and insights as of January 2026.
United States Ready-to-Drink Coffee Market Trends and Insights
Drivers Impact Analysis*
| Driver | (~) % Impact on CAGR Forecast | Geographic Relevance | Impact Timeline |
|---|---|---|---|
| Rising adoption of grab-and-go coffee culture among Gen Z and millennial consumers | +1.2% | National, with concentration in urban centers and college towns | Medium term (2-4 years) |
| Increasing health consciousness and demand for low-sugar and functional RTD coffee | +1.0% | National, strongest in West Coast and Northeast metropolitan areas | Long term (≥ 4 years) |
| Growing demand for plant-based and dairy-free RTD coffee formulations | +0.8% | National, with early adoption in California, Oregon, and Washington | Medium term (2-4 years) |
| Flavor diversification and premiumization supporting consumer preference for unique taste experiences | +0.7% | National, with premium segments concentrated in high-income urban markets | Long term (≥ 4 years) |
| Robust e-commerce and online delivery channel growth enhancing product accessibility and convenience | +0.9% | National, accelerated in suburban and rural areas with limited retail density | Short term (≤ 2 years) |
| Integration of functional ingredients such as adaptogens, nootropics, and plant-based proteins | +0.6% | National, with early traction in wellness-focused coastal markets | Medium term (2-4 years) |
| Source: Mordor Intelligence | |||


Rising adoption of grab-and-go coffee culture among Gen Z and millennial consumers
Generation Z and millennial consumers together make up over 50% of ready-to-drink (RTD) coffee purchases, driven by lifestyle choices that prioritize convenience and portability over traditional café visits. The National Coffee Association's 2024 National Coffee Data Trends report highlighted that 63% of consumers aged 18 to 34 purchased RTD coffee at least once per week, reflecting a 12 percentage-point increase since 2020 [1]Source: National Coffee Association, “2024 National Coffee Data Trends,” ncausa.org. This shift is further influenced by urbanization and longer commute times, which compress morning routines and increase the demand for shelf-stable, single-serve options. Starbucks responded to this trend by partnering with Gopuff in 2024 to offer 15-minute delivery of its bottled Frappuccino and cold brew products across 650 U.S. cities, directly addressing the immediacy expectations of younger consumers. Furthermore, the grab-and-go segment benefits from social media exposure, as visually appealing packaging and limited-edition flavors encourage organic promotion through user-generated content on platforms such as Instagram and TikTok.
Increasing health consciousness and demand for low-sugar and functional RTD coffee
Health-conscious consumers are paying closer attention to ingredient labels, leading to significant reformulations in the ready-to-drink (RTD) coffee market. The United States Food and Drug Administration (FDA) updated its "healthy" claim criteria in December 2024, setting a limit on added sugars at 5% of the daily value per serving and requiring minimum contributions from food groups such as dairy or whole grains [2]Source: U.S. Food and Drug Administration, “Final Rule: Definition of ‘Healthy’,” fda.gov. Brands that meet these criteria can use the "healthy" descriptor on front-of-pack labeling, offering a competitive advantage in the crowded retail environment. For example, Danone's Silk NextMilk coffee creamers, introduced in 2024, align with this trend by reducing sugar content by 50% compared to traditional creamers while maintaining a creamy texture through proprietary plant-protein blends. Additionally, functional RTD coffee products are incorporating ingredients such as prebiotic fibers, medium-chain triglyceride (MCT) oil, and collagen peptides to cater to consumer preferences for gut health, ketogenic diets, and skin wellness. A study published in the Journal of Functional Foods in 2024 revealed that cold brew coffee fortified with inulin increased satiety scores by 18% compared to standard formulations, highlighting the potential of fiber-enriched RTD coffee as a meal-replacement option.
Growing demand for plant-based and dairy-free RTD coffee formulations
Plant-based milk alternatives have moved from being niche products to becoming mainstream choices, with oat milk and almond milk now widely available in ready-to-drink (RTD) coffee portfolios. Califia Farms, a prominent brand in plant-based RTD coffee, reported a 22% year-over-year sales increase in its cold brew oat milk latte line during the first half of 2025. This growth has been driven by lactose-intolerant consumers and flexitarians who are looking for products with a reduced environmental impact. The environmental factor is particularly important, as life-cycle assessments indicate that oat milk production results in 80% fewer greenhouse gas emissions compared to dairy milk on a per-liter basis. Coca-Cola's Fairlife brand, which has traditionally focused on ultra-filtered dairy products, introduced a plant-based Core Power Elite variant in 2024. This product combines pea protein with cold brew coffee and is aimed at athletes who prioritize muscle recovery and clean-label ingredients. Regulatory compliance for plant-based formulations is relatively straightforward, as these products are not subject to the United States Food and Drug Administration's (FDA) dairy-specific standards of identity. However, labeling must be clear and avoid misleading consumers about protein content or calcium fortification levels.
Flavor diversification and premiumization supporting consumer preference for unique taste experiences
Premiumization in the RTD coffee market is reflected in the use of single-origin beans, nitro infusion, and unique flavor profiles, which allow brands to charge price premiums of 20% to 40% compared to mass-market products. For example, Starbucks' Odyssey Blend ready-to-drink coffee, launched in March 2024, features 100% arabica beans sourced from Latin America and East Africa. This product is positioned to offer the convenience of at-home consumption while delivering the quality associated with specialty cafés. Limited-edition seasonal flavors, such as the Spiced Pumpkin Cream Cold Brew introduced in August 2024, create a sense of urgency and drive repeat purchases. Starbucks reported that these seasonal ready-to-drink variants contributed to 15% of total cold coffee sales during the third quarter of 2024. Innovation in flavor profiles is also evolving, moving beyond sweetness to include savory and botanical notes such as cardamom, lavender, and turmeric. La Colombe's Triple Draft Latte, which uses a proprietary nitrous oxide infusion process to create a frothy texture without the use of dairy, demonstrates how process innovation can help products stand out in a competitive market. Furthermore, premiumization is increasingly associated with ethical sourcing practices, as consumers are willing to pay higher prices for products with fair-trade certifications and direct-trade relationships that support smallholder farmers.
Restraints Impact Analysis*
| Restraint | (~) % Impact on CAGR Forecast | Geographic Relevance | Impact Timeline |
|---|---|---|---|
| Stringent FDA regulations on functional beverage claims and health substantiation requirements | -0.5% | National, affecting all manufacturers making health claims | Long term (≥ 4 years) |
| Shelf-life limitations and quality degradation of refrigerated RTD coffee products | -0.4% | National, with acute impact in rural and low-density distribution areas | Medium term (2-4 years) |
| Complex nutritional labeling and disclosure requirements limiting marketing flexibility and consumer appeal | -0.3% | National, with heightened scrutiny in California and New York | Short term (≤ 2 years) |
| Volatility and price fluctuations in coffee bean commodity markets | -0.6% | National, with disproportionate impact on smaller brands lacking hedging capacity | Short term (≤ 2 years) |
| Source: Mordor Intelligence | |||
Stringent FDA regulations on functional beverage claims and health substantiation requirements
The United States Food and Drug Administration has increased its enforcement of structure-function claims and nutrient content descriptors since 2024. Manufacturers are now required to back health-related marketing claims with randomized controlled trials or epidemiological evidence. In 2024, the FDA issued 14 warning letters to beverage companies for making unsubstantiated claims about immune support, cognitive enhancement, and metabolic health. The cost of compliance for clinical validation can exceed USD 500,000 per ingredient, creating a significant challenge for emerging brands with limited research and development budgets. Additionally, the updated "healthy" claim rule, which takes effect in December 2024, introduces stricter limits on added sugar and sodium content. This has led to reformulation cycles that delay product launches and reduce first-mover advantages. Despite these challenges, brands that successfully meet these regulatory requirements can achieve credible differentiation in a market filled with vague wellness claims. The FDA's Generally Recognized as Safe (GRAS) notification database, which lists over 800 affirmed ingredients, serves as a valuable resource for formulators seeking pre-approved functional additives. However, novel botanicals and nootropics still require extensive safety documentation.
Shelf-life limitations and quality degradation of refrigerated RTD coffee products
Refrigerated ready-to-drink coffee products face a shelf-life limitation of 60 to 90 days due to factors such as oxidation, lipid rancidity, and microbial spoilage. This restricts their distribution to areas with well-developed cold-chain infrastructure. A study published in the Journal of Food Science in 2024 revealed that dissolved oxygen levels in cold brew coffee increased by 35% after 45 days of refrigerated storage, leading to off-flavors described as cardboard-like or stale. High-pressure processing and aseptic packaging technologies can extend the shelf life to 180 days. However, the required capital investment for these systems ranges from USD 2 million to USD 10 million per production line, which benefits vertically integrated manufacturers such as PepsiCo and Coca-Cola. On the other hand, smaller roasters often adopt regional distribution models, incurring higher logistics costs and limiting their geographic reach to ensure product freshness. The challenge of quality degradation is further intensified by temperature abuse during transportation and retail display, as even brief exposure to ambient temperatures accelerates microbial growth and flavor deterioration.
*Our forecasts treat driver/restraint impacts as directional, not additive. The impact forecasts reflect baseline growth, mix effects, and variable interactions.
Segment Analysis
By Type: Cold Brew Gains Ground on Iced Coffee Dominance
Iced coffee accounted for 50.96% of type-based sales in 2025, emphasizing its established role as the preferred ready-to-drink (RTD) format for mainstream consumers who prioritize affordability and familiar taste profiles. On the other hand, cold brew coffee is projected to grow at an annual rate of 6.71% through 2031, surpassing the growth rate of iced coffee. This growth is driven by its lower acidity, smoother texture, and premium positioning, which appeal to a broader range of consumers.
The cold brew production process involves steeping coarsely ground coffee beans in cold water for 12 to 24 hours. This method extracts fewer bitter compounds and oxidized oils compared to hot-brewed iced coffee, resulting in a naturally sweeter flavor that requires less added sugar. This characteristic aligns with the preferences of health-conscious consumers and enables brands to market cold brew as a cleaner and more refined option. Starbucks' cold brew line, which includes nitro-infused variants, achieved over USD 1 billion in retail sales in 2024, showcasing the format's strong commercial potential.


By Packaging Type: PET Bottles Lead Amid Sustainability Pressures
PET bottles accounted for 35.82% of packaging-based sales in 2025 and are projected to grow at a rate of 6.50% through 2031. This growth is driven by their lightweight design, shatter resistance, and recyclability, and according to the American Chemistry Council, PET bottle recycling rates reached 29.1% in 2024, a slight increase from 27.9% in 2023, though still lower compared to glass and aluminum. In response to environmental concerns, brands are incorporating post-consumer recycled content. For example, Coca-Cola has committed to using 50% recycled PET (rPET) in its ready-to-drink (RTD) coffee bottles by 2027, while PepsiCo aims for 25% rPET by 2025.
Glass bottles, valued for their premium aesthetic and inert material properties, hold a smaller market share but command higher price points in specialty retail channels. Metal cans, particularly aluminum, are becoming more popular due to their superior recyclability and ability to preserve flavor by blocking light and oxygen. La Colombe's draft latte cans are a notable example of this trend. Aseptic packaging, including Tetra Pak cartons and flexible pouches, offers extended shelf life without refrigeration, enabling broader distribution to rural areas and international markets. Tetra Pak's six-layer laminate structure effectively protects against oxygen and light ingress, extending shelf life to 12 months while maintaining flavor integrity.
By Functionality: Energy-Infused Formulations Dominate Wellness Positioning
Energy-infused ready-to-drink coffee accounted for 38.01% of functionality-based sales in 2025 and is projected to grow at a rate of 6.56% through 2031. This growth reflects increasing consumer demand for beverages that combine caffeine with additional performance benefits. These products typically provide 150 to 300 milligrams of caffeine per serving, along with ingredients such as B vitamins, taurine, and guarana, which are known to enhance alertness and endurance. High Brew Coffee, a Texas-based brand, markets its double-espresso cans as a healthier alternative to traditional energy drinks by emphasizing natural ingredients and reduced sugar content. The energy-infused segment competes directly with brands like Red Bull and Monster, appealing to consumers who prefer coffee's flavor profile and view it as a more natural source of stimulation.
Protein-enriched RTD coffee, although holding a smaller market share, caters to the "proffee" trend, where fitness enthusiasts mix protein powder with coffee for post-workout recovery. Chobani's coffee protein shakes, which provide 20 grams of protein per serving, illustrate this blend of meal replacement and beverage categories. Other functionality-based segments include collagen-infused coffee for skin health, medium-chain triglyceride (MCT) oil-enhanced coffee for ketogenic diets, and cannabidiol (CBD)-infused coffee for relaxation. However, the CBD-infused segment faces challenges due to inconsistent state-level regulations. The United States Food and Drug Administration (FDA) has yet to establish a clear regulatory framework for CBD in food and beverages, despite significant consumer interest.
By Distribution Channel: Off-Trade Dominance Reflects Convenience and Value
Off-trade channels accounted for 66.71% of distribution-based sales in 2025 and are projected to grow at a rate of 6.53% through 2031. This growth is primarily driven by supermarkets, hypermarkets, convenience stores, and e-commerce platforms, which offer a wider range of products and competitive pricing. Supermarkets and hypermarkets, including Walmart, Kroger, and Costco, leverage their scale to negotiate volume discounts and secure prominent shelf placements. These retailers often position ready-to-drink (RTD) coffee in refrigerated end-caps and checkout lanes to encourage impulse purchases. Convenience stores, with over 150,000 locations nationwide, serve as critical access points for on-the-go consumers. Specialty stores, such as Whole Foods and Sprouts, cater to health-conscious consumers by offering organic, fair-trade, and functional RTD coffee options. These products typically command premium prices due to their curated assortments and appeal to a niche but expanding consumer segment.
Other distribution channels, including vending machines and workplace micro-markets, target captive audiences in office buildings and universities. While these channels have shown signs of recovery, they have only partially returned to their pre-pandemic levels. Online retail, encompassing platforms such as Amazon, Instacart, and direct-to-consumer websites, experienced year-over-year growth in 2025, outpacing brick-and-mortar growth rates [3]Source: U.S. Department of Commerce, "Quarterly Retail E-Commerce Sales," census.gov. This trend reflects a shift in consumer behavior, with more individuals prioritizing convenience and utilizing subscribe-and-save discounts. The growing reliance on e-commerce platforms underscores their transformative role in the distribution landscape for RTD coffee products.
Segment Analysis
The United States Ready-to-Drink (RTD) Coffee Market demonstrates significant regional differences influenced by demographic factors, climate, and retail infrastructure. West Coast states, particularly California, Oregon, and Washington, lead in per-capita RTD coffee consumption. This leadership is driven by a strong specialty coffee culture, a higher proportion of health-conscious consumers, and early adoption of plant-based formulations. California's strict environmental regulations, such as the bottle deposit program and single-use plastic bans, have further encouraged the adoption of sustainable packaging formats, including aluminum cans and recycled polyethylene terephthalate (rPET) bottles.
The Northeast corridor, which includes New York, Massachusetts, and Pennsylvania, represents the second-largest regional market. This is due to dense urban populations, extensive convenience store networks, and high commuter volumes that boost grab-and-go demand. For instance, Starbucks' partnership with Gopuff focuses on metropolitan areas like New York City and Boston, showcasing how brands adapt distribution strategies to align with regional consumption patterns. Meanwhile, the Southeast and Midwest regions are experiencing faster growth rates compared to coastal markets. This growth is supported by expanding suburban populations, rising disposable incomes, and increased retail penetration by national chains such as Walmart and Dollar General. These regions also show a stronger preference for value-oriented RTD coffee formats, with private-label products capturing a larger market share compared to premium-focused coastal markets. Texas, as a standalone market, combines factors such as high population growth, a warm climate, and an extensive convenience store network, making it a strategic focus for RTD coffee brands. High Brew Coffee, based in Austin, has leveraged its Texas roots to build regional brand loyalty before expanding nationally.
Climate plays a significant role in shaping regional consumption patterns. Warmer states such as Florida, Arizona, and Nevada exhibit consistent year-round demand for cold coffee beverages, while northern states experience more pronounced seasonal fluctuations. Demographic trends also intersect with geographic segmentation. States with younger populations and higher college enrollment rates, such as Colorado and North Carolina, show increased demand for functional and energy-infused RTD coffee products. Regional taste preferences further differentiate markets. Southern consumers tend to favor sweeter, creamier flavor profiles, whereas West Coast consumers prioritize low-sugar, plant-based options. Brands that tailor their flavor portfolios and packaging formats to meet these regional preferences achieve higher market penetration and stronger brand loyalty. This highlights the strategic importance of localized marketing and distribution strategies in the RTD coffee market.
Competitive Landscape
The United States Ready-to-Drink (RTD) Coffee Market is defined by a consolidated competitive structure, where a small number of multinational beverage companies and specialty coffee brands control the majority of sales. Prominent players such as Starbucks, PepsiCo, Coca-Cola, Danone, and Nestlé collectively hold a significant share of the market. These companies leverage their extensive distribution networks, strong brand equity, and research and development (R&D) capabilities to maintain dominance in refrigerated retail aisles.
Key strategies in the market include vertical integration into coffee sourcing, partnerships with delivery platforms, and innovation in functional ingredients and sustainable packaging. For example, Starbucks' 2024 collaboration with Gopuff to enable 15-minute delivery of bottled beverages demonstrates how established players are using digital channels to bypass traditional retail intermediaries and achieve higher margins. Similarly, Coca-Cola's acquisition of Costa Coffee and its subsequent U.S. RTD coffee launch in 2024 reflect a strategic focus on diversifying beyond carbonated soft drinks into high-growth coffee categories.
Growth opportunities exist in underserved segments such as low-caffeine formulations for evening consumption, coffee-tea hybrids, and personalized nutrition platforms that incorporate functional ingredients tailored to individual health needs. Emerging brands like Chamberlain Coffee, founded by social media influencer Emma Chamberlain, are disrupting the market by using direct-to-consumer models and branding strategies aligned with Generation Z preferences, achieving rapid growth without relying on traditional retail distribution channels. Technological advancements are also reshaping the market, with brands adopting artificial intelligence (AI)-driven demand forecasting, blockchain for supply chain transparency, and augmented reality packaging to enhance consumer engagement. Additionally, patent activity in areas such as cold brew extraction methods, nitro infusion systems, and functional ingredient delivery mechanisms has increased. Notably, Nestlé secured a 2024 patent for a mushroom-coffee emulsion process designed to mask earthy flavors while preserving bioactive compounds.
United States Ready-to-Drink Coffee Industry Leaders
-
Starbucks Corp.
-
PepsiCo Inc.
-
Danone S.A.
-
Nestlé S.A.
-
The Coca-Cola Company
- *Disclaimer: Major Players sorted in no particular order

Recent Industry Developments
- March 2025: Dutch Bros Inc. announced entry into consumer packaged goods market through strategic partnership with Trilliant Food & Nutrition LLC to launch retail packaged coffee line, expanding beyond traditional coffeehouse operations into RTD and packaged coffee segments with national distribution ambitions.
- September 2024: Nespresso introduced its first ready‑to‑drink Master Origins Colombia coffee in the United States, a limited‑edition Colombian brew sweetened with local honey, sold via boutiques, online, and the brand’s mobile app to capture booming RTD coffee demand.
- March 2024: Starbucks and PepsiCo’s North American Coffee Partnership launched a new ready‑to‑drink lineup, featuring oatmilk Frappuccino bottles, new cold brew cans, multi‑serve cold brew flavors, and refreshed packaging for Tripleshot Energy and Doubleshot Energy coffee beverages in US retail channels.


United States Ready-to-Drink Coffee Market Report Scope
Ready-to-Drink (RTD) coffee refers to pre-packaged, non-alcoholic beverages that are brewed and ready for consumption without requiring further dilution. RTD coffee typically consists of pre-brewed coffee formulations, often combined with milk, sugar, or flavorings, and is conveniently packaged for easy, on-the-go consumption.
The United States ready-to-drink (RTD) coffee market is segmented by type into cold brew coffee, iced coffee, and other RTD coffee; by packaging type into PET bottles, glass bottles, metal cans, aseptic packages, and disposable cups; by functionality into protein-enriched, energy-infused, and others; and by distribution channel into on-trade and off-trade. The off-trade segment is further subsegmented into supermarkets/hypermarkets, convenience stores, specialty stores, online retail, and other distribution channels. The market sizing has been done in value terms in USD and Volume in Units for all the abovementioned segments.
By Type
| Cold Brew Coffee |
| Iced Coffee |
| Other RTD Coffee |
By Packaging Type
| PET Bottles |
| Glass Bottles |
| Metal Can |
| Aseptic packages (tetra pak, cartons, pouches) |
| Disposable Cups |
By Functionality
| Protein-Enriched |
| Energy-Infused |
| Other |
By Distribution Channel
| On-Trade | |
| Off-Trade | Supermarket/Hypermarket |
| Convenience Stores | |
| Specialty Stores | |
| Online Retail | |
| Other Distribution Channels |
| By Type | Cold Brew Coffee | |
| Iced Coffee | ||
| Other RTD Coffee | ||
| By Packaging Type | PET Bottles | |
| Glass Bottles | ||
| Metal Can | ||
| Aseptic packages (tetra pak, cartons, pouches) | ||
| Disposable Cups | ||
| By Functionality | Protein-Enriched | |
| Energy-Infused | ||
| Other | ||
| By Distribution Channel | On-Trade | |
| Off-Trade | Supermarket/Hypermarket | |
| Convenience Stores | ||
| Specialty Stores | ||
| Online Retail | ||
| Other Distribution Channels | ||


Market Definition
- Carbonated Soft Drinks (CSDs) - Carbonated soft drinks (CSDs) refer to non-alcoholic beverages that are carbonated and typically flavored, containing dissolved carbon dioxide to create effervescence. These beverages commonly include cola, lemon-lime, orange, and various fruit-flavored sodas. Marketed in cans, bottles, or fountain dispense.
- Juices - We have considered packaged juices which encompass non-alcoholic beverages derived from fruits, vegetables, or a combination thereof, processed and sealed in various packaging formats such as bottles, cartons, or pouches. Excluding fresh juices, this market segment involves commercially prepared and preserved juices, often with added preservatives and flavors.
- Ready-to-Drink (RTD) Tea and RTD Coffee - Ready-to-Drink (RTD) tea and RTD coffee are pre-packaged, non-alcoholic beverages that are brewed and prepared for consumption without further dilution. RTD tea typically includes various tea varieties, infused with flavors and sweeteners, and comes in bottles, cans, or cartons. Similarly, RTD coffee involves pre-brewed coffee formulations, often mixed with milk, sugar, or flavorings, and is conveniently packaged for on-the-go consumption.
- Energy Drinks - Energy drinks are non-alcoholic beverages formulated to provide a quick boost of energy and alertness. Whereas, sports drinks are beverages designed to hydrate and replenish electrolytes, particularly after physical exertion, exercise, or intense activity
| Keyword | Definition |
|---|---|
| Carbonated Soft Drinks | Carbonated soft drinks (CSDs) are a combination of carbonated water and flavouring, sweetened by sugar or a non-sugar sweeteners. |
| Standard Cola | Standard Cola is defined as the original flavor of cola soda. |
| Diet Cola | A cola-based soft drink containing no or low amounts of sugar |
| Fruit Flavored Carbonates | A carbonated beverage prepared from fruit juice/fruit flavor with carbonated water and containing sugar, dextrose, invert sugar or liquid glucose either singly or in combination. It may contain peel oil and fruit essences. |
| Juice | Juice is a drink made from the extraction or pressing of the natural liquid contained in fruit and vegetables. |
| 100% Juice | Fruit/vegetable juice made from fruit in the form of its juice with no water added to make up the volume. It is not permitted to add sugars, sweeteners, preservatives, flavourings or colourings to fruit juice. |
| Juice Drinks (up to 24% Juice) | Fruit/vegetable juice drinks with up to 24% fruits/vegetable extract. |
| Nectars (25-99% Juice) | Juices that can have between 25 and 99% of fruit, with the minimum legal limits defined depending on the type of fruit |
| Juice concentrates | Juice Concentrates are those form of juices when most of this liquid is removed resulting in a thick, syrupy product known as juice concentrate. |
| RTD Coffee | Packaged coffee beverages that are sold in a prepared form and are ready for consumption at the time of purchase. |
| Iced Coffee | An iced coffee is a cold version of coffee, usually a combination of hot espresso and milk with ice added to it. |
| Cold Brew Coffee | Cold brew also called cold water extraction or cold pressing is made by steeping ground coffee in room-temperature water for several hours. |
| RTD Tea | Ready-to-drink (RTD) tea is a packaged tea product ready for immediate consumption without brewing or preparation |
| Iced Tea | Ice tea or iced tea is a drink made from tea without milk but with sugar and sometimes fruit flavourings, drunk cold. |
| Green Tea | Green tea is a tea beverage which promotes mental alertness, relieving digestive symptoms and promoting weight loss. |
| Herbal Tea | Herbal tea beverages are made from the infusion or decoction of herbs, spices, or other plant material in hot water. |
| Energy Drink | A type of drink containing stimulant compounds, usually caffeine, which is marketed as providing mental and physical stimulation. They may or may not be carbonated and may also contain sugar, other sweeteners, or herbal extracts, among numerous possible ingredients. |
| Sugar-free or Low-calories Energy Drinks | Sugar-free or Low-calories Energy Drinks are sugar-free, artificially sweetened energy drinks with few or no calories. |
| Traditional Energy Drink | Traditional Energy Drinks are functional soft drinks containing ingredients designed to boost the consumer's energy. |
| Natural/Oraganic Energy Drinks | Natural/Organic energy drinks are energy drinks free of artificial sweeteners and synthetic colorings. Instead, they contain naturally derived ingredients such as green tea, yerba mate, and botanical extracts. |
| Energy Shots | A small but highly concentrated energy drink that contains large amounts of caffeine and/or other stimulants. The quantity is comparatively smaller compared to energy drinks. |
| Sports Drink | Sports drinks are beverages designed specifically for the rapid supply of fluid, carbohydrates, and electrolytes before, during or after exercise. |
| Isotonic | Isotonic drinks contain similar concentrations of salt and sugar as in the human body, and are designed to quickly replace fluids lost during exercise but with an increase of carbohydrate. |
| Hypertonic | Hypertonic drinks have a higher concentration of salt and sugar than the human body. They are best drunk after exercise as it is important to replace glycogen levels quickly after exercise. |
| Hypotonic | Hypotonic drinks are designed to quickly replace fluids lost during exercise. They have very low carbohydrate content and a lower concentration of salt and sugar than the human body. |
| Electrolyte-Enhanced Water | Electrolyte water is water infused with electrically-charged minerals, such as sodium, potassium, calcium, and magnesium. |
| Protein-based Sport Drinks | Protein-based sports drinks are those sports drinks which has added protein in it that will improve performance and reduce muscle protein breakdown. |
| On-Trade | The on-trade refers to places that sell beverages for immediate consumption on the premises like bars, restaurants, and pubs |
| Off-Trade | Off-trade usually means places like liquor stores, supermarkets and other places where you don't consume the beverage right away. |
| Convenience Store | A retail business that provides the public with a convenient location to quickly purchase a wide variety of consumable products and services, generally food and gasoline. |
| Specialty store | A specialty store is a shop/store that carries a deep assortment of brands, styles, or models within a relatively narrow category of goods |
| Online Retail | Online retail is a type of eCommerce whereby a business sells goods or services directly to consumers from a website. |
| Aseptic Packaging | Aseptic packaging refers to the filling of a cold, commercially sterile product under sterile conditions into a presterilized container and closure under sterile conditions to form a seal that effectively excludes microorganisms. These includes tetra packs, cartons, pouches etc. |
| PET Bottle | PET bottle means a bottle made of polyethylene terephthalate. |
| Metal Cans | Metal containers made of aluminum or tin- plated or zinc-plated steel, which are commonly used for packaging food, beverages or other products. |
| Disposable Cups | Disposable Cup means a cup or other container designed for single use to serve beverages, such as water, cold drinks, hot drinks and alcoholic beverages. |
| Gen Z | A way of referring to the group of people who were born in the late 1990s and early 2000s. |
| Millenial | Anyone born between 1981 and 1996 (ages 23 to 38 in 2019) is considered a Millennial |
| Taurine | Taurine is an amino acid that supports immune health and nervous system function. |
| Bars & Pubs | It is a drinking establishment licensed to serve alcoholic drinks for consumption on the premises. |
| Café | It is a foodservice establishment serving refreshments (mainly coffee) and light meals. |
| On the go | It means doing / dealing with while busily engaged with something and not diverting plans in order to accommodate. |
| Internet Penetration | The Internet Penetration Rate corresponds to the percentage of the total population of a given country or region that uses the Internet. |
| Vending Machine | A machine that dispenses small articles such as food, drinks, or cigarettes when a coin or token is inserted |
| Discount store | A discount store or discounter offers a retail format in which products are sold at prices that are in principle lower than an actual or supposed "full retail price". Discounters rely on bulk purchasing and efficient distribution to keep down costs. |
| Clean Label | Clean label on the beverage market are drinks that are made from few ingredients of natural origin and are not or only slightly processed. |
| Caffeine | An alkaloid compound which is a stimulant of the central nervous system. It is mainly used recreationally, as a mild cognitive enhancer to increase alertness and attentional performance. |
| Extreme sport | Action sports, adventure sports or extreme sports are activities perceived as involving a high degree of risk. |
| High-intensity interval training | It incorporates several rounds that alternate between several minutes of high intensity movements to significantly increase the heart rate to at least 80% of one's maximum heart rate, followed by short periods of lower intensity movements. |
| Shelf life | The length of time for which an item remains usable, fit for consumption, or saleable. |
| Cream Soda | Cream soda is a sweet soft drink. Generally flavored with vanilla and based on the taste of an ice cream float |
| Root Beer | Root beer is a sweet North American soft drink traditionally made using the root bark of the sassafras tree Sassafras albidum or the vine of Smilax ornata as the primary flavor. Root beer is typically, but not exclusively, non-alcoholic, caffeine-free, sweet, and carbonated. |
| Vanilla Soda | A carbonated soft drink flavoured with vanilla. |
| Dairy-Free | A product that does not contain any milk or milk products from cows, sheep or goats. |
| Caffeine-Free Energy Drinks | Caffeine-free energy drinks rely on other ingredients to boost the energy. Popular choices include amino acids, B vitamins, and electrolytes. |


Research Methodology
Mordor Intelligence follows a four-step methodology in all our reports.
- Step-1: IDENTIFY KEY VARIABLES: In order to build a robust forecasting methodology, the variables and factors identified in Step 1 are tested against available historical market numbers. Through an iterative process, the variables required for market forecast are set, and the model is built on the basis of these variables.
- Step-2: Build a Market Model: Market-size estimations for the forecast years are in nominal terms. Inflation is not a part of the pricing, and the average selling price (ASP) is kept constant throughout the forecast period for each country.
- Step-3: Validate and Finalize: In this important step, all market numbers, variables, and analyst calls are validated through an extensive network of primary research experts from the market studied. The respondents are selected across levels and functions to generate a holistic picture of the market studied.
- Step-4: Research Outputs: Syndicated reports, custom consulting assignments, databases & subscription platforms


