
Market Overview
| Study Period | 2020 - 2031 |
|---|---|
| Forecast Data Period | 2026 - 2031 |
| Base Year Market Size (2025) | USD 27.28 Billion |
| Market Size (2026) | USD 29.46 Billion |
| Market Size (2031) | USD 43.33 Billion |
| Growth Rate (2026 - 2031) | 8.02 % |
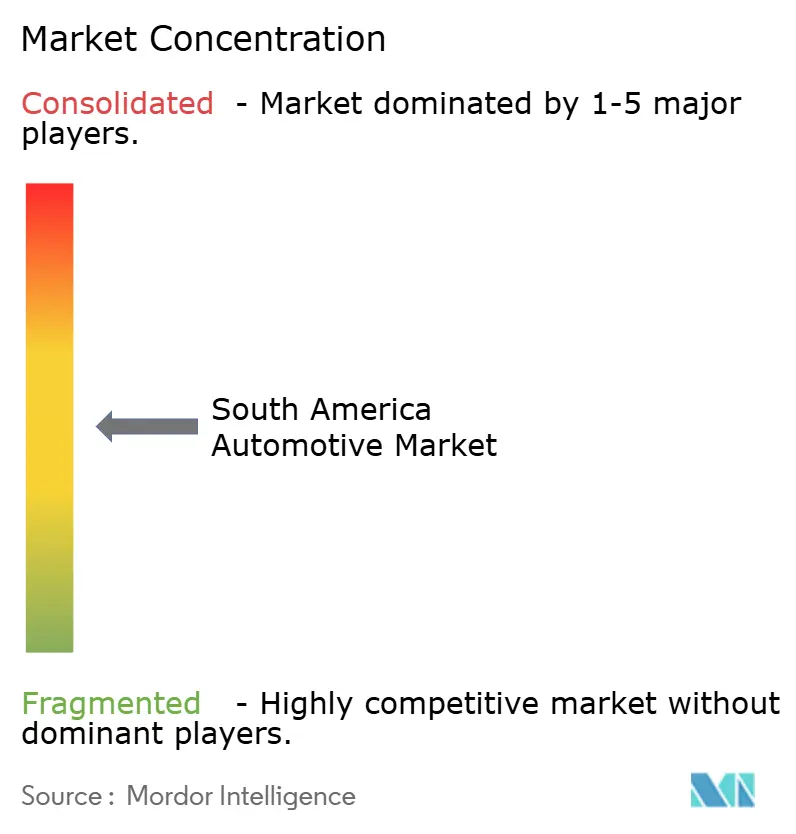
| Market Concentration | Medium |
Major Players *Disclaimer: Major Players sorted in no particular order Image © Mordor Intelligence. Reuse requires attribution under CC BY 4.0. | |
South America Automotive Market Analysis by Mordor Intelligence
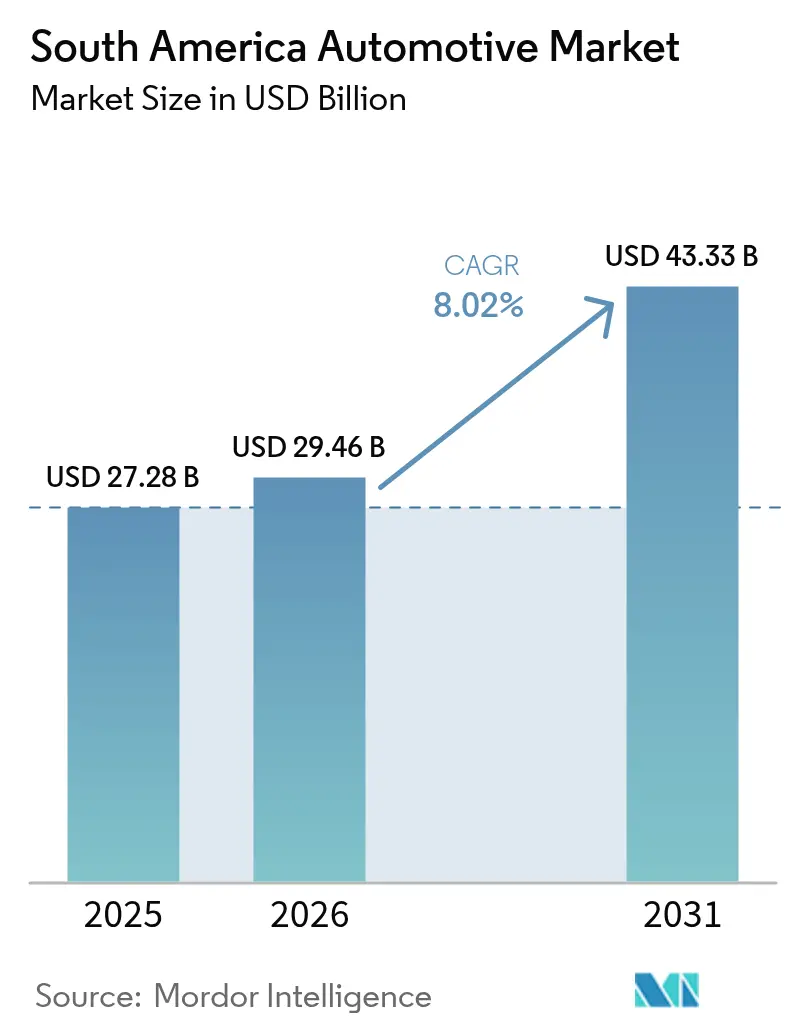
The South American automotive market size is expected to grow from USD 27.28 billion in 2025 to USD 29.46 billion in 2026 and is forecast to reach USD 43.33 billion by 2031 at 8.02% CAGR over 2026-2031. The South American automotive market continues to benefit from swift infrastructure spending, flexible-fuel policy enhancements such as Brazil’s E30 mandate, and the proliferation of digital retail platforms that shorten purchase cycles and expand consumer reach. Elevated borrowing costs and semiconductor shortages continue to pose near-term headwinds, yet resilient household consumption and an expanding middle class underpin the region’s long-term growth profile. Competitive intensity has risen as Stellantis commits EUR 5.6 billion through 2030, and Chinese OEMs localize production to avoid rising Mercosur tariffs, all of which is reshaping the product mix, technology adoption, and supplier ecosystems.
Key Report Takeaways
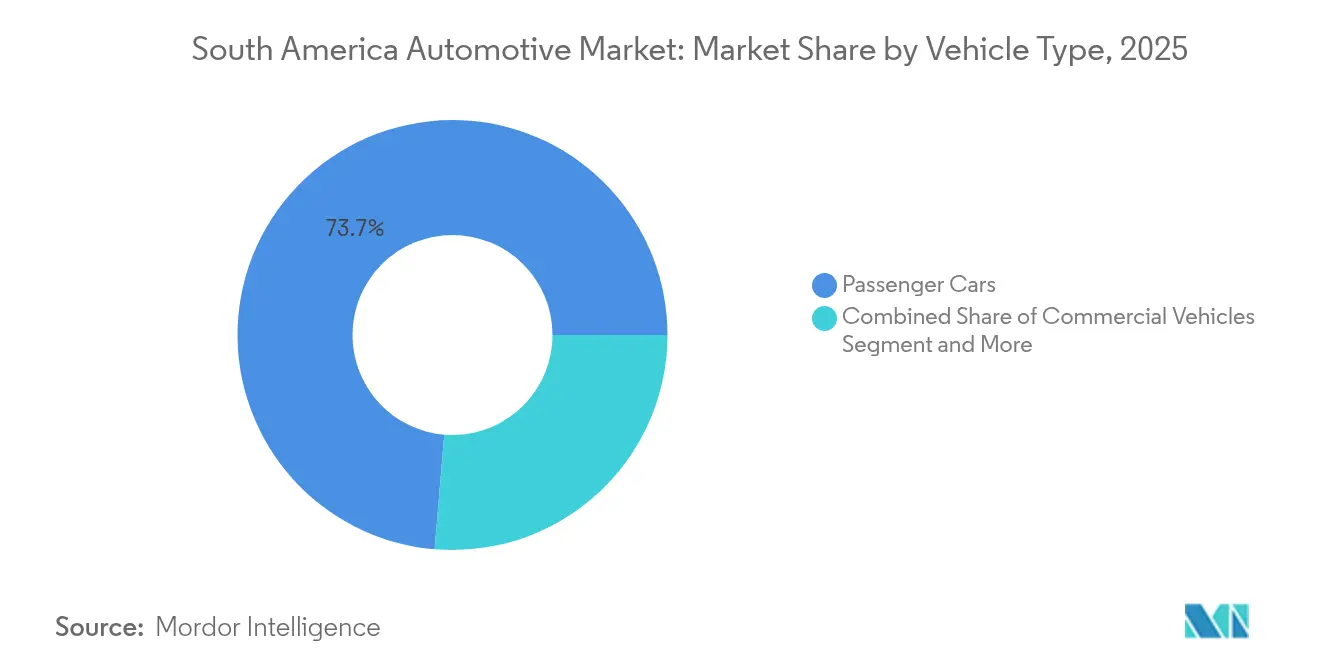
- By vehicle type, passenger cars captured 73.68% of the South American automotive market share in 2025, and this segment is expected to advance at a 11.95% CAGR through 2031.
- By propulsion, internal-combustion engines held 72.95% of the South American automotive market share in 2025, whereas battery electric vehicles represented the fastest trajectory at an 11.15% CAGR.
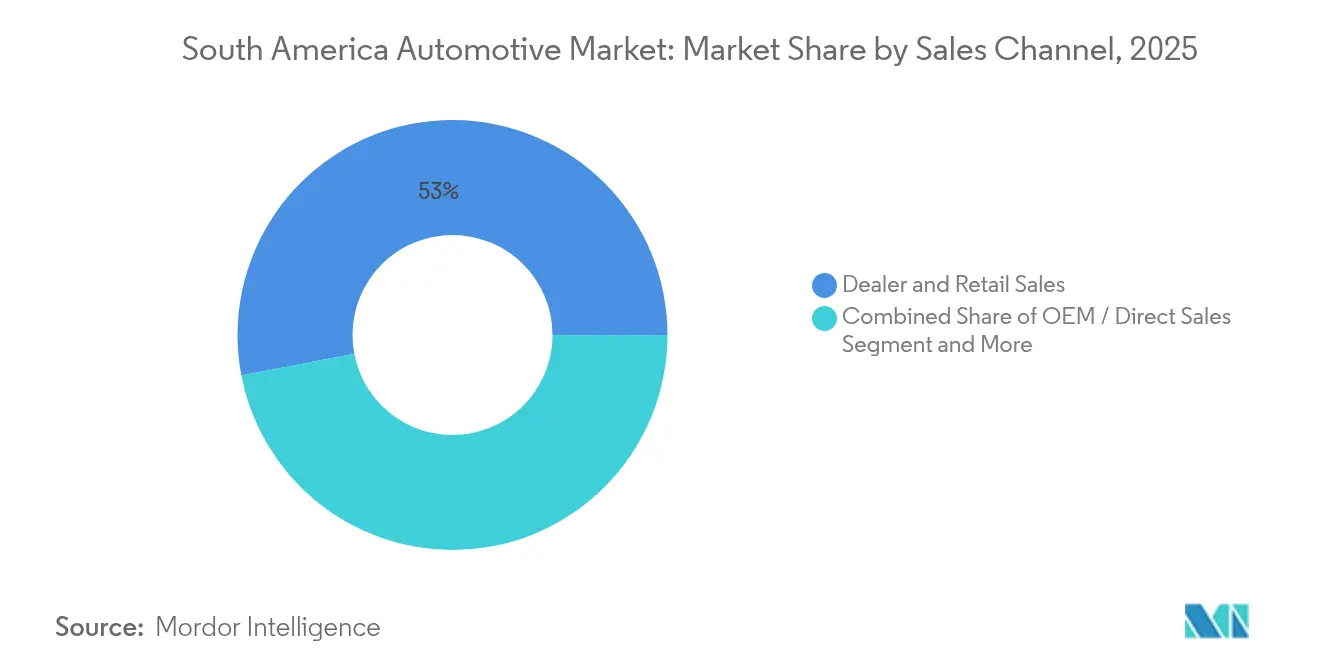
- By sales channel, dealer and retail Sales retained a 53.02% share in 2025; online direct-to-consumer platforms are growing at an 11.25% CAGR.
- By end user, individual buyers accounted for 62.74% of demand in 2025; however, mobility operators are expanding at a 11.12% CAGR.
- By country, Brazil commanded 60.85% of the South American automotive market share in 2025, while Colombia is set to rise at a 12.74% CAGR to 2031.
Note: Market size and forecast figures in this report are generated using Mordor Intelligence’s proprietary estimation framework, updated with the latest available data and insights as of 2026.
South America Automotive Market Trends and Insights
Drivers Impact Analysis*
| Driver | (~) % Impact on CAGR Forecast | Geographic Relevance | Impact Timeline |
|---|---|---|---|
| Regional OEM Platforms | +2.1% | Brazil and Argentina hubs | Long term (≥ 4 years) |
| GDP and Credit Rebound | +1.8% | Brazil, Argentina, Colombia | Medium term (2-4 years) |
| Chinese EVs via Mercosur | +1.5% | Brazil, Argentina | Medium term (2-4 years) |
| Brazil Flex-Fuel Incentives | +1.2% | Primarily Brazil, spillover Mercosur | Long term (≥ 4 years) |
| Digital Trade-In Platforms | +0.9% | Major urban centers | Short term (≤ 2 years) |
| Mining-Funded EV Subsidies | +0.7% | Chile, Peru, Colombia | Medium term (2-4 years) |
| Source: Mordor Intelligence | |||
OEM Investments in Regional Vehicle Platforms
In South America, growing sales of traditional and electrified vehicles and heightened investments from major players like Volkswagen AG and Stellantis NV have increased profitability. Stellantis alone invested EUR 5.6 billion, the most significant single commitment in regional history [1]“Investment Plan South America 2025-2030,”, Stellantis, stellantis.com. Volkswagen AG allocated USD 580 million to an Argentina-based Amarok program tailored to local duty-cycle needs. At the same time, Toyota Motor and BMW Group announced multi-year expansions focusing on hybrid and flex-fuel drivetrains. Joint projects such as the GM-Hyundai collaboration covering five models and targeting 800,000 annual sales illustrate a pivot toward shared cost structures and accelerated product cadence. These localized platforms reduce currency risk, meet regional regulatory norms, and leverage Mercosur tariff preferences, collectively enhancing the competitiveness of the South American automotive market.
Post-Pandemic Rebound in GDP and Consumer Credit Availability
Regional GDP is projected to increase by 2.5% in 2025, up from 1.9% the previous year, which is expected to lift household incomes and stimulate automotive lending, even as benchmark rates remain elevated [2]“World Economic Situation and Prospects 2025,”, United Nations, un.org. Brazil's economy expanded by 3.4% in 2024, with an unemployment rate of 6.5%, creating a supportive backdrop for vehicle purchases. Argentina’s reforms have cut monthly inflation to 2.8%, unlocking new credit channels for auto buyers, while Colombia’s manufacturing output is growing annually, reinforcing the momentum in the South American automotive market. Although financing costs remain restrained, easing monetary conditions across most central banks should gradually revive loan accessibility. Stronger macroeconomic fundamentals are expected to translate into higher showroom traffic and order backlogs throughout 2025.
Chinese OEM Green-Field EV Plants Using Mercosur Tariff Breaks
BYD’s complex in Bahia became operational in July 2025, with an annual capacity of 50,000 units, setting the stage for duty-free exports within Mercosur [3]“Camaçari Plant Inauguration,”, BYD Company, byd.com. Great Wall Motor repurposed a former Mercedes-Benz facility, meeting 40% local-content thresholds to qualify for tariff exemptions. Shared facilities such as the Renault-Geely tie-up in Paraná blend existing infrastructure with Chinese manufacturing discipline, yielding faster scale-up at lower capital intensity. Local footprints neutralize Brazil’s scheduled EV import tariff rise to 35% by mid-2026, keeping sticker prices competitive. Combined, these moves fortify China’s position in the South American automotive market while accelerating technology transfer to local supply bases.
Digitally Enabled Used-Car Platforms Boosting Trade-Ins
Online players like Kavak are entering Brazil to capitalize on the used-car market. AI-driven appraisal engines offer transparent pricing, which raises consumer trust and speeds up transaction times. Cross-border partnerships such as Auto Avaliar with Argentina-based Karvi extend platform footprints, linking inventory across Mercosur and enhancing liquidity. Dealers increasingly integrate these tools to widen reach and convert trade-ins into new-car sales, improving lot turnover. The net effect is a more efficient secondary market that indirectly supports new-vehicle demand in the South American automotive market.
Restraints Impact Analysis*
| Restraint | (~) % Impact on CAGR Forecast | Geographic Relevance | Impact Timeline |
|---|---|---|---|
| High Financing and Inflationary Vehicle Costs | -1.9% | Brazil dominant, regional spillover | Short term (≤ 2 years) |
| Semiconductor Supply Volatility | -1.1% | Brazil, Mexico hubs | Medium term (2-4 years) |
| Port Delays for CKD and Battery Imports | -0.8% | Brazil, Argentina ports | Short term (≤ 2 years) |
| Charging Network Distrust | -0.6% | Regional EV corridors | Long term (≥ 4 years) |
| Source: Mordor Intelligence | |||
Elevated Financing Rates and Inflation-Driven Vehicle Prices
Brazil’s Selic rate climbed to 14.25% in 2025, pushing automotive loan coupons as high as and squeezing affordability[4]“Monetary Policy Committee Minutes, June 2025,”, Banco Central do Brasil, bcb.gov.br. Although Argentina’s inflation has moderated, peso volatility keeps lending spreads wide, while regional currency fluctuations cloud import-price visibility. OEMs now offer tenures and subsidized rates, but credit penetration still lags pre-pandemic norms. Consequently, near-term volumes in the South American automotive market may undershoot potential until monetary conditions ease.
Semiconductor Supply Volatility for Local Assembly
Flood-induced shutdowns at suppliers in Rio Grande do Sul halted Volkswagen's production lines, illustrating how localized shocks ripple through just-in-time inventory models. Brazil lacks a domestic chip foundry capable of automotive-grade output, making OEMs dependent on Asian imports vulnerable to logistics snarls. The shortage disproportionately affects BEVs that require battery-management ICs, jeopardizing rollout schedules. Automakers have begun redesigning platforms around multi-sourcing strategies, yet full resilience remains several years away. Intermittent stoppages, therefore, continue to weigh on capacity utilization across the South American automotive market.
*Our forecasts treat driver/restraint impacts as directional, not additive. The impact forecasts reflect baseline growth, mix effects, and variable interactions.
Segment Analysis
By Vehicle Type: Passenger Cars Dominate Growth
Passenger cars accounted for 73.68% of the South American automotive market size in 2025 and are projected to expand at a 11.95% CAGR through 2031, benefiting from rising urbanization and middle-class income gains. SUVs and crossovers lead the surge, prized for higher seating positions and perceived safety, whereas compact sedans preserve a foothold due to fuel efficiency at premium pump prices. Though smaller in unit terms, commercial vehicles underpin logistics in agriculture and mining corridors, with light pickups favored by Brazilian farms and heavy trucks powering Chilean copper exports. Two-wheelers are proliferating in congested megacities as cost-effective mobility, while off-highway equipment enjoys tailwinds from public works spending.
The passenger-car momentum is reinforced by Stellantis’ plan to launch more than 40 new products by 2030, many of them on localized platforms geared to flexible-fuel drivetrains. Financing promotions aim to mitigate loan-rate headwinds that otherwise dampen showroom traffic. Meanwhile, used-car digital platforms improve trade-in liquidity, lowering the effective upgrade cost and sustaining turnover. The vehicle-type mix underscores how the South American automotive market balances personal-mobility aspirations with commercial transport imperatives.



By Propulsion Type: ICE Dominance Faces Electric Disruption
Internal-combustion engines retained 72.95% of the South American automotive market in 2025; however, battery electrics are accelerating at a 11.15% CAGR as fiscal incentives and localized Chinese production narrow the price gaps. Brazil’s E30 scheme provides a cost-parity hedge for flex-fuel engines, reducing gasoline imports and increasing domestic ethanol demand. Hybrids serve as a bridge technology, especially ethanol-compatible variants that achieve greater emission reductions compared to gasoline equivalents.
Diesel retains relevance in heavy-duty routes that span thousands of kilometers, while CNG finds niche use in municipal fleets where refueling networks exist. Fuel-cell exploration is nascent but gaining attention following Hyundai’s USD 1.1 billion hydrogen roadmap for Brazil. As import tariffs on C-segment BEVs rise to 35% by 2026, localized motor and battery plants are expected to protect affordability and accelerate adoption, gradually shifting the propulsion landscape of the South American automotive market.
By Sales Channel: Digital Transformation Accelerates
Dealer and retail sales still accounted for 53.02% of 2025 sales, but online direct-to-consumer models are forecasted to grow at an annual rate of 11.25% to 2031. Pandemic-era buying habits moved research and financing pre-approval online, and platforms now integrate virtual showrooms, AI-guided configurators, and instant trade-in quotes. Dealers are increasingly pivoting to experience centers that focus on after-sales care, extended warranties, and subscription services. Fleets and corporate buyers prioritize total cost of ownership and telematics integration, whereas OEM-direct sales remain largely confined to premium EV launches that bundle charging equipment and software.
Cross-border e-commerce is also emerging as websites harmonize pricing across Mercosur duties, providing regional shoppers with transparent, landed-cost quotes. As broadband penetration climbs, the digital channel’s share of the South American automotive market is expected to rise steadily, supported by fintech partnerships that deliver near-instant loan approvals and dynamic insurance offers.
By End User: Individual Consumers Drive Mobility Evolution
Private buyers generated 62.74% of 2025 vehicle demand, reflecting the enduring appeal of personal mobility amid improving employment and wage trends. Millennials and Gen Z urbanites, however, increasingly opt for ride-hailing or car-sharing services, propelling demand for mobility operators at an 11.12% CAGR. Small-enterprise fleets expand alongside e-commerce logistics, while large corporates deploy advanced telematics to optimize routing and fuel spend. Government fleets maintain steady replacement cycles driven by public service mandates and green procurement policies.
Shifts toward usage-based insurance, subscription models, and pay-per-mile financing encourage flexible ownership structures, gradually diversifying end-user profiles. These dynamics signal that the South American automotive market is evolving from a pure ownership paradigm to a hybrid mix of possession and shared access modes.
Geography Analysis
Brazil represented 60.85% of the South American automotive market size in 2025. Brazil’s commanding position rests on deep industrial roots, a supportive flex-fuel ecosystem, and high consumer volumes. Record OEM commitments, led by Stellantis’ EUR 5.6 billion pledge, underscore confidence in domestic scale even as interest rates challenge affordability. Meanwhile, escalating EV import duties have already catalyzed local battery and motor production, ensuring longer-term cost competitiveness within the South American automotive market.
Colombia, although smaller, is the standout growth engine, with a 12.74% CAGR. Colombia is translating manufacturing momentum and favorable demographics into double-digit sales growth, aided by strategic export corridors to Central America. Investment incentives, including free-trade zones and tariff relief on advanced components, further encourage vehicle assembly localization, positioning the country as an emerging sub-regional hub.
Argentina’s macro reset curbed inflation and stabilized the peso sufficiently to resurrect consumer confidence and unlock delayed fleet purchases. Mining-rich Chile and Peru use royalty revenues and aggressive depreciation schemes to seed EV adoption. At the same time, smaller economies such as Ecuador leverage transport-infrastructure upgrades to catalyze first-time ownership. These geographic vectors reveal a South American automotive market whose demand is concentrated in Brazil and increasingly diversified across fast-rising neighbors.
Regulatory Landscape
Regulation across South America is shaped by national technical rules and Mercosur trade disciplines, which affect local content requirements, import tariffs, and model approvals. In Brazil, the Rota 2030 - Mobilidade e Logistica framework (Decree 9.557/2018) continues to anchor industrial and technology requirements around energy efficiency, safety, and innovation. INMETRO also refreshed the 2026 cycle of the Programa Brasileiro de Etiquetagem Veicular (PBEV) for light vehicles in June 2026, tightening comparability on efficiency labeling across OEM portfolios. Safety compliance tracks national traffic authority requirements, with CONTRAN Resolution 756/2018 serving as a key reference point for impact-related safety requirements and implementation timelines.
Argentina maintains a structured homologation pathway for new vehicles through the Licencia de Configuracion de Modelo (LCM) managed by the Secretariat of Industry under Law 24.449, covering active and passive safety compliance. On emissions and environmental approvals, Argentina has moved toward greater acceptance of international certificates, with Resolution 263/2026 enabling environmental homologation using documentation from UN-recognized bodies (TRANS/WP29/343) or equivalent regimes such as US EPA and NHTSA. This reduces redundant local testing while keeping alignment with Euro 5a/Euro V equivalences for light and heavy vehicles, supporting cross-border commercialization within Mercosur by lowering administrative friction for OEMs and importers running regional platforms.
Value Chain Analysis
South America automotive value chains concentrate around Mercosur manufacturing hubs, led by Brazil and Argentina, where OEM assembly plants source local stamped parts, interiors, and chassis systems alongside imported semiconductors, electronics, and electrification components. Platform localization strategies are expanding through shared manufacturing footprints and alliances that shorten time-to-market and spread capex, illustrated by Renault and Geelys cooperation granting Geely access to Renaults Ayrton Senna Industrial Complex, and by Geelys 26.4% stake in Renault do Brasil through definitive agreements signed in November 2025. Dealer networks and aftersales infrastructure remain critical downstream assets, increasingly used as market-entry channels for new electrified brands.
Upstream dependency on imported chips and power electronics remains a structural constraint that is periodically amplified by geopolitics and logistics. In late 2025, semiconductor supply risk escalated after export restrictions affected Nexperia chips, prompting Brazilian government engagement and diplomatic intervention that helped ease the bottleneck, highlighting how production continuity can hinge on external component flows. Distribution and retail are also shifting as omnichannel selling expands, but physical dealer and service coverage still influences conversion, warranty execution, and residual values, especially outside major urban centers.
Competitive Landscape
The competitive arena has shifted from a tight oligopoly toward moderate concentration as Chinese newcomers, digital disruptors, and cross-OEM alliances gain share. High-profile collaborations such as GM-Hyundai and Renault-Geely highlight a strategic pivot toward shared architectures that reduce cost and accelerate launch cycles. Investment intensity is at an all-time high; Toyota’s USD 2 billion hybrid push and BMW’s USD 200 million tech upgrade signal that established brands are unwilling to cede ground.
White-space opportunities are most visible in rural distribution, mobility services, and premium electrified nameplates where European marques retain cachet. Digital retail giants like Kavak and MercadoLivre Auto are redrawing the dealer landscape by injecting AI-based pricing and seamless financing that compress gross margins but lift turnover. Meanwhile, supply-chain constraints spur vertical integration, with OEMs negotiating direct contracts for lithium, semiconductors, and bio-ethanol to shield production against volatility.
Regulatory frameworks, particularly Brazil’s decarbonization tax credits and looming CO₂ ceilings, favor players capable of flex-fuel hybrid or full-electric platform flexibility. As capacity additions outpace demand growth, price competition will intensify, raising the prospect of consolidation among mid-tier assemblers. Overall, technology prowess, local content, and channel agility will define leadership in the South America automotive market.
South America Automotive Industry Leaders
General Motors
Stellantis NV
Volkswagen AG
Toyota Motor Corporation
Ford Motor Company
- *Disclaimer: Major Players sorted in no particular order

Market Opportunities and Future Outlook
Manufacturing localization for electrified vehicles and key sub-systems is a clear opportunity area as Brazil tightens the link between market access and local production economics. Named programs and investments are already translating into new capacity and supplier-development needs: in February 2026, BYD moved toward 50% local parts at its Bahia complex while working up to a stated 300,000-unit annual capacity target, and in June 2026 GWM announced a second Brazil plant in Aracruz while outlining local content objectives. These moves create whitespace for regional suppliers across stamping, wiring harnesses, thermal systems, battery pack integration, and localized software calibration that fits flex-fuel and bio-hybrid drivetrains.
Policy-led demand shaping is also creating defined commercial pathways rather than broad-based incentives. In Argentina, the Ministry of Industry and Commerce formalized a 50,000-unit quota for duty-free imports of hybrids and EVs for the 2026 period via Resolution 513/2025, supporting OEM and importer strategies centered on limited-volume, higher-technology mixes while local assembly footprints scale. At the channel level, incumbents are monetizing dealer and service networks as distribution platforms for new electrified entrants, exemplified by Stellantis' commercial launch of Leapmotor in Brazil using its existing retail and aftersales footprint, enabling faster geographic coverage without building parallel networks.
Recent Industry Developments
- July 2026: Stellantis started serial production of the Jeep Avenger at the Porto Real (RJ) Automotive Pole in Brazil and opened a second production shift tied to a modernization program. The move adds localized bio-hybrid manufacturing capability and expands output capacity through additional staffing, strengthening Stellantis ability to refresh its product mix while using an existing industrial base.
- June 2026: General Motors initiated production of the Chevrolet Captiva EV at the Comexport Planta Automotiva do Ceara (PACE) facility in Ceara, Brazil. Local assembly supports faster market supply and provides a pathway to adapt product and specification to regional needs while reducing exposure to import logistics.
- March 2024: Stellantis announced a EUR 5.6 billion investment plan for South America covering 2025-2030. The commitment raised the pace of localized platform upgrades and supplier planning across Mercosur, influencing competitive intensity and the regions technology adoption roadmap.


Research Methodology Framework and Report Scope
Market Definition and Coverage
For this study, the South America automotive market is defined as the value generated from new vehicle sales across key South American countries, covering passenger and commercial mobility and the related vehicle categories captured in the report scope.
Scope exclusions: Used vehicle resale values and purely service-only revenue streams (such as stand-alone repair labor without parts) are kept outside the market value where they are not directly tied to new vehicle sales value.
Segmentation Overview
- By Vehicle Type
- Passenger Cars
- Hatchbacks
- Sedans
- SUVs and Crossovers
- MPVs
- Commercial Vehicles
- Light Commercial Pick-ups
- Light Commercial Vans
- Heavy Trucks
- Buses and Coaches
- Two-Wheelers
- Motorcycles
- Scooters/Mopeds
- Off-Highway Vehicles
- Agricultural Tractors
- Construction Equipment
- Passenger Cars
- By Propulsion Type
- Internal-Combustion (ICE)
- Gasoline
- Diesel
- Flexible-Fuel (Ethanol)
- Natural Gas (CNG/LNG)
- Electrified Vehicles
- Battery-Electric (BEV)
- Hybrid Electric (HEV)
- Plug-in Hybrid (PHEV)
- Fuel-Cell (FCEV)
- Internal-Combustion (ICE)
- By Sales Channel
- OEM / Direct Sales
- Dealer and Retail Sales
- Fleet and Corporate Sales
- Online Direct-to-Consumer
- By End User
- Individual / Private Consumers
- Small and Medium Enterprise Fleets
- Large Corporate Fleets
- Government and Municipal Fleets
- Mobility Operators (Ride-hailing, Car-sharing)
- By Country
- Brazil
- Argentina
- Chile
- Peru
- Colombia
- Ecuador
- Rest of South America
Data Sources, Market Sizing, and Validation
Desk Research
Desk research was used to build the fact base for production, trade, and demand signals that shape vehicle sales value across South America. We relied on public sources such as national vehicle registration statistics, customs trade data portals, central bank releases for inflation and FX, and transport or industry ministry publications that describe auto policies and incentives.
To convert these signals into a usable model, we also reviewed automaker investor presentations and annual filings, local association dashboards, and trusted press coverage for plant changes, launches, and pricing direction. Where needed, paid subscriptions covering company financials and intelligence, plus shipment-level import and export data and automotive sales trackers, were used to fill gaps and align timelines. The sources listed here are illustrative, and we reviewed many additional public references to cross-check datapoints and clarify assumptions.
Primary Interviews and Surveys
Fieldwork covers automakers, importers, dealers, suppliers, and fleet buyers in South America. Interviews and surveys clarify registration gaps, average selling prices, channel mix, propulsion demand, and differences between countries, allowing secondary inputs to be checked before the final model is set.
Distribution of primary research fieldwork respondents
| Company type | Respondent position |
|---|---|
| Top tier: 26% | CXOs: 18% |
| Mid tier: 49% | Functional/Unit leaders: 32% |
| Smaller Players: 25% | Managers: 50% |
Market-Sizing & Forecasting
Sizing started with a top-down build where production, import and export flows, and vehicle registration patterns were used to reconstruct the addressable new-vehicle demand pool by country, which is then translated into value using price ladders by vehicle class and propulsion mix. The totals were subsequently checked with selective bottom-up approximations, such as sampled model pricing times implied volumes, channel checks on dealer throughput, and a supplier-side sense check on build plans, before final numbers were locked.
Key inputs used in the model included new vehicle registrations, local assembly output and capacity utilization, import dependency by vehicle type, financing availability signals (rates and loan tenor direction), and exchange-rate timing for pricing pass-through. Because this is a market where inflation and FX can change reported values quickly, we applied scenario analysis around macro paths and then aligned the final forecast with what primary respondents indicated as the most likely base case. When bottom-up checks were incomplete for smaller countries, gaps were handled through proxy ratios based on comparable markets and then validated through trade and registration consistency.
Data Validation & Update Cycle
Outputs were validated through multiple cross-checks so that one data series could not dominate the final result by mistake. We compared modeled value trends against independent signals like registration growth, trade value movements, and major pricing announcements, and then investigated outliers until the variance had a clear explanation.
Before sign-off, the model and assumptions go through a step-by-step analyst review, followed by targeted re-contacts when a country-level number looks misaligned with known market events. The report is refreshed annually, and interim updates are made when material changes occur, such as policy shifts, plant closures, or sharp FX moves. Right before delivery, a final pass is completed so the latest public indicators are reflected.
Mordor Intelligence's South America Automotive Industry Outlook Market Sizing Compared With Other Published Estimates
Published market sizes for the South America automotive space can look far apart because groups often mix different geographies, add or remove aftermarket and mobility revenue, or apply different currency and inflation timing. Another common driver is whether estimates are built from vehicle-demand signals or from a broad industry revenue view that blends manufacturing and services.
The biggest gaps usually come from scope choices that sound similar but measure different things, like counting all Latin America versus South America only, or including used-vehicle and service revenue alongside new vehicle sales. Some estimates also lean on aggressive price growth assumptions during FX swings, while others use flat or averaged FX, which shifts the USD value even if unit volumes are similar. The table reflects these differences, where Latin America-wide revenue framing and broader channel definitions create higher totals, while a country-by-country demand pool anchored on registrations and trade values keeps the 2025 figure more traceable, a modeling choice applied by Mordor Intelligence.
Benchmark comparison
| Source | Market Size | Gaps in Research Methodology |
|---|---|---|
| Mordor Intelligence | USD 27.28 B (2025) | |
| Global Consultancy A | USD 174.73 B (2025) | Uses a Latin America-wide scope and a broader industry value view that can blend new vehicle sales with production, imports, and adjacent services, which inflates totals versus a South America-only demand-pool approach. |
| Industry Insights Group B | USD 357.48 B (2025) | Includes LATAM as a whole and extends coverage into distribution channels and mobility-related applications, so the measured revenue base is wider than new-vehicle sales value for South America. |
Overall, the spread is mainly explained by geography expansion from South America to Latin America and by whether adjacent revenue streams are bundled into the definition. When the scope is kept tight and the USD conversion is matched to the pricing and FX timing used in-country, the market size becomes easier to repeat and to reconcile with registrations, trade, and production signals.


Key Questions Answered in the Report
How large will vehicle sales in South America be by 2031?
At an 8.02% CAGR, the South America automotive market is projected to reach USD 43.33 billion in value by 2031, implying sustained unit growth over the period.
Which country is expanding fastest in regional auto demand?
Colombia is forecast to post a 12.74% CAGR through 2031 thanks to rapid industrialization and supportive assembly incentives.
How are online sales channels evolving?
Direct-to-consumer platforms are rising 11.25% annually as buyers seek transparent pricing and streamlined financing.
What policies are boosting alternative fuels?
Brazil’s E30 ethanol mandate and the wider “Fuel of the Future” framework are spurring flex-fuel uptake and slashing gasoline imports.
Which propulsion technology is gaining the most ground?
Battery electric vehicles are on an 11.15% CAGR, supported by local Chinese OEM production and royalty-funded purchase subsidies in mining-rich countries.
Page last updated on:




