United States Nuclear Imaging Market Size and Share
Market Overview
| Study Period | 2020 - 2031 |
|---|---|
| Base Year For Estimation | 2025 |
| Forecast Data Period | 2026 - 2031 |
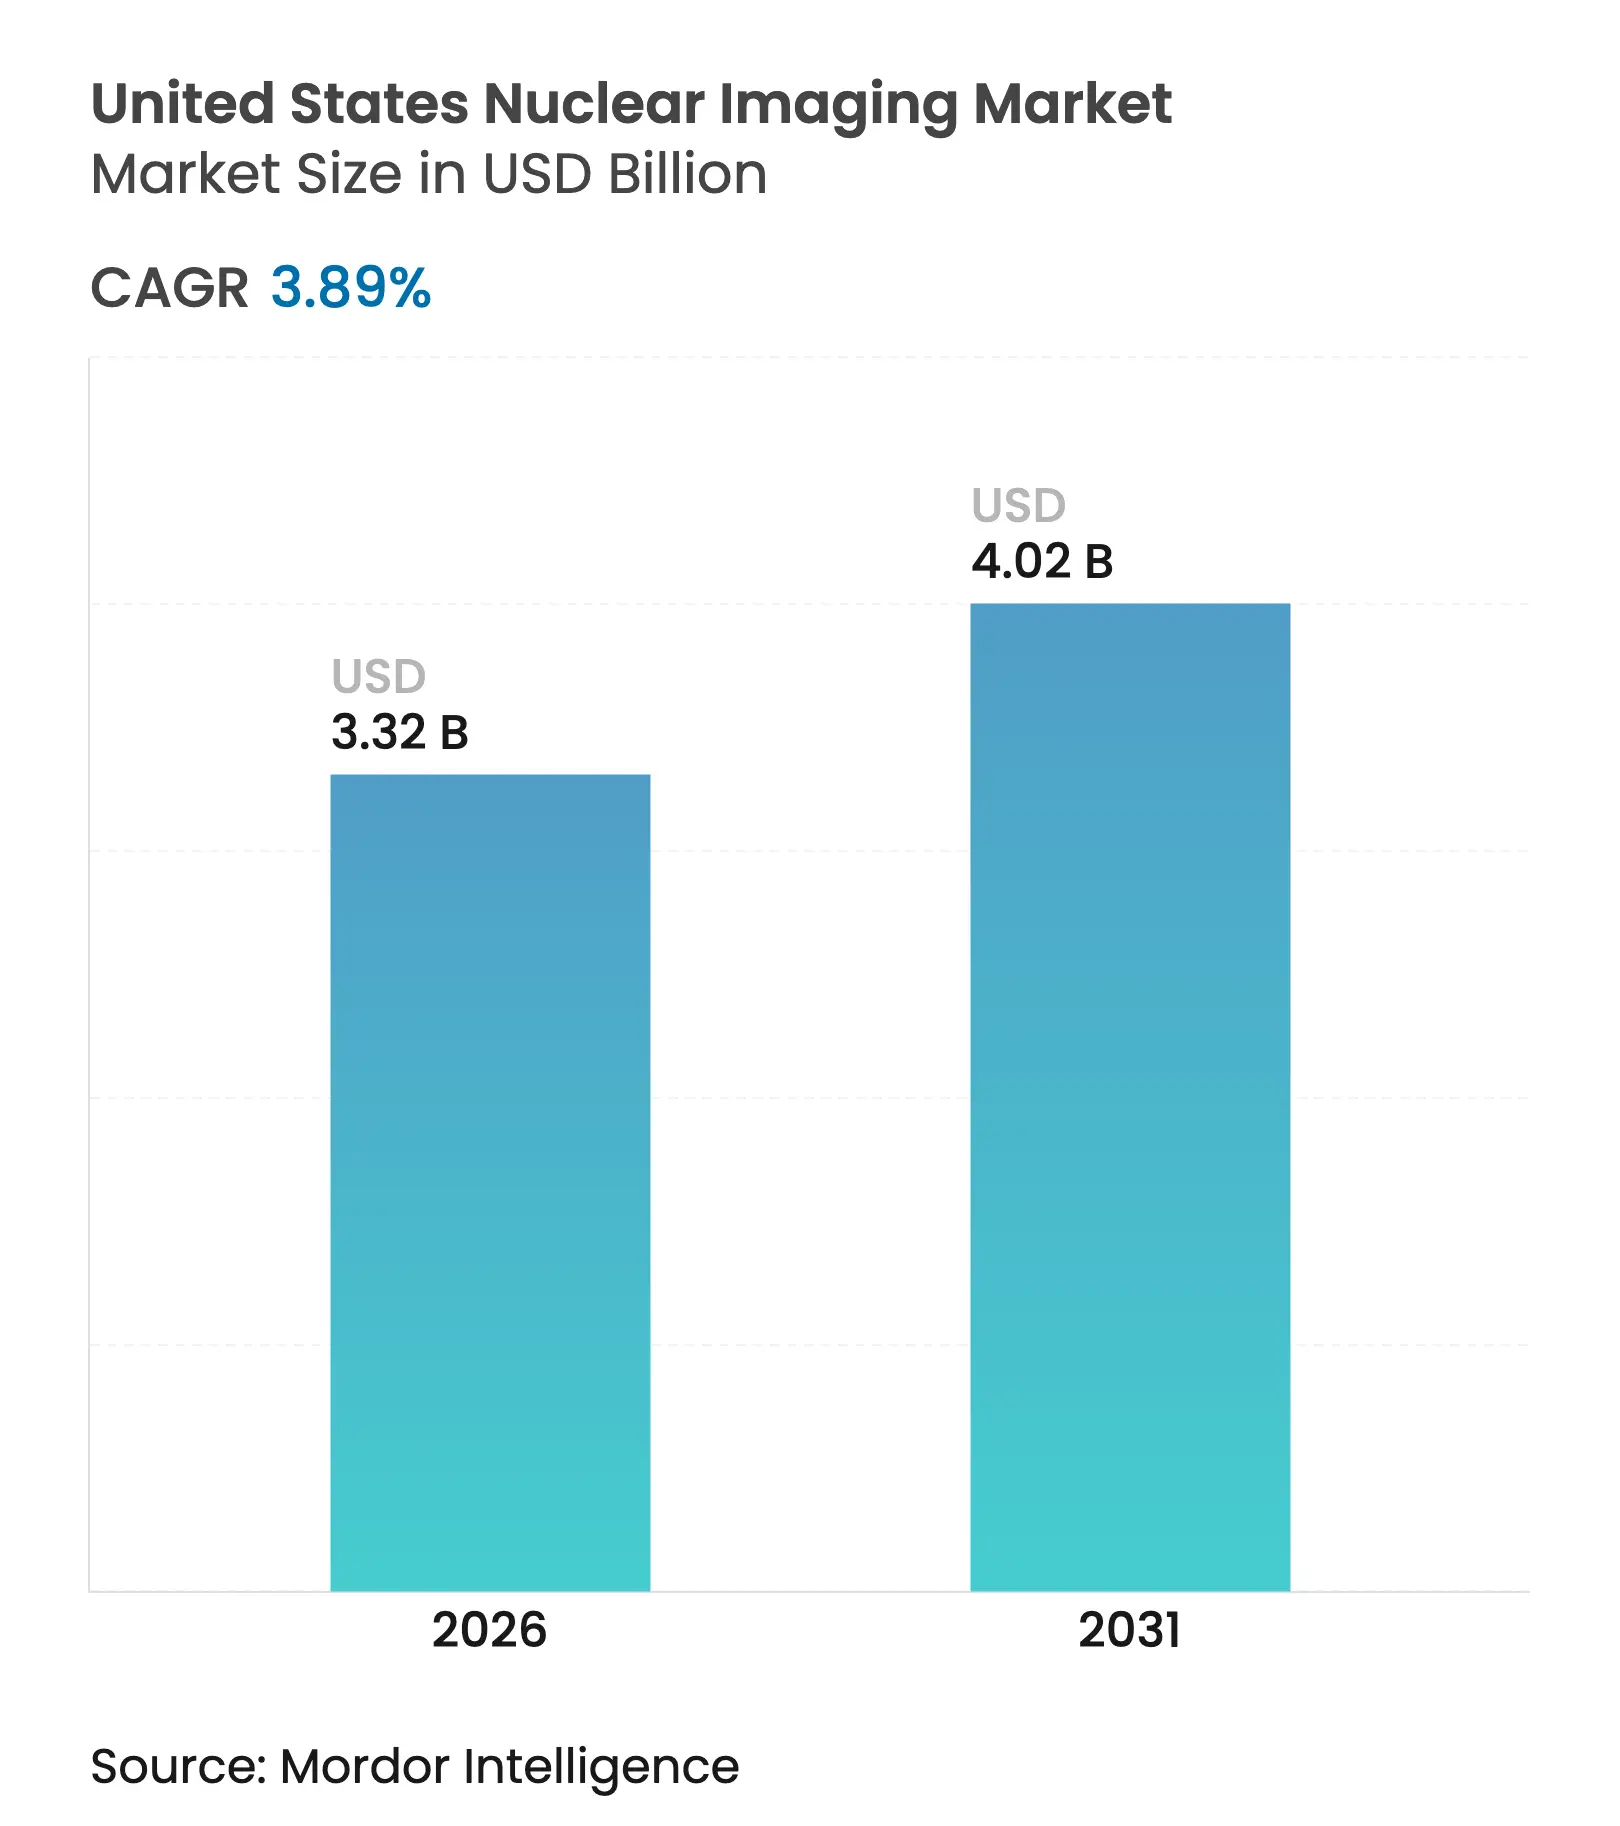
| Market Size (2026) | USD 3.32 Billion |
| Market Size (2031) | USD 4.02 Billion |
| Growth Rate (2026 - 2031) | 3.89 % CAGR |
| Market Concentration | Medium |
Major Players *Disclaimer: Major Players sorted in no particular order. Image © Mordor Intelligence. Reuse requires attribution under CC BY 4.0. |
United States Nuclear Imaging Market Analysis by Mordor Intelligence
United States nuclear imaging market size in 2026 is estimated at USD 3.32 billion, growing from 2025 value of USD 3.20 billion with 2031 projections showing USD 4.02 billion, growing at 3.89% CAGR over 2026-2031. Growth arises from the convergence of precision positron emission tomography (PET), solid-state detector upgrades, and expanding theranostic pipelines that together improve clinical outcomes and economics for American providers. Separate Medicare payment for diagnostic radiopharmaceuticals priced above USD 630 removes a historic reimbursement hurdle and encourages nationwide adoption of high-value PET tracers[1]Source: Centers for Medicare & Medicaid Services, “Calendar Year 2025 Medicare Physician Fee Schedule Final Rule,” cms.gov . FDA approvals of flurpiridaz F-18 for cardiac PET and novel prostate-specific membrane antigen (PSMA) agents accelerate the shift from single-photon emission computed tomography (SPECT) toward precision PET across hospitals and outpatient centers[2]Source: U.S. Food and Drug Administration, “FDA Approves Imaging Drug for Evaluation of Myocardial Ischemia and Infarction,” fda.gov . Meanwhile, supply-chain disruptions following the October 2024 molybdenum-99 outage underscore the strategic value of domestic isotope manufacturing and automated dose-production systems. Competitive intensity heightens as equipment suppliers vertically integrate into radiopharmaceutical production, while distributors invest in alpha-emitting isotopes to serve expanding oncology pipelines.
Key Report Takeaways
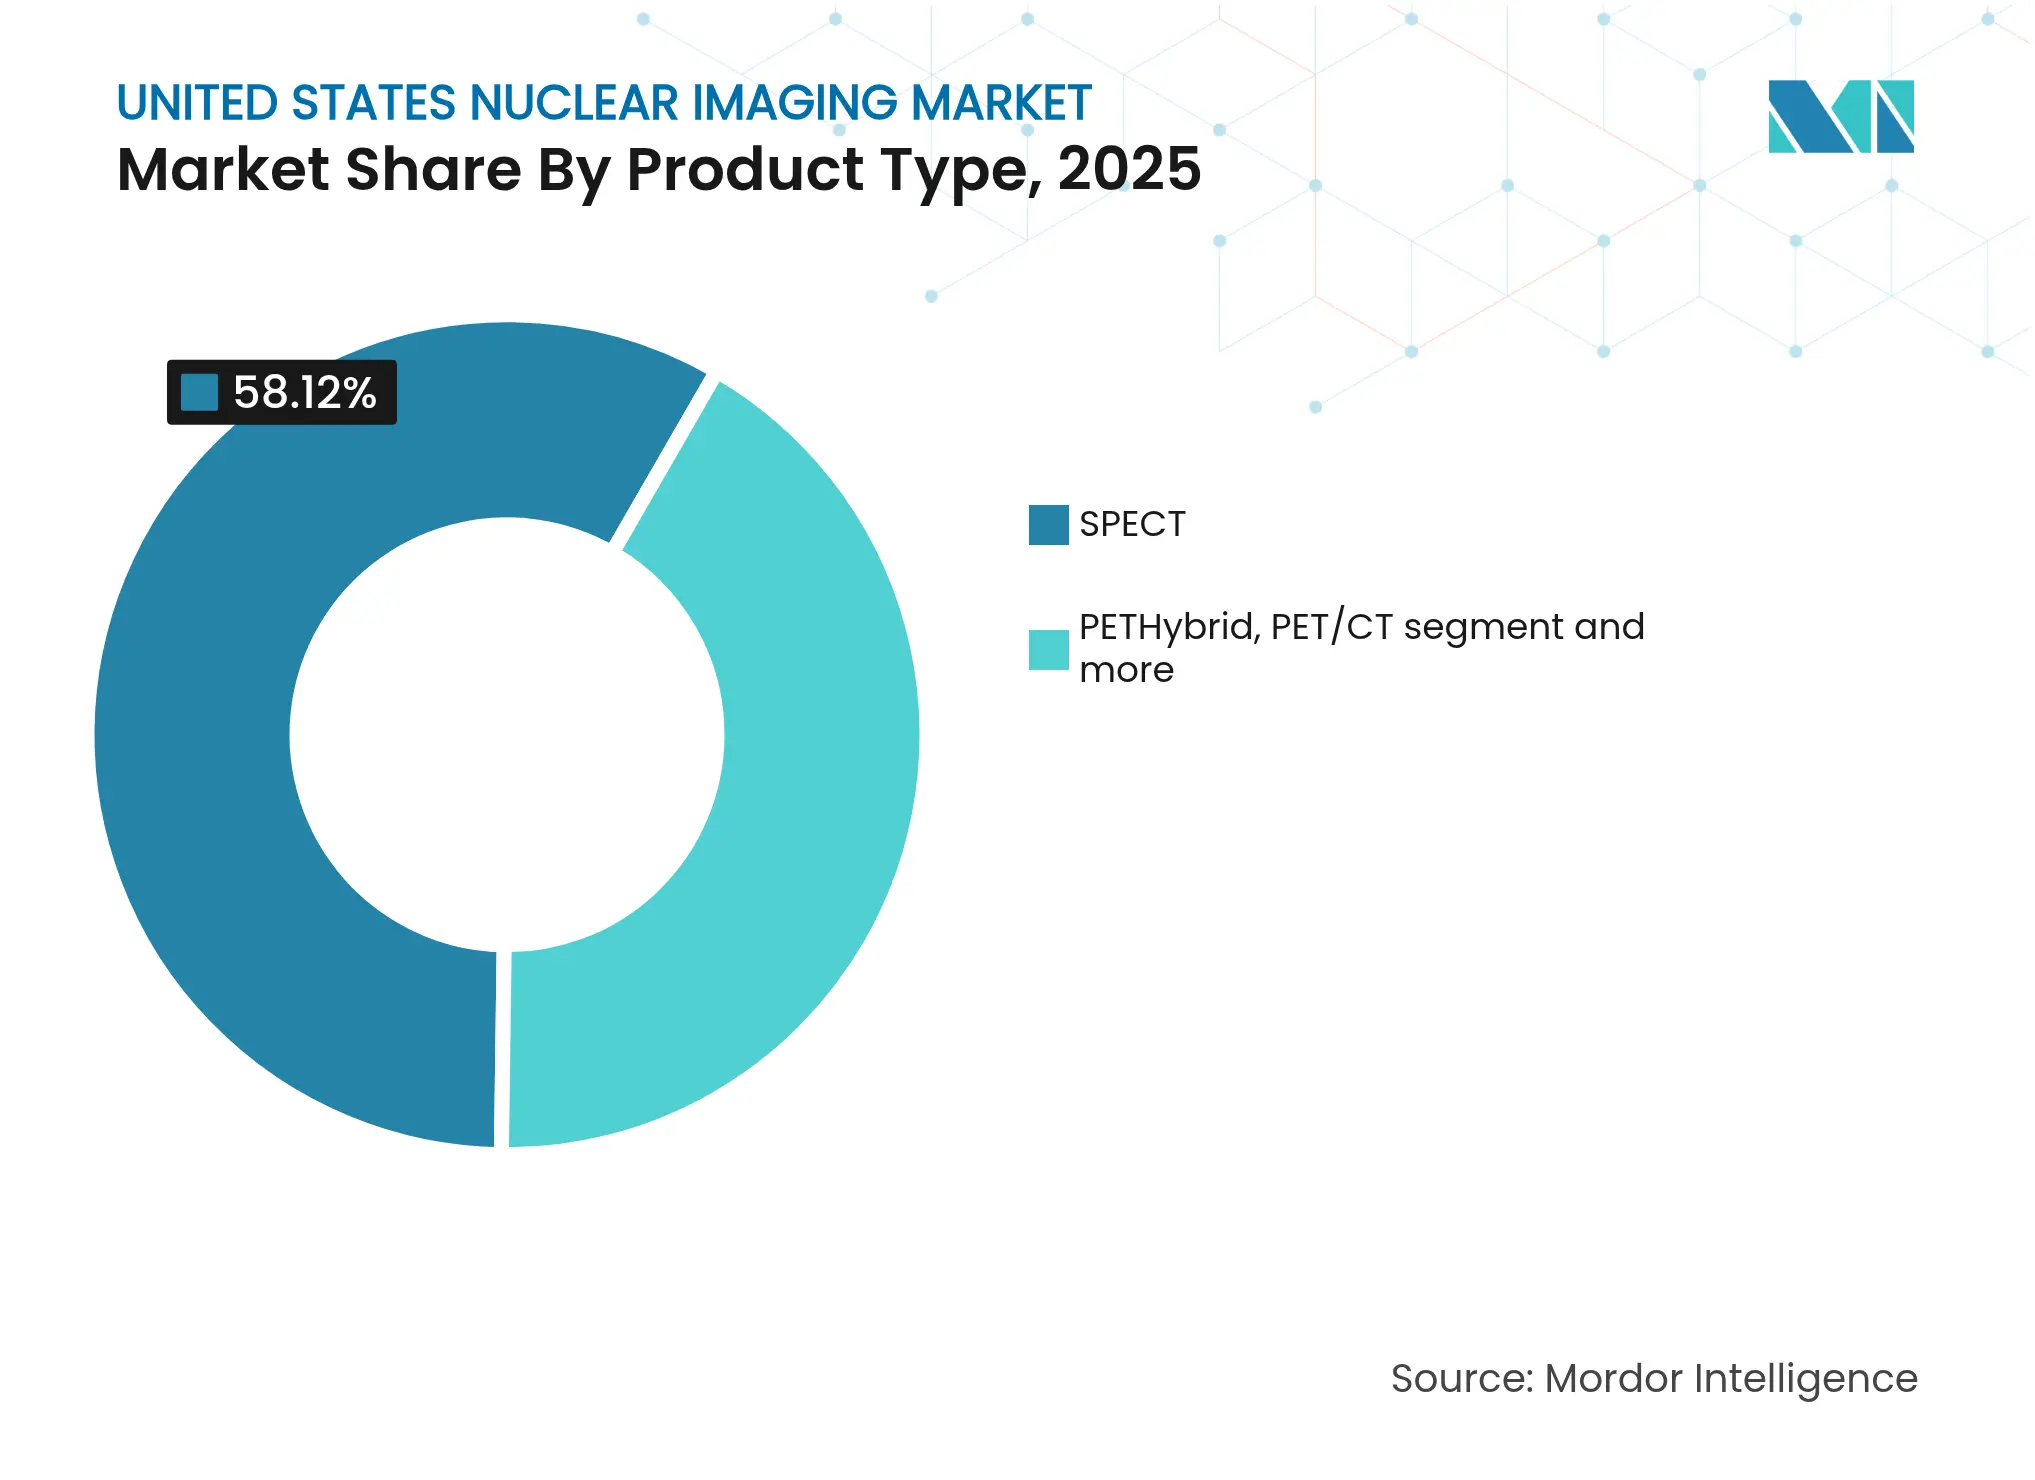
- By modality, SPECT led with 58.12% revenue share in 2025; PET/MRI is projected to advance at a 4.59% CAGR through 2031.
- By product type, imaging equipment accounted for 53.76% of the United States nuclear imaging market share in 2025, whereas radiopharmaceuticals are forecast to grow at a 4.92% CAGR to 2031.
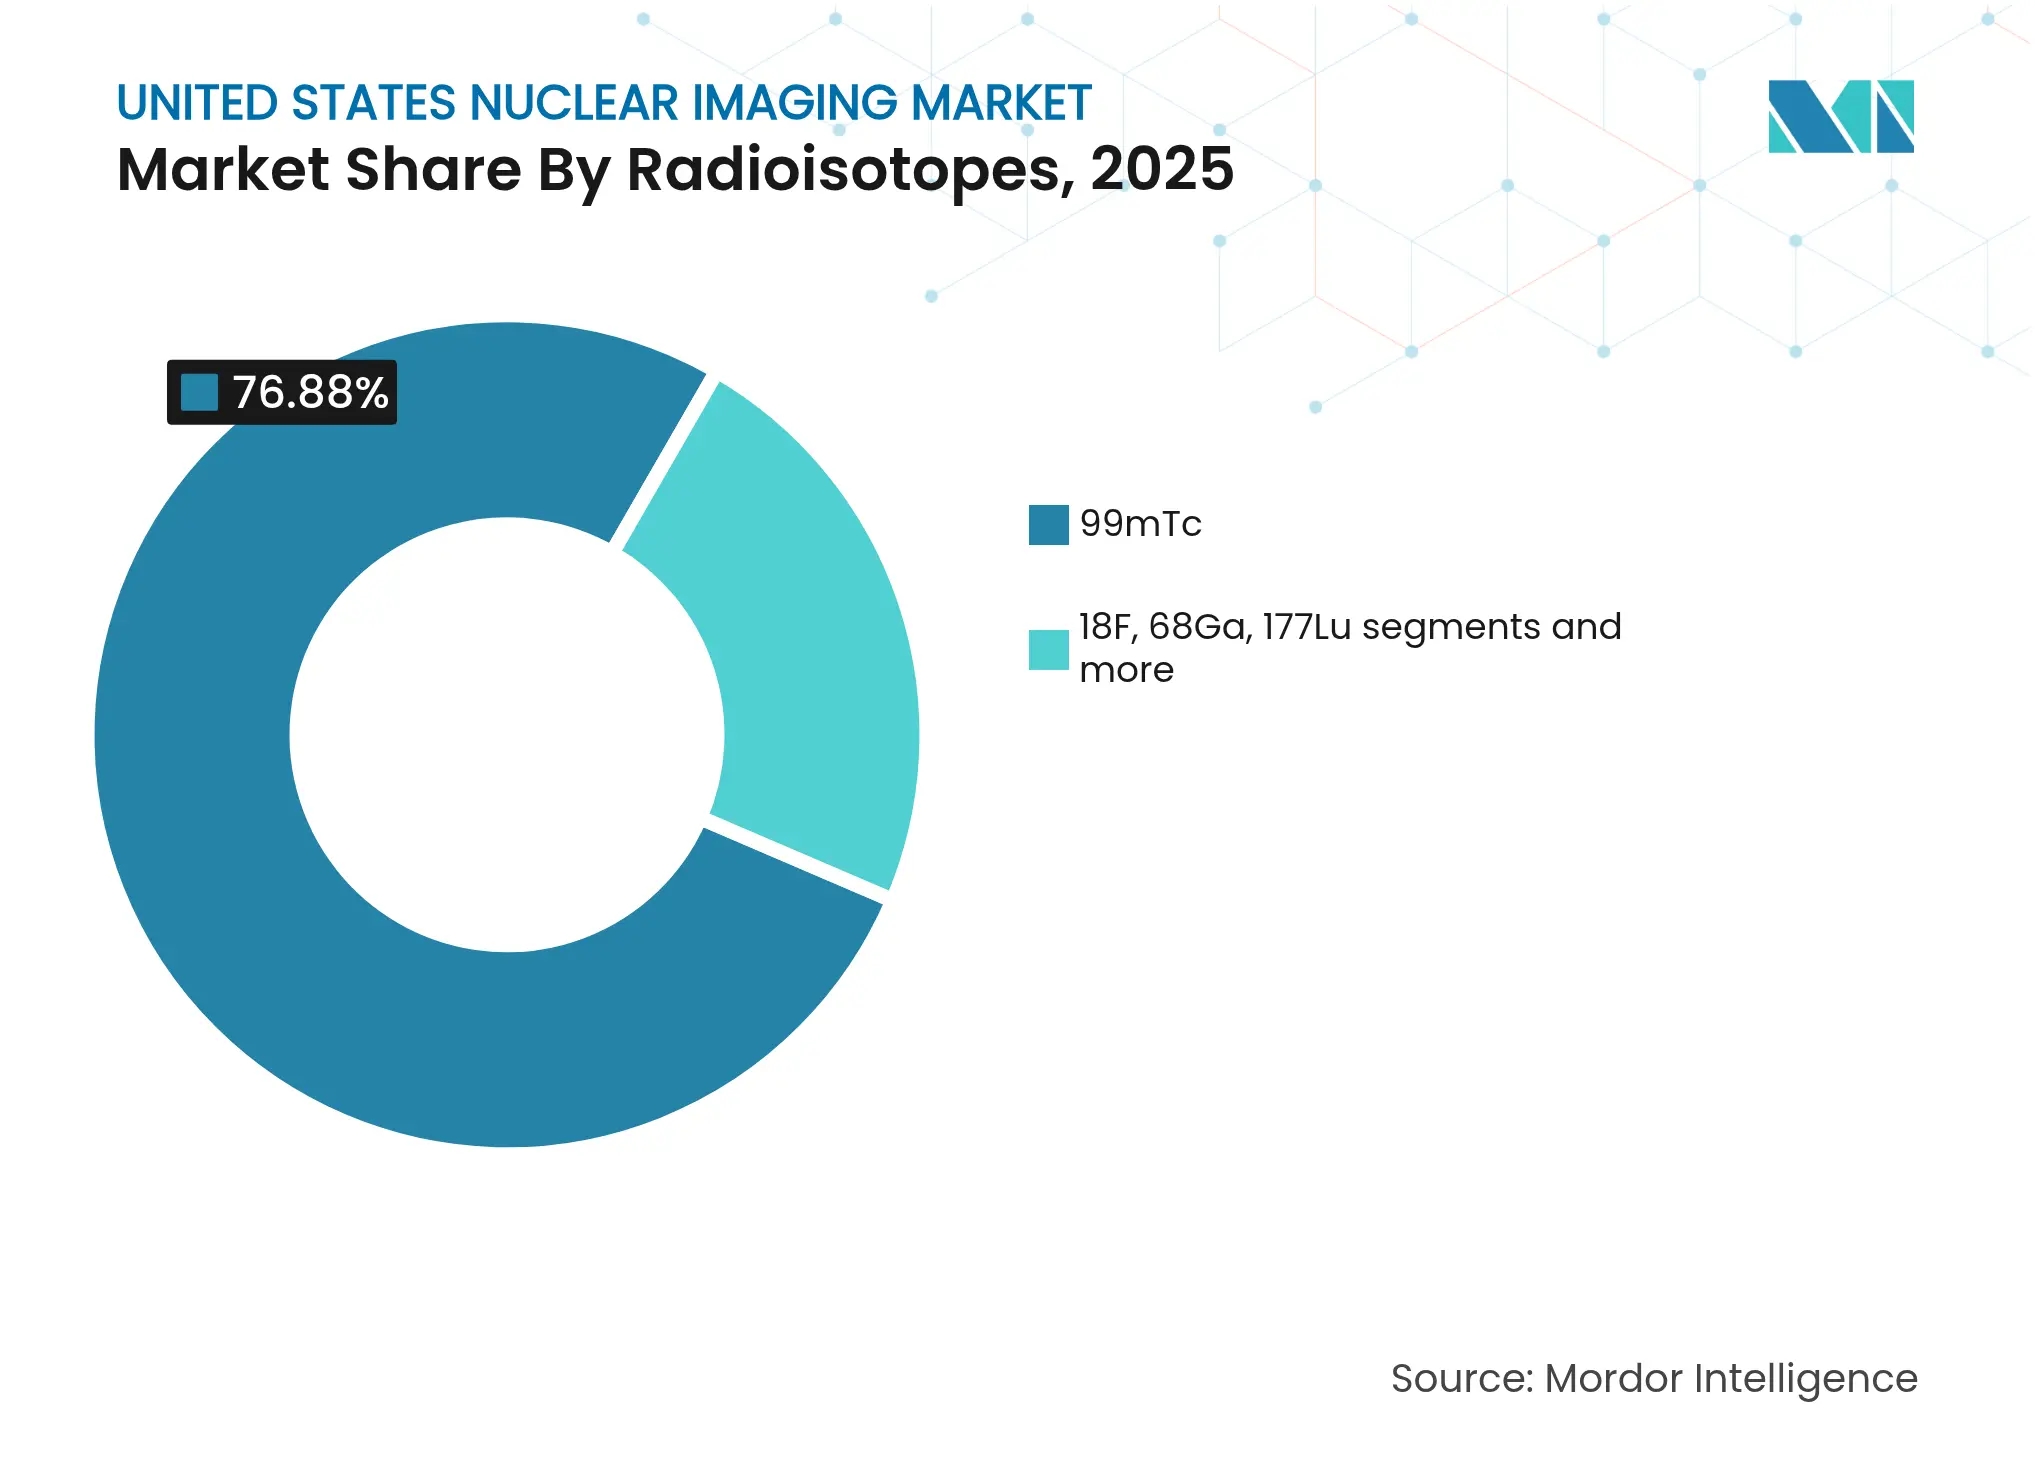
- By radioisotope, technetium-99m held 76.88% share of the United States nuclear imaging market size in 2025; lutetium-177 is set to expand at a 5.21% CAGR between 2026-2031.
- By application, cardiology captured 37.02% of the United States nuclear imaging market size in 2025, while oncology registers the fastest 5.54% CAGR through 2031.
Note: Market size and forecast figures in this report are generated using Mordor Intelligence's proprietary estimation framework, updated with the latest available data and insights as of 2026.
United States Nuclear Imaging Market Trends and Insights
Driver Impact Analysis
| Driver | (~) % Impact on CAGR Forecast | Geographic Relevance | Impact Timeline | |||
|---|---|---|---|---|---|---|
Rising cardiovascular disease burden spurring myocardial perfusion imaging demand Rising cardiovascular disease burden spurring myocardial perfusion imaging demand | +1.2% | Nationwide, with highest impact in aging population centers | Long term (≥ 4 years) | (~) % Impact on CAGR Forecast:+1.2% | Geographic Relevance:Nationwide, with highest impact in aging population centers | Impact Timeline:Long term (≥ 4 years) |
Rapid shift from SPECT to PET/CT for higher diagnostic accuracy Rapid shift from SPECT to PET/CT for higher diagnostic accuracy | +0.8% | Academic medical centers and large health systems leading adoption | Medium term (2-4 years) | |||
CMS reimbursement expansion for PET tracers & procedures CMS reimbursement expansion for PET tracers & procedures | +0.6% | All Medicare providers nationwide | Short term (≤ 2 years) | |||
Adoption of solid-state CZT detectors enabling low-dose, high-resolution scans Adoption of solid-state CZT detectors enabling low-dose, high-resolution scans | +0.4% | Major metropolitan areas and teaching hospitals | Medium term (2-4 years) | |||
FDA approval of Flurpiridaz F-18 extending cardiac PET into outpatient centers FDA approval of Flurpiridaz F-18 extending cardiac PET into outpatient centers | +0.7% | Nationwide expansion from initial academic centers | Medium term (2-4 years) | |||
Decentralized Tc-99m generator technology stabilizing isotope supply Decentralized Tc-99m generator technology stabilizing isotope supply | +0.3% | Addressing nationwide supply chain vulnerabilities | Long term (≥ 4 years) | |||
| Source: Mordor Intelligence | ||||||
Rising Cardiovascular Disease Burden Spurring Myocardial Perfusion Imaging Demand
Cardiovascular disease remains the leading cause of death in the United States, sustaining high procedure volumes for myocardial perfusion imaging across hospital networks. FDA clearance of flurpiridaz F-18 introduces an exercise-stress PET tracer with a 109-minute half-life that can be distributed regionally, broadening PET access beyond large academic centers. Medicare’s separate payment for high-cost tracers strengthens hospital economics, encouraging upgrades from SPECT to PET systems tailored for cardiology. Vendors promote ultra-low-dose protocols that lower radiation exposure, while AI segmentation tools automate perfusion quantification and shorten interpretation time. Together, these advances steer the United States nuclear imaging market toward value-based cardiac care models centered on diagnostic accuracy and cost efficiency.
Rapid Shift from SPECT to PET/CT for Higher Diagnostic Accuracy
Clinical evidence shows PET/CT delivers superior lesion detectability and quantitative accuracy, particularly in oncology staging, compared with legacy SPECT. The Biograph Trinion PET/CT launched in 2024 reduces energy consumption by 46% and incorporates AI-driven workflow tools that offset staffing shortages in busy imaging departments. Growing adoption of total-body PET platforms further boosts sensitivity and enables ultra-fast scans, however initial capital outlays remain large. Academic centers lead early uptake, creating a two-tier market where community hospitals retain SPECT for routine studies. Over time, reimbursement alignment and equipment life-cycle replacements are expected to migrate volumes to PET, elevating the United States nuclear imaging market.
CMS Reimbursement Expansion for PET Tracers & Procedures
As of 2025, Medicare pays separately for diagnostic radiopharmaceuticals costing more than USD 630, reversing prior bundled payment policies that discouraged hospital investment in innovative tracers. Commercial payers frequently mirror federal policy, broadening coverage across all 50 states. Blockbuster uptake of PSMA agents validates the new payment model; PYLARIFY surpassed USD 1 billion in 2024 US sales, showing strong provider demand once reimbursement hurdles lift. Companion diagnostics linked to radioligand therapies now benefit from aligned diagnostic and therapeutic payments, creating durable economic incentives and fueling expansion of the United States nuclear imaging market.
Adoption of Solid-State CZT Detectors Enabling Low-Dose, High-Resolution Scans
Cadmium-zinc-telluride (CZT) detectors deliver higher energy resolution than traditional sodium-iodide crystals, permitting 50% dose reduction without image degradation, as published in peer-reviewed US trials. These upgrades improve patient throughput and align with ALARA radiation guidelines. Siemens’ Symbia Evo and GE HealthCare’s latest SPECT cameras integrate self-calibration features that lessen technologist workload, crucial amid workforce shortages. Although acquisition costs remain premium, ROI improves in high-volume cardiac labs that can capitalize on rapid scan protocols.
Restraint Impact Analysis
| Restraint | (~) % Impact on CAGR Forecast | Geographic Relevance | Impact Timeline | |||
|---|---|---|---|---|---|---|
High capital cost of hybrid imaging systems & radiopharmaceuticals High capital cost of hybrid imaging systems & radiopharmaceuticals | -1.1% | Nationwide, with highest impact on rural and community hospitals | Long term (≥ 4 years) | (~) % Impact on CAGR Forecast:-1.1% | Geographic Relevance:Nationwide, with highest impact on rural and community hospitals | Impact Timeline:Long term (≥ 4 years) |
Short half-life isotope logistics disrupting scheduling Short half-life isotope logistics disrupting scheduling | -0.7% | Nationwide, affecting supply chain reliability | Medium term (2-4 years) | |||
Post-pandemic decline in hospital nuclear medicine volumes Post-pandemic decline in hospital nuclear medicine volumes | -0.5% | Major metropolitan areas and hospital systems | Short term (≤ 2 years) | |||
Shortage of certified nuclear pharmacists & technologists Shortage of certified nuclear pharmacists & technologists | -0.8% | Nationwide, most acute in specialized medical centers | Long term (≥ 4 years) | |||
| Source: Mordor Intelligence | ||||||
High Capital Cost of Hybrid Imaging Systems & Radiopharmaceuticals
A new PET/CT system can cost USD 225,000 – 750,000, excluding facility modifications, shielding, and tracer expenses that often exceed USD 1,000 per dose in complex oncology cases. Budget-constrained community hospitals struggle to justify such outlays when procedure volumes are modest. Leasing and mobile-service contracts provide interim access but may restrict scheduling flexibility and long-term economic efficiency. These factors slow the diffusion of hybrid imaging into low-density regions, tempering aggregate growth in the United States nuclear imaging market.
Short Half-Life Isotope Logistics Disrupting Scheduling
PET tracers such as fluorine-18 and gallium-68 decay rapidly, making imaging schedules sensitive to supply-chain disruptions. The October 2024 molybdenum-99 delay cut technetium supply by up to 100% for many US centers, forcing procedure cancellations and rescheduling. Federal funding for domestic reactors and cyclotrons aims to strengthen resilience; nonetheless, persistent logistics complexity hinders smaller sites lacking on-site production capabilities.
Segment Analysis
By Modality: PET Acceleration Challenges SPECT Leadership
SPECT held 58.12% share of the United States nuclear imaging market in 2025, reflecting its entrenched role in cardiovascular and bone imaging. However, PET/MRI is forecast to post the fastest 4.59% CAGR, propelled by flurpiridaz F-18’s 109-minute half-life and the clinical value of total-body systems for oncology and neurology. The United States nuclear imaging market size attributable to PET platforms is therefore poised to widen steadily over the forecast horizon.
FDA approval of flurpiridaz F-18 in September 2024 effectively eliminates a long-standing tracer gap in cardiac PET; centralized production now supports broader geographic reach, including rural sites previously limited to SPECT. Equipment manufacturers respond by integrating AI-enabled motion correction and deep-learning reconstruction algorithms that yield faster acquisitions at lower dose, making PET workflows more competitive. Still, sizeable capital expenditures and the necessity for technologist retraining moderate the pace of replacement, allowing SPECT to retain meaningful volumes through 2030.
Note: Segment shares of all individual segments available upon report purchase
By Product Type: Radiopharmaceutical Growth Outpaces Hardware
Imaging equipment generated 53.76% revenue in 2025, yet radiopharmaceuticals are projected to expand 4.92% annually, outstripping hardware sales and reshaping revenue mix within the United States nuclear imaging market. The rise of theranostic agents linked to targeted radioligand therapies underpins this trend.
The United States hosts 67 clinical-stage radioligand therapy assets, and blockbuster sales of PSMA and neuroendocrine tracers validate commercial potential. Cardinal Health, operating the nation’s largest distribution network, routinely delivers thousands of PET doses per day with 99% on-time accuracy, illustrating logistical scale advantages. Meanwhile, OEMs such as GE HealthCare launch compact cyclotrons like MINItrace Magni that enable in-house PET tracer production, letting tertiary centers internalize supply and margin. Consequently, radiopharmaceuticals will account for a rising portion of United States nuclear imaging market size by 2030.
By Radioisotope: Mo-99 Dominance Versus Lu-177 Momentum
Technetium-99m remained ubiquitous, covering 76.88% of procedures in 2025, yet lutetium-177 is forecast at 5.21% CAGR, driven by expanding prostate and neuroendocrine applications across US cancer centers. The October 2024 technetium shortage highlighted dependence on aging foreign reactors and accelerated domestic projects such as SHINE Technologies’ USD 32 million federal grant to build a new Mo-99 facility. Lutetium production investments, including Curium’s Dutch facility supported by US distribution agreements, seek to secure future demand.
Gallium-68 generator technologies and emerging isotopes such as copper-61 gain interest for decentralized production models, yet specialized handling limits Actinium-225 to a handful of academic trials. Strategic isotope diversification, therefore, remains a focal point for sustaining long-term growth of the United States nuclear imaging market.
Note: Segment shares of all individual segments available upon report purchase
By Application: Oncology Surges Ahead of Cardiology Base
Cardiology delivered 37.02% United States nuclear imaging market size in 2025 owing to entrenched SPECT perfusion protocols, but oncology’s 5.54% CAGR positions it as the main expansion engine through 2031. PSMA and somatostatin receptor agents advance precision therapy selection, supported by Medicare payment reform. The United States hosts 34 phase 3 theranostic trials, signaling ongoing pipeline depth that will reinforce oncology share gains.
Neurology benefits from ultra-high-resolution brain PET scanners such as NeuroEXPLORER, achieving 1.64 mm resolution useful for Alzheimer’s and Parkinson’s research. Endocrinology and inflammatory imaging remain niche but lucrative for developers of novel tracers targeting rare diseases, contributing incremental volume to the United States nuclear imaging market.
Geography Analysis
The United States nuclear imaging market reveals pronounced regional variability that mirrors healthcare infrastructure density. The Northeast and West Coast concentrate premium PET/CT installations within academic hubs such as Boston, New York, Los Angeles, and San Francisco, capturing the largest regional spending in 2024. These centers activate early roll-outs of total-body PET and hybrid PET/MR modalities, anchoring clinical trial activity and attracting venture funding.
Midwestern and Southeastern states post stronger CAGR profiles through 2030 as large integrated delivery networks in Texas, Florida, and Ohio finance equipment upgrades to serve aging populations with rising cardiovascular risk. The planned second reactor at the University of Missouri aims to shore up isotope availability for central states, mitigating the impact of overseas supply interruptions.
Rural regions lag due to limited capital budgets and workforce shortages; many retain SPECT as the primary modality and rely on weekly mobile PET services. CMS reimbursement changes offer uniform economic incentives, but operational constraints slow execution. Federal grants for technologist training and AI-assisted protocols seek to bridge the access gap, yet demographic dispersion continues to cap penetration in low-density markets. Consequently, the United States nuclear imaging market experiences simultaneous high-tech clustering and underserved pockets, creating opportunity for mobile imaging fleets and dose-on-demand generator technologies.

Reports are available across multiple geographies.
Gain in-depth market insights across regions to support informed decisions.
Competitive Landscape
Market Concentration
The United States nuclear imaging market is moderately consolidated, with the top seven companies controlling close to two-thirds of annual revenue. GE HealthCare, Siemens Healthineers, and Philips dominate equipment, each embedding artificial intelligence modules for automated image reconstruction and quality control. GE HealthCare’s USD 1.4 billion purchase of the remaining stake in Nihon Medi-Physics deepens its vertical integration from cyclotron manufacturing to dose distribution, strengthening US leadership.
Radiopharmaceutical specialists simultaneously scale production. Lantheus leverages its Life Molecular Imaging acquisition to broaden tracer R&D, while onsite manufacturing partner SHINE absorbs its SPECT business, allowing Lantheus to focus on PET and alpha agents. Cardinal Health’s network moves 10,000+ PET doses daily, creating significant moat through logistics. Curium intensifies lutetium capacity in Europe with secured US distribution, and Telix cooperates with Eckert & Ziegler on Actinium-225 supply for domestic trials.
Strategic differentiation centers on alpha-therapy readiness, AI workflow orchestration, and decentralized isotope production. Early-stage firms such as Clarity and NorthStar target copper and molybdenum supply niches, respectively, indicating a pipeline of challengers. Entry barriers remain high due to FDA compliance, radiation-safety regulations, and capital intensity, preserving incumbent advantage within the United States nuclear imaging market.
United States Nuclear Imaging Industry Leaders

*Disclaimer: Major Players sorted in no particular order
Recent Industry Developments
- March 2025: FDA broadens Pluvicto indication for metastatic castration-resistant prostate cancer following PSMAfore data
- March 2025: Telix secures FDA approval for Gozellix (TLX007-CDx) PSMA PET agent with extended shelf life
- March 2025: GE HealthCare partners with NVIDIA on autonomous imaging systems to address staffing shortages
Table of Contents for United States Nuclear Imaging Industry Report
1. Introduction
- 1.1Study Assumptions & Market Definition
- 1.2Scope of the Study
2. Research Methodology
3. Executive Summary
4. Market Landscape
- 4.1Market Overview
- 4.2Market Drivers
- 4.2.1Rising cardiovascular disease burden spurring myocardial perfusion imaging demand
- 4.2.2Rapid shift from SPECT to PET/CT for higher diagnostic accuracy
- 4.2.3CMS reimbursement expansion for PET tracers & procedures
- 4.2.4Adoption of solid-state CZT detectors enabling low-dose, high-resolution scans
- 4.2.5FDA approval of Flurpiridaz F-18 extending cardiac PET into outpatient centers
- 4.2.6Decentralized Tc-99m generator technology stabilizing isotope supply
- 4.3Market Restraints
- 4.3.1High capital cost of hybrid imaging systems & radiopharmaceuticals
- 4.3.2Short half-life isotope logistics disrupting scheduling
- 4.3.3Post-pandemic decline in hospital nuclear medicine volumes
- 4.3.4Shortage of certified nuclear pharmacists & technologists
- 4.4Value / Supply-Chain Analysis
- 4.5Regulatory Landscape
- 4.6Technological Outlook
- 4.7Porter’s Five Forces
- 4.7.1Threat of New Entrants
- 4.7.2Bargaining Power of Suppliers
- 4.7.3Bargaining Power of Buyers
- 4.7.4Threat of Substitutes
- 4.7.5Competitive Rivalry
5. Market Size & Growth Forecasts (Value)
- 5.1By Modality
- 5.1.1SPECT
- 5.1.2PET
- 5.1.3Hybrid PET/CT
- 5.1.4PET/MRI
- 5.2By Product Type
- 5.2.1Imaging Equipment
- 5.2.2Radiopharmaceuticals
- 5.3By Radioisotope
- 5.3.199mTc
- 5.3.218F
- 5.3.368Ga
- 5.3.4177Lu
- 5.3.5Others (64Cu, 89Zr, etc.)
- 5.4By Application
- 5.4.1Cardiology
- 5.4.2Oncology
- 5.4.3Neurology
- 5.4.4Endocrinology
- 5.4.5Others (Orthopedics, Inflammation, Vascular)
6. Competitive Landscape
- 6.1Market Concentration
- 6.2Market Share Analysis
- 6.3Company Profiles (includes Global level Overview, Market level overview, Core Segments, Financials as available, Strategic Information, Market Rank/Share for key companies, Products & Services, and Recent Developments)
- 6.3.1GE HealthCare
- 6.3.2Siemens Healthineers
- 6.3.3Philips Healthcare
- 6.3.4Canon Medical Systems
- 6.3.5Digirad Corporation
- 6.3.6Cardinal Health
- 6.3.7Curium Pharma
- 6.3.8Bracco Imaging S.p.A
- 6.3.9Jubilant Radiopharma
- 6.3.10Novartis (Advanced Accelerator Applications)
- 6.3.11Lantheus Holdings
- 6.3.12Blue Earth Diagnostics
- 6.3.13Telix Pharmaceuticals
- 6.3.14NorthStar Medical Radioisotopes
- 6.3.15Eckert & Ziegler Radiopharma
- 6.3.16SOFIE Biosciences
- 6.3.17Positron Corporation
- 6.3.18Positrigo AG
- 6.3.19United Imaging Healthcare
- 6.3.20Spectrum Dynamics
7. Market Opportunities & Future Outlook
- 7.1White-space & Unmet-need Assessment
Research Methodology Framework and Report Scope
Market Definitions and Key Coverage
Segmentation Overview
- By Modality
- SPECT
- PET
- Hybrid PET/CT
- PET/MRI
- SPECT
- By Product Type
- Imaging Equipment
- Radiopharmaceuticals
- Imaging Equipment
- By Radioisotope
- 99mTc
- 18F
- 68Ga
- 177Lu
- Others (64Cu, 89Zr, etc.)
- 99mTc
- By Application
- Cardiology
- Oncology
- Neurology
- Endocrinology
- Others (Orthopedics, Inflammation, Vascular)
- Cardiology
Detailed Research Methodology and Data Validation
Primary Research
Desk Research
Market-Sizing & Forecasting
Data Validation & Update Cycle
Why Mordor's US Nuclear Imaging Baseline Is Dependable
Benchmark comparison
| Market Size | Anonymized source | Primary gap driver | ||
|---|---|---|---|---|
USD 3.20 B (2025) | Mordor Intelligence | - | Anonymized source:Mordor Intelligence | Primary gap driver:- |
USD 6.01 B (2024) | Regional Consultancy A | Bundles therapy isotopes and combines equipment list prices with reimbursement totals | ||
USD 5.00 B (2024) | Global Consultancy B | Applies scanner shipment extrapolation without adjusting for multi-year replacement cycles | ||
USD 3.10 B (2024) | Trade Journal C | Uses hospital charge data, inflating price component by ~18% |