United States Non-alcoholic Steatohepatitis (NASH) Biomarkers Market Size and Share
Market Overview
| Study Period | 2020 - 2031 |
|---|---|
| Forecast Data Period | 2026 - 2031 |
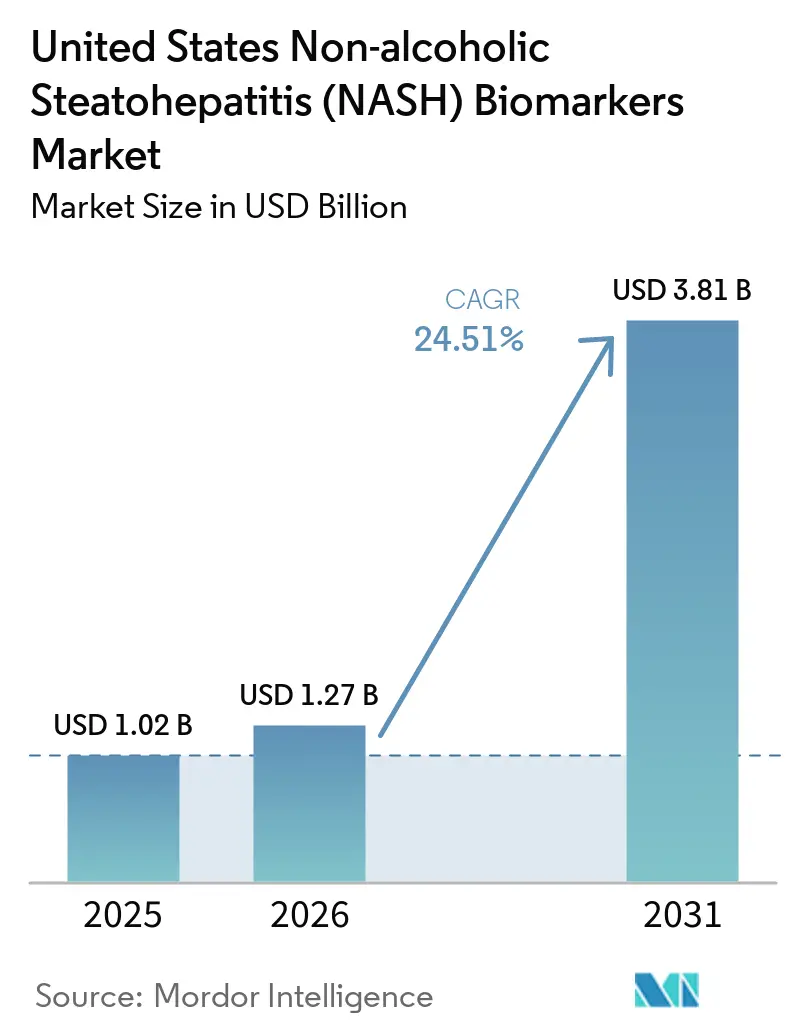
| Base Year Market Size (2025) | USD 1.02 Billion |
| Market Size (2026) | USD 1.27 Billion |
| Market Size (2031) | USD 3.81 Billion |
| Growth Rate (2026 - 2031) | 24.51% CAGR |
| Market Concentration | Medium |
Major Players *Disclaimer: Major Players sorted in no particular order Image © Mordor Intelligence. Reuse requires attribution under CC BY 4.0. | |
United States Non-alcoholic Steatohepatitis (NASH) Biomarkers Market Analysis by Mordor Intelligence
The United States Non-Alcoholic Steatohepatitis (NASH) Biomarkers Market size is projected to be USD 1.02 billion in 2025, USD 1.27 billion in 2026, and reach USD 3.81 billion by 2031, growing at a CAGR of 24.51% from 2026 to 2031. The March 2024 FDA approval of resmetirom for non-cirrhotic MASH with moderate-to-advanced fibrosis shifted clinical attention toward fibrosis staging and treatment eligibility assessment, which immediately strengthened the role of non-invasive biomarker testing in routine care. The addressable patient pool remains large, with 6 to 8 million Americans carrying NASH with moderate-to-advanced scarring, which supports sustained testing demand as treatment access widens and follow-up needs become more structured. The AASLD and EASL guideline updates reinforced this shift by formalizing stepwise non-invasive pathways built around FIB-4, ELF, elastography, and selected blood-based panels, which gives health systems a clearer framework for test adoption. The United States NASH biomarkers market is also being shaped by automated assay launches, AI-assisted pathology tools, and bundled diagnostic offerings, while inconsistent payer coverage for proprietary panels still limits full revenue conversion from rising clinical demand.
Key Report Takeaways
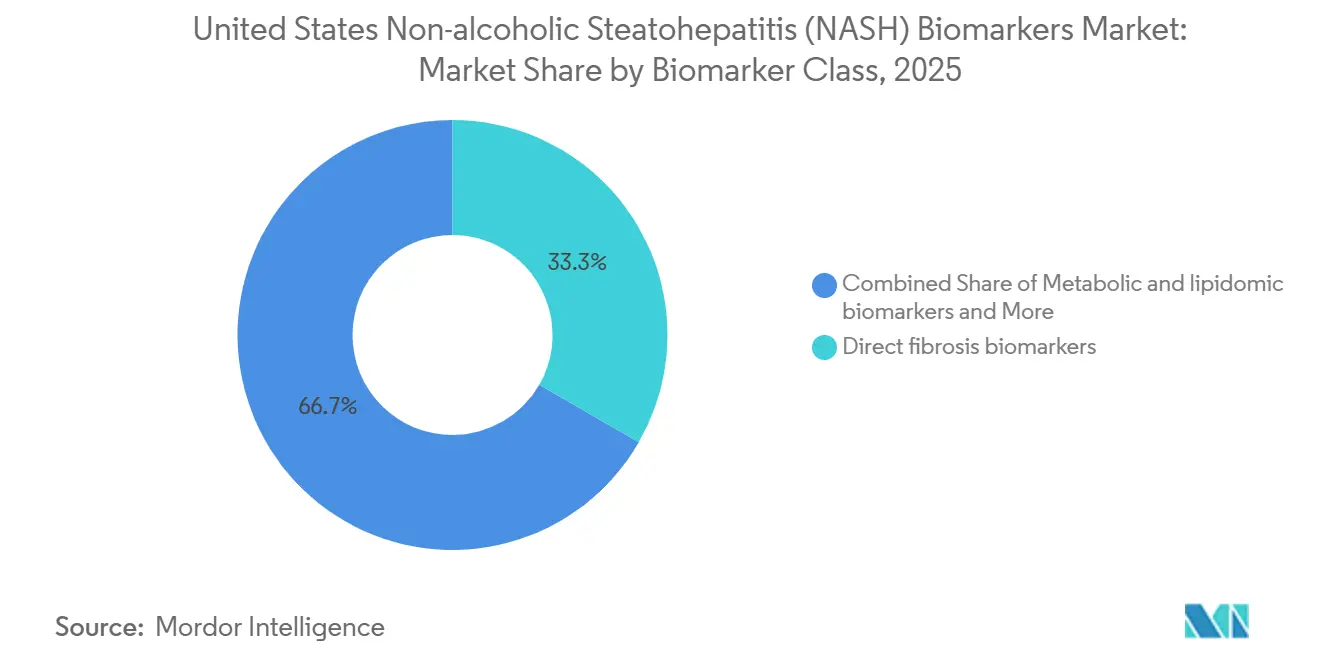
- By biomarker class, direct fibrosis biomarkers held 33.31% of the United States NASH biomarkers market share in 2025, while metabolic and lipidomic biomarkers are projected to expand at a 26.38% CAGR through 2031.
- By application, clinical diagnosis and staging accounted for 42.24% of the United States NASH biomarkers market size in 2025, while therapeutic monitoring and response assessment is forecast to grow at a 28.52% CAGR through 2031.
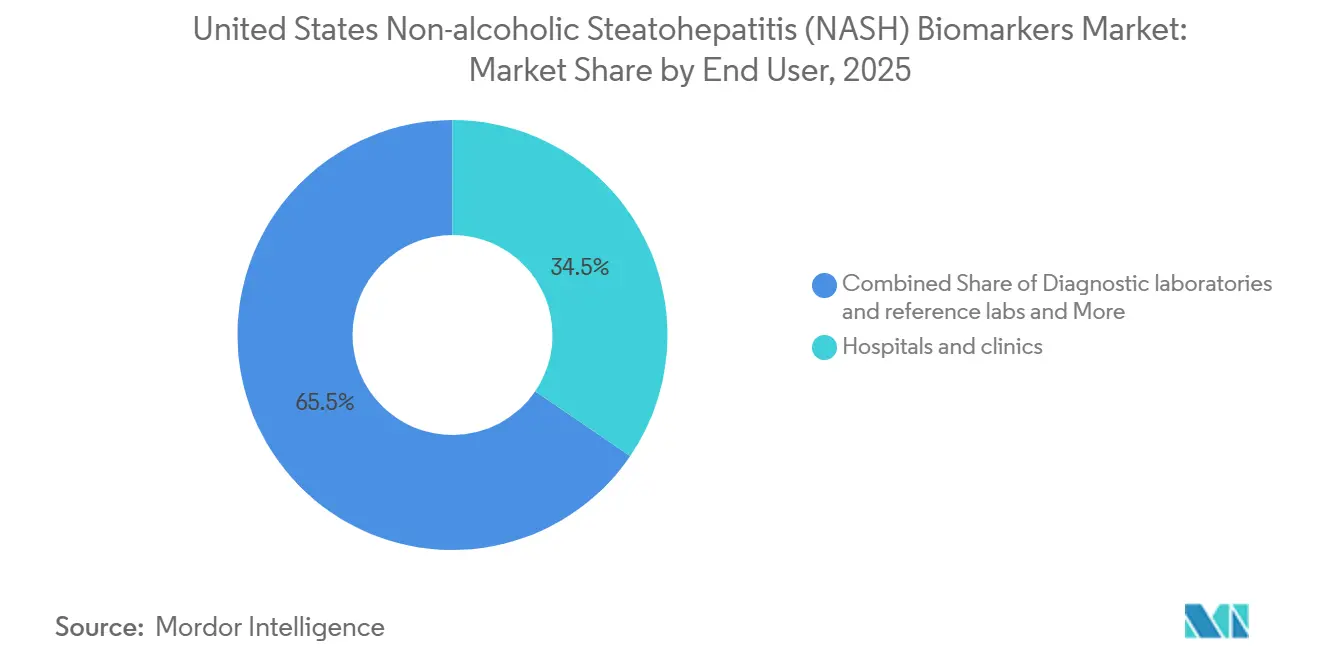
- By end user, hospitals and clinics represented 34.52% of the United States NASH biomarkers market size in 2025, while diagnostic laboratories and reference labs are expected to record the highest CAGR at 26.25% through 2031.
Note: Market size and forecast figures in this report are generated using Mordor Intelligence’s proprietary estimation framework, updated with the latest available data and insights as of January 2026.
United States Non-alcoholic Steatohepatitis (NASH) Biomarkers Market Trends and Insights
Drivers Impact Analysis*
| Driver | (~) % Impact on CAGR Forecast | Geographic Relevance | Impact Timeline |
|---|---|---|---|
| Rising MASH Therapy-Linked Fibrosis Testing Demand | +8.2% | National, with stronger early demand in hepatology hubs across the Northeast, Midwest, and West Coast | Short term (≤ 2 years) |
| Guideline-Backed Non-Invasive Triage Pathways | +5.5% | National, with faster rollout in large IDN-heavy states such as Texas, Florida, and California | Short term (≤ 2 years) |
| Pharma And CRO Biomarker-Enrichment Spending | +5.0% | National, with trial activity concentrated in Boston, San Diego, and the Research Triangle | Medium term (2-4 years) |
| Demand For Repeatable Biopsy-Sparing Monitoring | +3.5% | National, with stronger uptake in outpatient hepatology and endocrinology settings | Medium term (2-4 years) |
| VA And IDN Liver-Pathway Deployment | +2.0% | National, with meaningful relevance across VHA networks in the South and Midwest | Medium term (2-4 years) |
| Automated Assays And AI-Assisted Readouts | +2.5% | National, with spillover into hospital pathology and reference laboratory networks | Long term (≥ 4 years) |
| Source: Mordor Intelligence | |||
Rising MASH Therapy-Linked Fibrosis Testing Demand
The FDA approval of resmetirom in March 2024 created the first clear therapy-linked testing pathway for patients with non-cirrhotic MASH and moderate-to-advanced fibrosis. Because prescribing moved into real clinical practice without a universal biopsy requirement, blood-based and imaging-based tests became the practical gatekeepers for treatment eligibility in the United States NASH biomarkers market. That shift matters because a therapy decision now drives biomarker demand directly, rather than leaving testing tied mainly to specialist workups or clinical trials. As additional MASH therapies move closer to commercialization, each approval will widen the pool of patients needing non-invasive staging and repeat reassessment. This makes growth in the United States NASH biomarkers market cumulative, since every new treatment adds another layer of testing demand across diagnosis, access, and follow-up.
Guideline-Backed Non-Invasive Triage Pathways
The AASLD January 2025 guidance established FIB-4 as the preferred first-tier blood-based test for advanced fibrosis assessment, with ELF used as a sequential marker, which gave clinicians a national framework for structured triage. The same guidance stated revised FIB-4 thresholds and reported pooled specificity of 0.94 for ruling in advanced fibrosis, which supports broader use across primary care, endocrinology, and gastroenterology. AASLD also advised against using blood-based markers for tracking fibrosis progression over time, which leaves room for imaging platforms to expand within the monitoring portion of the United States NASH biomarkers market. The EASL-EASD-EASO 2024 guideline reinforced this direction through a multi-step pathway based on FIB-4, followed by elastography, and it also recognized NIS2+ for identifying at-risk MASH. Together, these documents reduce pathway ambiguity for large health systems and make testing volumes more durable even as the competitive mix of panels and platforms continues to change.
Pharma And CRO Biomarker-Enrichment Spending
MASH trials still depend heavily on biomarker-guided enrichment because biopsy-confirmed enrollment is slow, expensive, and inefficient without pre-selection tools. Labcorp stated that its MASH platform supported 31 active MASLD and MASH studies across more than 700 global trial sites and enrolled over 4,000 biopsy-confirmed patients, which shows the scale of sponsor reliance on biomarker-linked screening infrastructure. The FDA qualification of PathAI's AIM-MASH AI Assist in December 2025 added another efficiency layer by allowing more standardized histologic scoring support for Phase 2 and Phase 3 trials. Sponsors are also funding multiple non-invasive readouts in parallel, which raises per-trial biomarker spending even when the same program still uses biopsy endpoints. As a result, the pharma channel gives the United States NASH biomarkers market a revenue stream that is less dependent on near-term commercial prescribing and more tied to pipeline depth[1]Labcorp, “Testing for MASH and MASLD,” Labcorp, labcorp.com.
Demand For Repeatable Biopsy-Sparing Monitoring
Liver biopsy remains the histologic reference standard, but its risk profile makes repeated use difficult for patients who may need reassessment every 6 to 24 months during therapy. AASLD reported procedure-related bleeding in 0.2% of cases, severe bleeding in 0.01%-0.04%, and mortality in 0.0083%-0.01%, which underscores why repeat monitoring is moving toward non-invasive tools. The FDA acceptance of Echosens' Letter of Intent in September 2025 for FibroScan VCTE as a reasonably likely surrogate endpoint raised the strategic value of liver stiffness measurement for both trials and future care pathways. Perspectum also reported that an 80 ms reduction in cT1 predicted histological response in pooled interventional trial data, which gives imaging-based monitoring a practical benchmark for treatment follow-up. This supports a monitoring model in the United States NASH biomarkers market that can scale with therapy use without running into biopsy scheduling, patient tolerance, or procedural capacity limits[2]Echosens, “Statement on the Acceptance by the FDA of Echosens’ Letter of Intent for Drug Development Tool,” Echosens, echosens.com.
Restraints Impact Analysis*
| Restraint | (~) % Impact on CAGR Forecast | Geographic Relevance | Impact Timeline |
|---|---|---|---|
| Uneven Payer Reimbursement For Proprietary Panels | -3.5% | National, with tighter commercial coverage in parts of the Southeast and Mountain West | Short term (≤ 2 years) |
| Biopsy Still Anchors Some Confirmatory Decisions | -2.5% | National, with stronger constraints inside the VA health system | Medium term (2-4 years) |
| Obesity-Related Elastography And Discordance Limits | -1.8% | National, with heavier effect in the South and Appalachia where obesity prevalence is high | Medium term (2-4 years) |
| NASH To MASH Coding And Terminology Transition | -1.0% | National, with higher claims-denial risk in less-specialized billing environments | Short term (≤ 2 years) |
| Source: Mordor Intelligence | |||
Uneven Payer Reimbursement For Proprietary Panels
Commercial momentum has outpaced reimbursement alignment for many proprietary biomarker panels in the United States NASH biomarkers market. Blue Cross Blue Shield of Tennessee has excluded several hepatic fibrosis panels from coverage, while CMS proposed a MolDX framework that limits coverage to settings where FIB-4 and imaging elastography are indeterminate. In 2026, CMS established an initial pricing framework for NASHnext, but GENFIT described that step as an early milestone rather than full reimbursement maturity[3]GENFIT, “GENFIT Reports First Quarter 2026 Financial Information and Provides a Corporate Update,” Euronext, live.euronext.com. Emerging molecular and proteomic tests also face CLIA and MolDX technical assessment requirements before they can scale, which slows onboarding even when analytical performance is promising. This leaves developers with demand visibility but uneven revenue realization, especially when payer policy still favors simpler first-line pathways before proprietary panels are considered.
Biopsy Still Anchors Some Confirmatory Decisions
Non-invasive testing has expanded quickly, but biopsy still anchors some confirmatory and treatment decisions across important care settings. Perspectum cited the United States Department of Veterans Affairs as still requiring liver biopsy confirmation for resmetirom prescribing under current institutional guidance, which keeps a major integrated system on a more procedural pathway. AASLD also advised against using blood-based non-invasive tests for tracking fibrosis progression or regression over time, which preserves a role for biopsy or imaging escalation in follow-up decisions. The same guideline noted that many patients fall into indeterminate FIB-4 ranges, which means some care pathways still require imaging or tissue confirmation before a final decision is made. Even as AI-assisted pathology improves standardization, the continued clinical role of biopsy slows full substitution and keeps parts of the United States NASH biomarkers market tied to hybrid diagnostic workflows.
*Our forecasts treat driver/restraint impacts as directional, not additive. The impact forecasts reflect baseline growth, mix effects, and variable interactions.
Segment Analysis
By Biomarker Class: Fibrosis Panel Dominates, Metabolomics Gains Speed
Direct fibrosis biomarkers held 33.31% of the United States NASH biomarkers market size in 2025, which reflects their established role in specialist workups, risk stratification, and trial screening. This lead rests on the broad clinical familiarity of FIB-4, ELF, PRO-C3, and proprietary composite panels that are already embedded in hepatology practice and trial design. AASLD and EASL guidance supports that position because both frameworks place fibrosis-oriented tools early in the patient pathway, which keeps them close to referral and treatment decisions. Siemens Healthineers strengthened this class through automated ELF availability on Atellica IM and ADVIA Centaur systems, and Roche added routine lab scalability with the Elecsys PRO-C3 launch on cobas. Hepatocyte injury and apoptosis markers such as CK-18 and M30 remain relevant in exploratory and CRO settings, but their routine clinical pathway is still less established than fibrosis-focused tests in the United States NASH biomarkers industry.
Metabolic and lipidomic biomarkers are projected to expand at a 26.38% CAGR through 2031, which makes them the fastest-growing class within the United States NASH biomarkers market. OWLiver and related lipid-based approaches have shown clinically useful discrimination of at-risk MASH through combined lipid profiling and metabolic variables, which improves their relevance for upstream case finding. Proteomic models have also advanced quickly, with a serum protein risk score and broader multi-protein signatures posting strong validation performance across fibrosis stages. Inflammatory markers and genomic panels are still more common in enrichment and response-prediction work, where sponsors value multi-analyte depth even before routine reimbursement is available. Imaging biomarkers remain the most regulation-sensitive modality in the United States NASH biomarkers industry, because FDA movement on FibroScan VCTE and cT1 directly affects how monitoring tools compete with blood-based panels.


By Application: Diagnosis Leads, Monitoring Expands Fast
Clinical diagnosis and staging accounted for 42.24% of the United States NASH biomarkers market size in 2025, which reflects the immediate need to identify fibrosis stage before treatment initiation and specialist referral. Resmetirom's launch made this application commercially central because treatment access now depends on documenting disease severity through biopsy-free pathways whenever clinically acceptable. The opportunity remains large because millions of Americans are estimated to carry moderate-to-advanced scarring, while many eligible patients still remain outside structured hepatology evaluation. Screening and secondary risk stratification also matter because panels such as NIS2+ and NASHnext are designed to identify at-risk patients earlier in the care pathway, before hepatology referral becomes necessary. AASLD's endorsement of FIB-4 as a first-line screen broadened the testing base beyond liver specialists and widened the top of the funnel across primary care and endocrinology.
Therapeutic monitoring and response assessment is forecast to grow at a 28.52% CAGR from 2026 to 2031, which makes it the structural growth engine of the United States NASH biomarkers market. The case for this segment is straightforward because patients on therapy need repeat assessment of treatment effect, while repeated biopsy remains difficult to justify clinically and operationally. Perspectum reported that an 80 ms reduction in cT1 predicted histological response, which gives imaging-based monitoring a measurable threshold that clinicians and drug developers can use. Prometheus Laboratories also presented a next-generation blood-based non-invasive test at DDW 2026 that is intended to address both treatment-eligible patient identification and longitudinal monitoring. Academic and epidemiologic applications remain smaller in revenue terms, but they still help novel biomarker classes build the evidence base needed for later clinical adoption across the United States NASH biomarkers market.
By End User: Hospitals Drive Revenue, Reference Labs Gain Scale
Hospitals and clinics represented 34.52% of the United States NASH biomarkers market size in 2025, because they remain the main setting for hepatology consultation, elastography access, and treatment prescribing. Large health systems have an advantage when they embed liver disease pathways into routine metabolic care, since automated FIB-4 screening can convert high-risk patient populations into repeat biomarker testing demand. The NAFLD Clinical Care Pathway trial in VA primary care illustrates this logic, because it tests a structured referral and triage approach rather than relying on isolated physician behavior. Hospitals also benefit from being close to the treatment decision point, which lets them connect staging, counseling, imaging, and prescribing within one workflow. The pharma and CRO end-user group is smaller by revenue share, but it places the highest demands on reproducibility, qualification status, and platform compatibility.
Diagnostic laboratories and reference labs are projected to grow at a 26.25% CAGR through 2031, which reflects their scale economics and standardized assay infrastructure. High-throughput labs can run automated ELF, PRO-C3, and composite panels more efficiently than lower-volume hospital laboratories, which gives them an advantage as testing broadens. Their position is likely to strengthen as CMS reimbursement frameworks mature and prior authorization workflows become more standardized for clinically supported panels such as NASHnext. National lab networks also reach community practices more efficiently, which matters because much of the untreated patient pool sits outside academic hepatology centers. Academic institutes and public research programs contribute smaller volumes, but they remain important for validating the next generation of candidate markers that may later enter commercial testing menus.
Geography Analysis
The United States non-alcoholic steatohepatitis (NASH) biomarkers market covers the full national care system, but internal demand is uneven because disease burden, specialist density, and testing infrastructure vary sharply by region. The South and Appalachia carry a heavier metabolic liver disease burden, and the MASLD affects 35-48% of the United States adult population, while rates are especially elevated among Hispanic individuals concentrated in Texas, California, Florida, and the Southwest. This creates a pattern where clinical need is very high in several large population centers, yet standardized biomarker deployment is still uneven across lower-resource provider settings. The Veterans Health Administration represents a distinct sub-market because metabolic risk is common in the Veteran population and testing pathways can be scaled nationally once a clinical rule is set. A 2025 study in BMC Health Services Research found that only 10% of Veterans with elevated FIB-4 received a cirrhosis diagnosis, which points to a large pool of under-identified advanced disease that structured triage could surface.
The Northeast corridor shows the highest adoption intensity within the United States NASH biomarkers market because it combines dense hepatology capacity, strong academic referral networks, and a high concentration of CRO and pharma trial activity. Boston, New York, Philadelphia, and Baltimore stand out as centers where health systems can connect blood testing, imaging, biopsy review, and trial enrollment with less pathway fragmentation. The Midwest also performs strongly because academic hepatology programs and centralized laboratory workflows support national specimen routing from lower-density geographies into high-complexity testing platforms. This centralization matters because it lets regional demand convert into billable testing volume even when local specialist supply is limited.
The West Coast has become an important technology adoption cluster for the United States NASH biomarkers market because AI pathology, imaging analytics, and digital workflow companies are closely linked to trial sites and tertiary liver centers. California and the Pacific Northwest are particularly relevant for imaging-based monitoring adoption, since tertiary centers in these geographies are more likely to use advanced MRI-based liver assessment. At the same time, the VA biopsy requirement remains a large institutional barrier to wider biomarker adoption across its 170+ medical centers, which delays volume conversion in an otherwise high-need national network. These patterns keep the market national in scope but highly localized in realized commercial volume, with hepatology hubs and reference laboratory corridors leading early uptake.
Competitive Landscape
The United States NASH biomarkers market remains semi-fragmented, because no single company controls the full pathway from risk triage to treatment monitoring and biopsy-related endpoint support. Roche Diagnostics, Siemens Healthineers, Labcorp, GENFIT, PathAI, Echosens, and Perspectum each occupy different parts of the workflow, which spreads revenue across automation, blood testing, imaging, and digital pathology. Roche broadened its position in May 2026 with the Liver Disease Panel, a suite of digital algorithms that extends competition beyond individual analytes and toward pathway-level clinical decision support. Siemens Healthineers continues to compete through automated ELF deployment on established immunoassay platforms, which fits health systems that want standardized prognostic testing within existing lab infrastructure. Labcorp and GENFIT are tied through the commercial rollout of NASHnext, which shows how specialized biomarker developers are relying on large reference lab channels rather than building direct national sales models alone.
AI-assisted pathology is the clearest white-space opportunity in the United States NASH biomarkers market, because it improves consistency in a workflow that has historically been limited by reader variability and central pathology bottlenecks. PathAI holds a strong first-mover position after the FDA qualified AIM-MASH AI Assist in December 2025 for Phase 2 and Phase 3 MASH trials. Proteomic and transcriptomic entrants are publishing strong validation data, but most still lack the reimbursement standing, operational scale, and laboratory compliance base needed to compete at national reference lab economics. That gives incumbents with CLIA-ready infrastructure and payer experience a durable advantage even when smaller innovators lead on technical novelty.
Strategic partnering has become the main route to scale in the United States NASH biomarkers market because commercialization now depends on both validation strength and distribution reach. GENFIT's NIS technology licensing into Labcorp's NASHnext test is one example, and Roche's commercialization of PRO-C3 on cobas is another example of how platform owners are turning specialized markers into routine lab products. Echosens and Perspectum are also positioned to benefit if monitoring pathways continue shifting toward biopsy-sparing models, since both companies are tied to imaging-based response assessment. The next stage of competition is likely to center on who can combine reimbursement readiness, automated throughput, and longitudinal monitoring capability into one credible offering for health systems and payers.
United States Non-alcoholic Steatohepatitis (NASH) Biomarkers Industry Leaders
Siemens Healthineers
Labcorp
Quest Diagnostics
Echosens
Nordic Bioscience
- *Disclaimer: Major Players sorted in no particular order

Recent Industry Developments
- May 2026: Prometheus Laboratories presented translational research at Digestive Disease Week 2026 supporting a next-generation blood-based noninvasive test designed to close the diagnostic gap in treatment-eligible MASH patient identification and longitudinal monitoring. The test is targeted for launch later in 2026, addressing a recognized limitation of current panels in distinguishing at-risk MASH across the full therapeutic monitoring cycle.
- December 2025: The FDA qualified PathAI's AIM-MASH AI Assist through the Biomarker Qualification Program for use in Phase 2 and Phase 3 MASH clinical trials, making it the first AI-powered pathology tool to receive FDA DDT qualification. This qualification, following EMA CHMP approval in February 2025, enables single-pathologist standardized scoring of liver biopsies at scale across trials globally and reduces the inter-reader variability that has historically complicated biopsy-based MASH endpoint assessment.


United States Non-alcoholic Steatohepatitis (NASH) Biomarkers Market Report Scope
As per the scope of the report, non-alcoholic steatohepatitis (NASH) biomarkers are biological molecules found in blood, tissue, or other bodily fluids that indicate the presence or severity of NASH. NASH is a progressive form of non-alcoholic fatty liver disease characterized by liver inflammation and damage, which can lead to cirrhosis and liver failure. Biomarkers aid in diagnosis, monitoring disease progression, and evaluating response to therapy. They can include serum molecules such as liver enzymes, inflammatory markers, genetic variants, and imaging or histological features specific to NASH.
The United States non-alcoholic steatohepatitis biomarkers market is segmented by biomarker class, application, and end user. By biomarker class, the market includes direct fibrosis biomarkers, hepatocyte injury and apoptosis biomarkers, metabolic and lipidomic biomarkers, inflammatory biomarkers, genomic and transcriptomic biomarkers, imaging biomarkers, and others. By application, the segmentation covers clinical diagnosis and staging, screening and secondary risk stratification, therapeutic monitoring and response assessment, and other applications. By end user, the market is categorized into the pharmaceutical and CRO industry, hospitals and clinics, diagnostic laboratories and reference labs, and other end users. For each segment, the market size and forecast are provided in terms of value (USD).
| Direct fibrosis biomarkers |
| Hepatocyte injury and apoptosis biomarkers |
| Metabolic and lipidomic biomarkers |
| Inflammatory biomarkers |
| Genomic and transcriptomic biomarkers |
| Imaging biomarkers |
| Others |
| Clinical diagnosis and staging |
| Screening and secondary risk stratification |
| Therapeutic monitoring and response assessment |
| Other Applications |
| Pharmaceutical and CRO industry |
| Hospitals and clinics |
| Diagnostic laboratories and reference labs |
| Other End Users |
| By Biomarker Class | Direct fibrosis biomarkers |
| Hepatocyte injury and apoptosis biomarkers | |
| Metabolic and lipidomic biomarkers | |
| Inflammatory biomarkers | |
| Genomic and transcriptomic biomarkers | |
| Imaging biomarkers | |
| Others | |
| By Application | Clinical diagnosis and staging |
| Screening and secondary risk stratification | |
| Therapeutic monitoring and response assessment | |
| Other Applications | |
| By End User | Pharmaceutical and CRO industry |
| Hospitals and clinics | |
| Diagnostic laboratories and reference labs | |
| Other End Users |


Key Questions Answered in the Report
What is the forecast outlook for United States NASH biomarkers through 2031?
The sector was valued at USD 1.02 billion in 2025 and is projected to reach USD 3.81 billion by 2031 at a 24.51% CAGR, supported by therapy-linked testing and guideline-backed non-invasive pathways.
Which biomarker class leads current revenue in United States NASH biomarkers?
Direct fibrosis biomarkers led with 33.31% share in 2025 because FIB-4, ELF, PRO-C3, and related panels are closest to treatment access and specialist decision-making.
Which application is expanding the fastest in this field?
Therapeutic monitoring and response assessment is the fastest-growing application, with a projected 28.52% CAGR through 2031, because treated patients need repeat biopsy-sparing follow-up.
Why are reference laboratories gaining ground in NASH biomarker testing?
Diagnostic laboratories and reference labs are forecast to grow at 26.25% CAGR through 2031 since they offer automated throughput, lower marginal testing costs, and established billing infrastructure.
What is the biggest reimbursement challenge for proprietary MASH panels in the United States?
Coverage remains uneven because some commercial payers exclude certain proprietary panels, and CMS still favors a sequential pathway where first-line tools such as FIB-4 and elastography come before broader panel use.
How is AI changing biopsy-related assessment in MASH clinical trials?
PathAI's AIM-MASH AI Assist became the first AI-powered pathology tool qualified by the FDA for Phase 2 and Phase 3 MASH trials in December 2025, improving scoring consistency and reducing reader variability.
Page last updated on:


