
Liver Disease Diagnostics Market Size and Share
Market Overview
| Study Period | 2020 - 2031 |
|---|---|
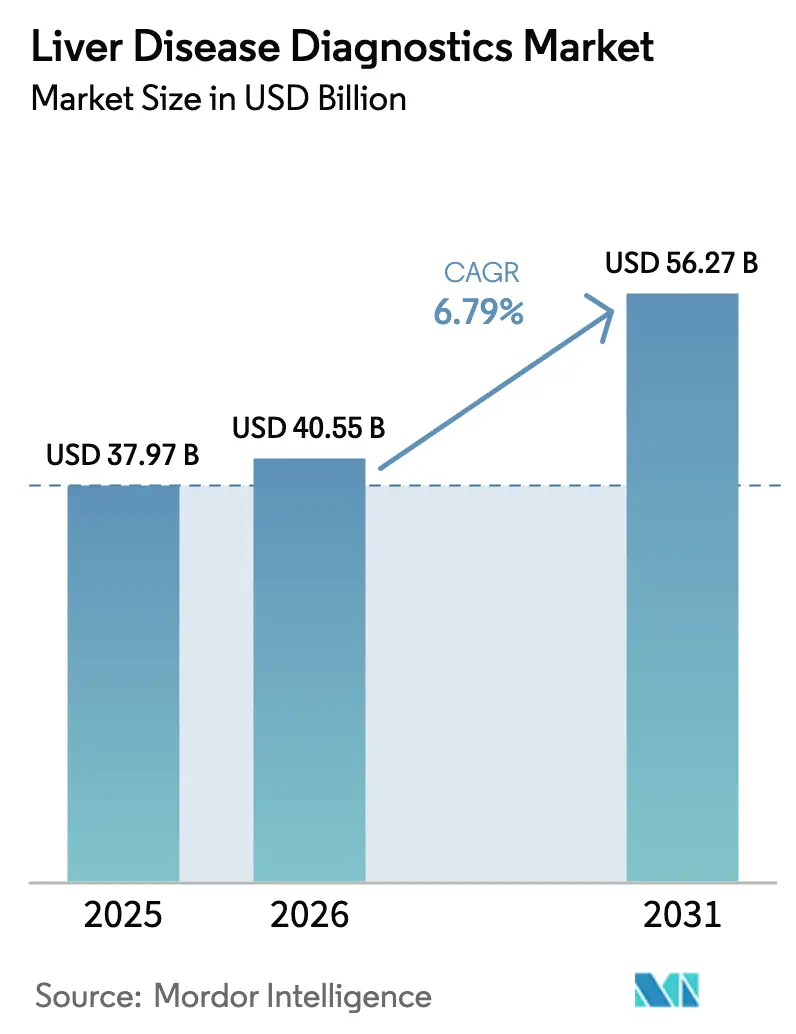
| Market Size (2026) | USD 40.55 Billion |
| Market Size (2031) | USD 56.27 Billion |
| Growth Rate (2026 - 2031) | 6.79 % |
| Fastest Growing Market | Asia-Pacific |
| Largest Market | North America |
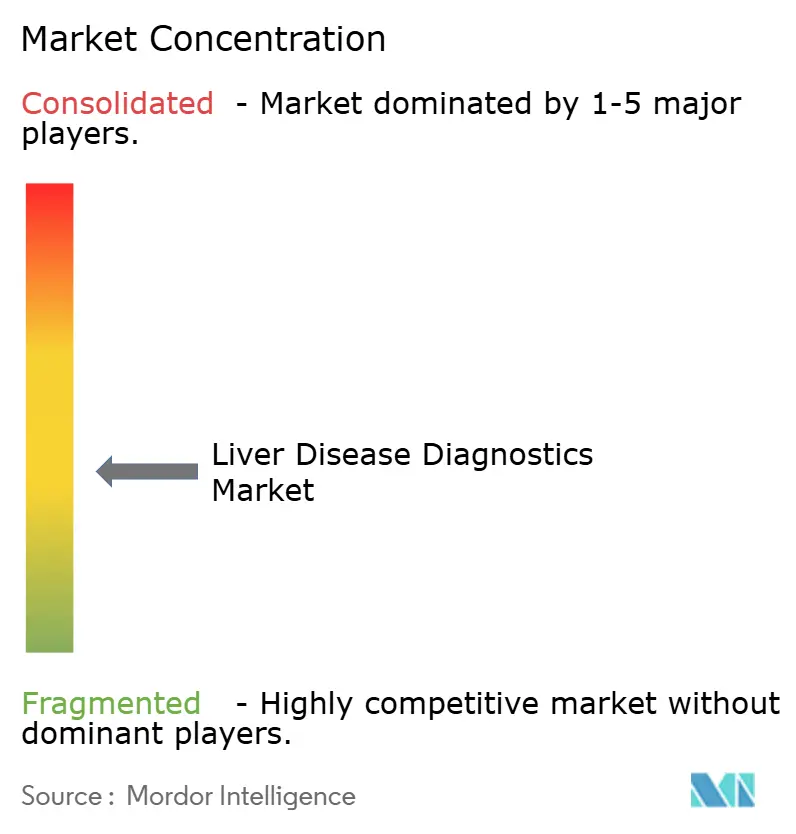
| Market Concentration | Medium |
Major Players *Disclaimer: Major Players sorted in no particular order Image © Mordor Intelligence. Reuse requires attribution under CC BY 4.0. | |
Liver Disease Diagnostics Market Analysis by Mordor Intelligence
The liver disease diagnostics market size in 2026 is estimated at USD 40.55 billion, growing from 2025 value of USD 37.97 billion with 2031 projections showing USD 56.27 billion, growing at 6.79% CAGR over 2026-2031. Heightened global prevalence of metabolic dysfunction–associated steatotic liver disease (MASLD), wider reimbursement for non-invasive tests, and rapid regulatory clearances such as the first point-of-care Hepatitis C RNA assay approved by the U.S. FDA in June 2024 underpin this trajectory.[1]U.S. Food & Drug Administration, “FDA Permits Marketing of First Point-of-Care Hepatitis C RNA Test,” fda.gov Vendors are racing to shorten turnaround times, illustrated by Roche’s 18-minute Elecsys PRO-C3 fibrosis test launched in May 2025. AI-driven risk-stratification tools embedded in electronic health records are surfacing previously undiagnosed cases, while government screening mandates in the United States and the United Kingdom normalize population-level testing.[2]U.S. Department of Health & Human Services, “Viral Hepatitis National Strategic Plan,” hhs.gov The pivot from inpatient biopsies to outpatient elastography lowers procedure costs and reduces patient anxiety, creating ample headroom for portable devices that combine ultrasound guidance with shear-wave measurements.
Key Report Takeaways
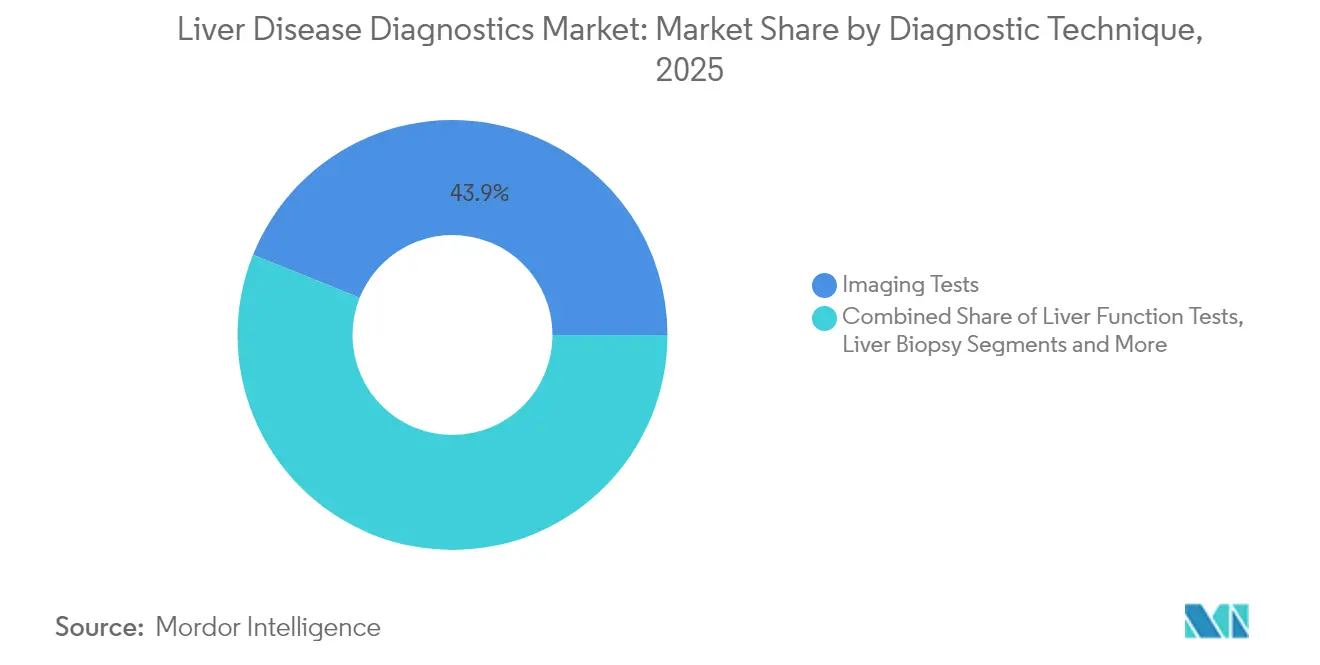
- By diagnosis technique, imaging tests led with 43.92% of liver disease diagnostics market share in 2025, while non-invasive elastography devices are forecast to expand at an 8.06% CAGR to 2031.
- By disease type, MASLD captured 33.41% share of the liver disease diagnostics market size in 2025 and is advancing at a 7.52% CAGR through 2031.
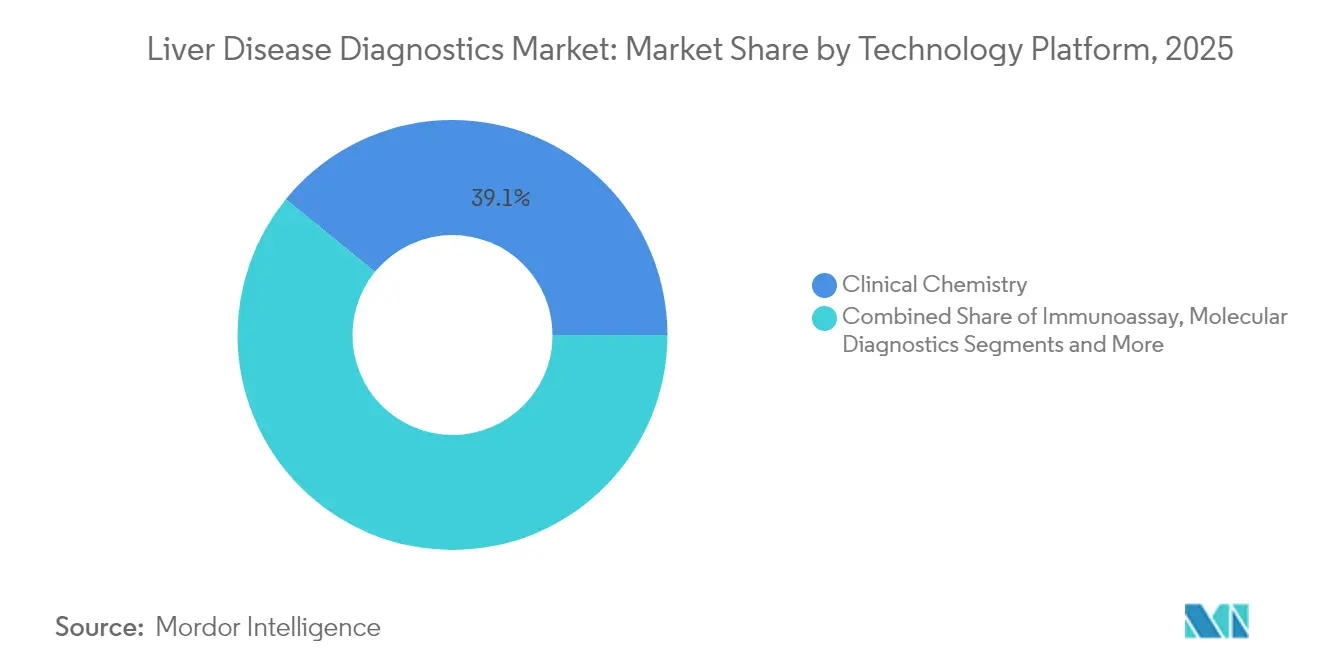
- By technology platform, clinical chemistry commanded 39.12% of the liver disease diagnostics market in 2025, whereas point-of-care biosensors show the highest projected CAGR at 6.98% to 2031.
- By end user, hospitals accounted for 50.65% of liver disease diagnostics market share in 2025, yet point-of-care specialty clinics post the fastest 7.88% CAGR during 2026-2031.
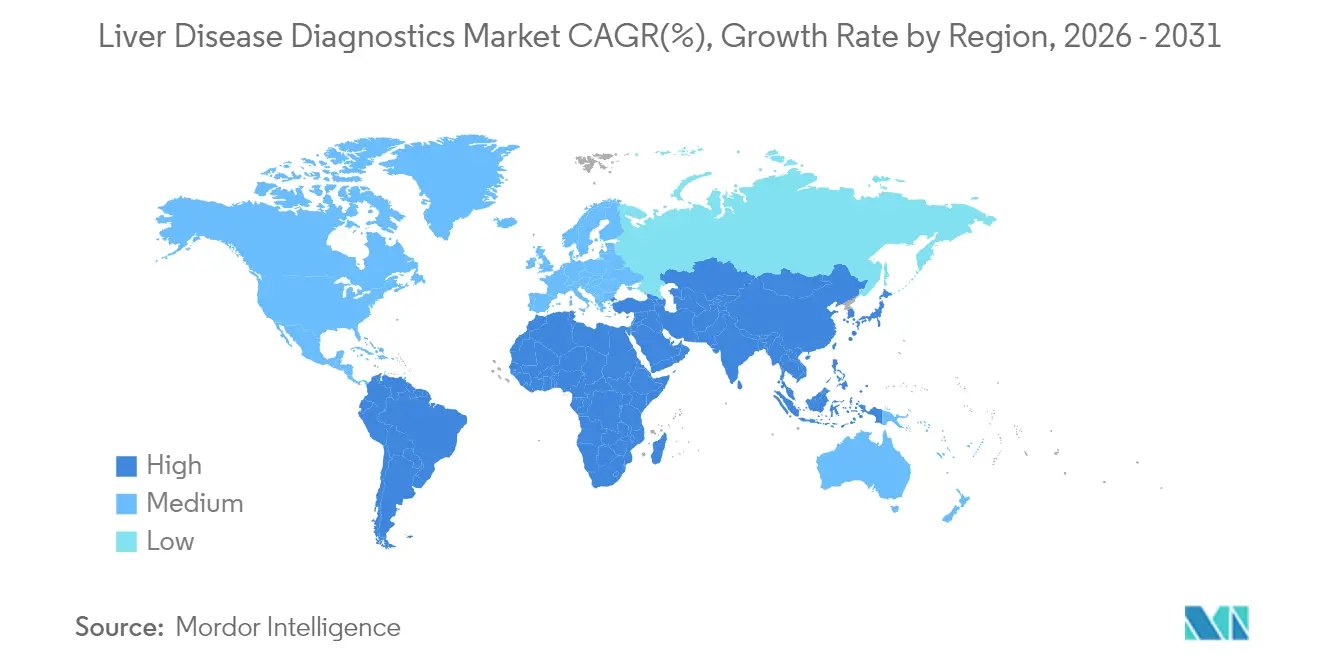
- By geography, North America held 36.78% of the liver disease diagnostics market in 2025, while Asia-Pacific records the quickest 9.18% CAGR through 2031.
Note: Market size and forecast figures in this report are generated using Mordor Intelligence’s proprietary estimation framework, updated with the latest available data and insights as of 2026.
Market Trends and Insights
Drivers Impact Analysis of Liver Disease Diagnostics Market*
| Driver | (~) % Impact on CAGR Forecast | Geographic Relevance | Impact Timeline |
|---|---|---|---|
| Growing prevalence of liver diseases worldwide | +1.8% | Global, highest in Asia-Pacific and North America | Long term (≥ 4 years) |
| Rising alcohol consumption & metabolic risk factors | +1.5% | Europe and North America | Medium term (2-4 years) |
| Uptake of non-invasive imaging | +1.2% | North America & EU, expanding to Asia-Pacific | Medium term (2-4 years) |
| Government initiatives for population screening | +1.0% | Europe, North America, select Asia-Pacific markets | Long term (≥ 4 years) |
| AI-powered multi-omics liquid biopsy for transplant monitoring | +0.8% | North America & EU initially | Long term (≥ 4 years) |
| Expansion of point-of-care ALT/AST nano-biosensors | +0.6% | Developed markets globally | Short term (≤ 2 years) |
| Source: Mordor Intelligence | |||
Growing Prevalence of Liver Diseases Worldwide
Rising MASLD incidence now touches roughly 30% of adults, driven by sedentary lifestyles, calorie-dense diets, and ageing demographics that push metabolic dysfunction to the forefront of hepatology practice.[3]The Lancet Gastroenterology & Hepatology Commission, “Liver Diseases in the Asia-Pacific Region,” thelancet.comAsia-Pacific bears the world’s heaviest chronic Hepatitis B burden, creating sustained surveillance demand even as vaccination programs mature. Epidemiological models in Spain predict MASLD diagnoses doubling by 2030, challenging laboratory capacity and prompting policymakers to subsidize high-throughput non-invasive tests. As patient volumes swell, providers swap liver biopsy for elastography and serum panels that can be repeated frequently without safety concerns. The long-term nature of metabolic disease means each newly diagnosed individual represents a recurring revenue stream for diagnostic vendors throughout disease progression.
Rising Alcohol Consumption & Metabolic Risk Factors
Europe’s alcohol-attributable liver morbidity overlaps increasingly with obesity and insulin resistance, making etiology assignment difficult when standard liver enzymes cannot disentangle multifactorial injury. Economic modeling by the European Association for the Study of the Liver shows that instituting a EUR 1 minimum unit price could prevent more than 19,000 severe liver outcomes by 2030, spotlighting diagnostics as a critical companion to policy. Multi-analyte panels that quantify fibrosis, steatosis, and inflammatory markers in one run allow clinicians to stratify complex cases quickly. AI algorithms further integrate behavioral data—such as alcohol purchase records—with laboratory inputs, enabling earlier intervention and supporting value-based reimbursement frameworks.
Uptake of Non-Invasive Imaging
Magnetic resonance elastography, transient elastography, and two-dimensional shear-wave techniques deliver biopsy-equivalent accuracy with none of the bleeding or sampling-error risks linked to percutaneous procedures. Reimbursement guidelines issued in January 2025 by the Centers for Medicare & Medicaid Services now endorse special histochemical stains while encouraging safer imaging, nudging community practices to procure portable elastography scanners. Miniaturized probes that dock onto handheld ultrasound units are reaching correlation coefficients above 0.97 versus full-size systems, positioning primary care for frontline fibrosis assessment. As device prices fall, diagnostic access broadens beyond hepatology centers, enlarging the addressable user base.
Government Initiatives for Population Screening for Liver Diseases
The U.S. Viral Hepatitis National Strategic Plan mandates one-time Hepatitis C screening for all adults, embedded into quality metrics that affect provider reimbursemen. In the United Kingdom, the NHS Somerset rollout of algorithm-based risk prediction identified 700 high-risk patients among routine blood draws, illustrating how electronic health records turn passive data into active case-finding. Such initiatives stabilize demand by hard-wiring tests into clinical pathways. Standardized national protocols also de-risk market entry for innovators because once a technology wins guideline inclusion, payer uptake follows rapidly across the entire system.
Restraints Impact Analysis of Liver Disease Diagnostics Market*
| Restraint | (~) % Impact on CAGR Forecast | Geographic Relevance | Impact Timeline |
|---|---|---|---|
| High cost of comprehensive diagnostic work-ups | -1.2% | Global, most acute in emerging markets | Medium term (2-4 years) |
| Limited reimbursement for novel biomarker panels | -0.8% | North America & EU | Short term (≤ 2 years) |
| Patient aversion to invasive liver biopsy procedures | -0.6% | Global | Short term (≤ 2 years) |
| Shortage of trained hepatology radiologists in LMICs | -0.4% | Low- and middle-income countries | Long term (≥ 4 years) |
| Source: Mordor Intelligence | |||
High Cost of Comprehensive Diagnostic Work-Ups
Full hepatic work-ups that bundle imaging, serum biomarkers, and histology can top USD 1,200, a prohibitive sum in low-resource settings where out-of-pocket spending predominates. The 2025 Clinical Laboratory Fee Schedule curbs Medicare payments on select assays, squeezing provider margins and slowing menu expansion. Cost-effectiveness research shows that MASLD screening by FIB-4 algorithms exceeds standard willingness-to-pay thresholds, deterring widespread adoption until device prices or reimbursement improve. Vendors respond by bundling tests into subscription models linked to clinical outcome guarantees, but uptake remains limited where health-system budgets are tight.
Limited Reimbursement for Novel Biomarker Panels
Securing payment codes can lag scientific validation by years. Medicare’s cautious stance forces companies to amass real-world utility data before nationwide coverage, a burden smaller firms struggle to meet. The Enhanced Liver Fibrosis score, despite Japanese reimbursement approval in 2024, still negotiates piecemeal U.S. payer contracts, slowing revenue realization. Without guaranteed payment, hospitals delay capital purchases, lengthening sales cycles and raising working-capital needs for new entrants.
*Our forecasts treat driver/restraint impacts as directional, not additive. The impact forecasts reflect baseline growth, mix effects, and variable interactions.
Liver Disease Diagnostics Market Segment Analysis
By Diagnosis Technique:
Non-Invasive Platforms Accelerate AdoptionImaging tests accounted for 43.92% of liver disease diagnostics market size in 2025, with ultrasound retaining the widest installed base thanks to its affordability and operator familiarity. Yet elastography devices post an 8.06% CAGR as clinicians embrace quantitative fibrosis staging during routine outpatient visits. Radiology suites increasingly pair B-mode imaging with real-time shear-wave metrics, eliminating the scheduling delays associated with separate exams. MRI-elastography captures niche demand for precise staging in transplant candidates, whereas CT and PET-CT support oncologic assessment when hepatocellular carcinoma is suspected. Molecular techniques slot in as adjuncts, offering viral genotyping and cancer mutation profiling from a single blood draw. Over the forecast horizon, integration rather than substitution defines competitive positioning: vendors embedding elastography probes into standard ultrasound consoles win procurement committees seeking versatile systems. Enhanced sensitivity to steatosis and inflammation in next-generation contrast-enhanced ultrasound further erodes biopsy reliance, driving a steady migration of diagnostic workload to ambulatory care.
The shift to patient-friendly tests dovetails with payers’ focus on cost containment. Point-of-care elastography shortens diagnostic cycles, cutting ancillary costs such as pathology processing and post-biopsy observation. Evidence from multicenter studies demonstrates that shear-wave thresholds of 7 kPa distinguish significant fibrosis with 100% sensitivity, making routine surveillance feasible in primary care. As algorithms synthesize elastography scores with serum markers, decision support tools flag progression that warrants specialist referral, reinforcing a tiered-care model. Vendors therefore prioritize cloud connectivity and automated reporting, adding software subscriptions to hardware revenue.



By Disease Type:
MASLD Drives Volume and InnovationMASLD held 33.41% of liver disease diagnostics market share in 2025 and expands fastest at 7.52% CAGR, propelled by the global surge in obesity and type 2 diabetes. Cross-sectional screening reveals that 59% of diabetic patients harbor undiagnosed fatty liver, a prevalence that compels guidelines to recommend annual testing. Viral hepatitis remains a sizable niche in Asia-Pacific, sustaining demand for HBV DNA quantification and genotyping assays that inform antiviral therapy. Alcohol-related liver disease, while stable in incidence, still necessitates fibrosis monitoring because abstinence alone does not halt progression once cirrhosis develops. Auto-immune liver disease, though rare, commands premium pricing owing to complex serological panels.
Diagnostic complexity grows as etiologies overlap: a single patient may present with metabolic steatosis superimposed on chronic Hepatitis B and alcohol use. Multi-omics panels capable of parsing overlapping signatures therefore gain traction, and AI scoring engines distill disparate biomarkers into actionable risk grades. Liquid biopsy platforms enter early-cancer surveillance, showing 86% sensitivity at 88% specificity for stage I hepatocellular carcinoma, a performance level that edges out ultrasound screening. MASLD’s chronic, progressive nature assures recurring testing every six to 12 months, underpinning sustained reagent demand.
By Technology Platform:
Point-of-Care Biosensors Challenge Laboratory DominanceClinical chemistry platforms retained 39.12% share of the liver disease diagnostics market in 2025, supported by mature infrastructure and high throughput. However, point-of-care biosensors are gaining 6.98% CAGR as healthcare shifts toward decentralized models favoring immediate results. Nano-engineered transducers now detect glutamate dehydrogenase, a more specific indicator of liver injury than traditional ALT or AST, within five minutes on finger-stick samples. Immunoassays remain central for quantitative fibrosis markers like PRO-C3, yet next-generation sequencing is making inroads via comprehensive viral genotyping and cancer risk panels. Imaging hardware vendors integrate AI image analysis software, adding subscription revenue while improving diagnostic consistency.
Inter-platform convergence is becoming the norm: handheld analyzers pair electrochemical ALT strips with ultrasound elastography in a single unit for community clinics. Cloud dashboards compile serial readings, enabling predictive modeling of fibrosis progression and treatment response. Such synergy reduces data silos and aligns with payer interest in longitudinal outcomes, positioning integrated platforms for premium reimbursement tiers.
By End User:
Specialty Clinics Extend Preventive ReachHospitals controlled 50.65% of liver disease diagnostics market size in 2025 through broad test menus and inpatient demand for acute management. Yet point-of-care specialty clinics post the highest 7.88% CAGR as value-based payment schemes reward early risk identification. Retail health outlets and metabolic clinics adopt drop-in elastography and finger-stick panels that deliver actionable results within a single appointment, minimizing costly specialist referrals. Independent laboratories leverage economies of scale to process high volumes of serology and genomic tests for multi-site provider networks, while academic centers drive biomarker validation studies that feed commercial pipelines.
The care continuum is shifting toward proactive management. NHS Tayside’s intelligent liver function test program reduced unnecessary hepatology referrals by 34% through automated fibrosis scoring, freeing specialist capacity for advanced cases. Telehealth integration allows rural clinics to upload elastography clips for specialist review, mitigating workforce shortages. Vendors that bundle equipment leases with comprehensive training and remote consultation support widen their customer base among small practices.
Geography Analysis
North America Liver Disease Diagnostics Market
North America accounted for 36.78% of liver disease diagnostics market share in 2025, buoyed by robust reimbursement and early adoption of breakthrough technologies. FDA fast-track pathways, such as the De Novo clearance for point-of-care Hepatitis C RNA testing, accelerate commercialization timelines. Medicare’s 2025 laboratory fee schedule provides predictable payment for validated assays, fostering capital investment in new platforms. Strategic acquisitions—Quest Diagnostics’ USD 1.0 billion purchase of LifeLabs—expand regional footprints and enhance test accessibility.
APAC Liver Disease Diagnostics Market
Asia-Pacific is poised to record a 9.18% CAGR through 2031, reflecting both the world’s highest Hepatitis B prevalence and rapid metabolic-disease growth. Mainland China deploys nationwide MASLD screening pilots, while Japan reimburses the Enhanced Liver Fibrosis test, underscoring governmental commitment to early detection. India’s blended public-private healthcare model spurs demand for low-cost point-of-care devices in rural areas, whereas Australia and South Korea adopt AI-integrated imaging platforms early thanks to advanced digital infrastructure. Regional disease burden—75% of chronic Hepatitis B patients reside in Asia-Pacific—creates sustained demand for quantitative viral assessment and fibrosis monitoring.
EMEA Liver Disease Diagnostics Market
Europe maintains a solid second position, supported by coordinated policy initiatives such as the EASL-Lancet Commission on prevention and early diagnosis. Germany and the United Kingdom drive capital equipment uptake for MRI-elastography and AI image analysis, while France emphasizes cost-effectiveness studies that validate reimbursement decisions. Population screening pilots in Spain and Italy target MASLD, reflecting concern over rising obesity rates. Eastern European markets gradually modernize laboratory infrastructure through EU cohesion funds, while the Middle East and Africa represent nascent opportunities where private hospital chains import advanced modalities to meet affluent patient demand.

Regulatory Landscape
Regulatory oversight for liver disease diagnostics spans high-risk device approvals for novel functional tests, routine IVD conformity assessments, and governance for AI-enabled software used in clinical decision support. In the United States, liver diagnostics navigate FDA pathways including 510(k) clearance and PMA; HepQuant received FDA PMA in June 2026 for its SHUNT Liver Diagnostic Test in Child-Pugh Class A compensated cirrhosis. In Europe, the IVDR shapes market access via notified bodies, with the EMA CHMP qualification of AIM-NASH for standardized liver-biopsy interpretation in MASLD trials in February 2025 and a 2026 push for enhanced regulatory support under the BtX pilot. In China, NMPA Class III registration remains central for higher-risk hepatology IVDs, exemplified by Tarcine obtaining a Class III registration in April 2026 for its AFP-L3% assay kit, while the 2025 annual report noted 14,187 total device approvals.
Value Chain Analysis
The liver disease diagnostics value chain starts with upstream inputs such as antibodies, enzymes, calibrators, plastics, and sensor parts, flows through OEM manufacturing of imaging systems and IVD platforms, and proceeds to assay development, clinical validation, and regulatory submissions (510(k)/PMA in the United States and IVDR pathways in Europe). Instrument vendors increasingly couple hardware with software layers including AI-enabled device software and lifecycle controls as part of product commercialization and post-market management. Downstream, distribution is shaped by integrated procurement channels and large lab networks, with NHS Supply Chain frameworks for elastography systems in the United Kingdom illustrating public framework leverage, and guideline inclusion driving adoption. GENFIT’s NIS2+ tool was included in European clinical practice guidelines for MASLD in April 2025, strengthening links between diagnostics, trial endpoints, and payer decision-making.
Competitive Landscape
The liver disease diagnostics market is moderately fragmented, with platform diversification and clinical validation as core differentiation levers. Established conglomerates—Abbott, Roche, Siemens Healthineers—bundle chemistry, immunoassay, and imaging capabilities into integrated ecosystems, locking in customers through data interoperability. Roche’s Elecsys PRO-C3 launch strengthens its serum fibrosis franchise, while Siemens pushes AI-enabled ultrasound that auto-classifies elastography clips. Thermo Fisher signals further consolidation, earmarking up to USD 50 billion for acquisitions to widen molecular diagnostics reach.
Emerging entrants focus on high-growth niches. Mursla Bio’s EvoLiver liquid biopsy captured FDA breakthrough status, positioning it for early-cancer surveillance dominance. Helio Genomics claims superior sensitivity over ultrasound for HCC screening, aiming to displace imaging in annual surveillance protocols. AI software vendors integrate natural-language pathology reports with lab data to generate holistic risk scores, offering subscription models that appeal to resource-constrained clinics.
Partnerships between diagnostics firms and pharmaceutical companies accelerate companion-diagnostic development. GSK’s USD 37.5 million alliance with Ochre Bio explores AI-guided target discovery in MASLD, exemplifying cross-sector collaboration that blurs therapeutic and diagnostic boundaries. Meanwhile, bioMérieux recorded 9.9% sales growth in H1 2024 on the back of expanded hepatology panels, underscoring the revenue potential of specialized test menus. Competitive intensity is likely to intensify as point-of-care platforms remove scale advantages traditionally held by central laboratories.
Liver Disease Diagnostics Industry Leaders
F. Hoffmann-La Roche Ltd
Abbott
Siemens Healthineers
Thermo Fisher Scientific
bioMérieux
- *Disclaimer: Major Players sorted in no particular order
Liver Disease Diagnostics Market Companies Covered in this Report
- Abbott Laboratories
- Roche
- Siemens Healthineers
- Thermo Fisher Scientific
- Randox Laboratories
- Boston Scientific
- Laboratory Corporation of America (LabCorp)
- bioMérieux
- Quest Diagnostics
- Mindray
- Echosens
- DiaSorin
- Sysmex
- QuidelOrtho
- PerkinElmer (Revvity)
- Canon
- GE Healthcare
- Koninklijke Philips
- FUJIFILM
- Meridian Bioscience

Market Opportunities and Future Outlook
A key opportunity is the shift from single-modality testing toward integrated pathways that combine biomarkers, imaging, and software algorithms to triage risk and reduce the need for biopsy, enabling workflow-ready bundles of assays and analytics. In May 2026, Roche launched its Liver Disease Panel featuring certified algorithms such as LiverPRO within the navify Algorithm Suite, signaling commercialization momentum for regulated algorithm-enabled pathways. Non-invasive staging and surveillance remain critical areas for differentiated tests that inform decisions such as endoscopy avoidance or surveillance intensity. The FDA PMA granted to HepQuant in June 2026 for the SHUNT Liver Diagnostic Test in compensated cirrhosis demonstrates a regulatory-validated path for decision-informing diagnostics beyond standard liver enzymes, while continued 510(k) clearances for quantitative imaging solutions, including Perspectum LiverMultiScan v6.0 in March 2026, support broader access to repeatable fibrosis and steatosis assessment. In viral hepatitis testing, automated molecular assays on consolidated platforms expand menu breadth, reinforced by Roche introducing an automated cobas HDV test in July 2026 for cobas 5800/6800/8800 systems.
Recent Industry Developments in Liver Disease Diagnostics Market
- July 2026: Roche introduced the cobas Hepatitis D Virus (HDV) test as a fully automated solution for the cobas 5800/6800/8800 systems. The launch targets scalable HDV detection on high-throughput platforms, supporting laboratories that run broad viral hepatitis menus and need standardized workflows across sites.
- May 2026: Roche expanded the Liver Disease Panel to include LiverPRO and began broad commercial rollout across health systems within the navify Algorithm Suite, signaling a momentum shift toward software-enabled diagnostic pathways rather than standalone assays.
- March 2026: Abbott completed its acquisition of Exact Sciences, adding assets that include the Oncoguard Liver Test within a broader oncology and screening portfolio, expanding Abbott's exposure to liver-related oncology screening and intensifying competitive dynamics around hepatology care pathways.


Liver Disease Diagnostics Market Report Scope and Research Methodology
Market Definition and Coverage
We define the liver disease diagnostics market as revenues earned from tests and procedures used to detect, stage, and monitor liver diseases, including lab-based assays and diagnostic imaging ordered for liver-focused clinical decisions.
Scope exclusions: Therapeutic drugs, liver surgeries, and general-purpose clinical chemistry analyzers that are not marketed for liver indications are not counted.
Segments Covered in This Report
- By Diagnosis Technique
- Imaging Tests
- Ultrasound
- MRI & MRI-Elastography
- CT & PET-CT
- Liver Function Tests
- Non-invasive Elastography Devices
- Liver Biopsy
- Endoscopy
- Molecular & Serologic Tests
- Imaging Tests
- By Disease Type
- NAFLD / MASLD
- Viral Hepatitis (HBV, HCV)
- Alcohol-related Liver Disease
- Auto-immune Liver Diseases
- Liver Cancer & Cirrhosis
- By Technology Platform
- Clinical Chemistry
- Immunoassay
- Molecular Diagnostics
- Imaging Devices
- Point-of-Care Biosensors
- By End User
- Hospitals
- Independent Clinical Laboratories
- Academic & Research Institutes
- Point-of-Care / Specialty Clinics
- By Geography
- North America
- United States
- Canada
- Mexico
- Europe
- Germany
- United Kingdom
- France
- Italy
- Spain
- Rest of Europe
- Asia-Pacific
- China
- Japan
- India
- Australia
- South Korea
- Rest of Asia-Pacific
- Middle East and Africa
- GCC
- South Africa
- Rest of Middle East and Africa
- South America
- Brazil
- Argentina
- Rest of South America
- North America
Data Sources, Market Sizing, and Validation
Desk Research
We began by mapping what clinicians typically use to identify and follow liver conditions, so the market size tracks actual diagnostic pathways rather than only catalog listings. Public health and burden-of-disease references helped anchor the demand pool, using sources such as the World Health Organization, US CDC, and the Global Burden of Disease study publications. For liver cancer and chronic liver disease context, we also referred to sources such as the International Agency for Research on Cancer (IARC) and national cancer registry publications where relevant.
To align utilization and pricing with reimbursed practice, we reviewed public reimbursement and coding references such as CMS fee schedules and procedure coding guidance. We also used materials from hepatology and radiology societies that describe how elastography, ultrasound, MRI, CT, and biopsy fit into workups. Company filings, investor presentations, reputable press, and peer-reviewed journals were then used to cross-check product positioning, test performance, and observed shifts from invasive to non-invasive assessment. We also used a paid subscription for company financials and news intelligence, plus a patent database, to confirm technology direction and major portfolio changes. The desk sources listed are illustrative, and many other public documents were also reviewed to collect, validate, and clarify inputs.
Primary Interviews and Surveys
Primary work was used to stress-test desk assumptions that typically create the most variance, such as repeat testing frequency for fibrosis staging and how patients move between labs and imaging during monitoring. We collected input from diagnostic manufacturers, distributors, lab directors, radiology and hepatology clinicians, and hospital procurement teams across major regions, so utilization and pricing logic could be confirmed and adjusted where needed.
Distribution of primary research fieldwork respondents
| Company type | Respondent position | Region |
|---|---|---|
| Top tier: 25% | CXOs: 12% | APAC: 44% |
| Mid tier: 57% | Functional/Unit leaders: 35% | EMEA: 32% |
| Smaller Players: 18% | Managers: 53% | Americas: 24% |
Market-Sizing & Forecasting
Our core sizing uses top-down and bottom-up logic together. The main build starts from liver disease burden and screening coverage to estimate the tested population by region. That tested pool is then allocated into common diagnostic pathways, such as liver function panels, serology and molecular assays, non-invasive elastography, imaging workups (ultrasound, CT, MRI), endoscopy, and biopsy-related consumables, before translating into value using modality-level pricing ranges.
Key inputs that guided the model included hepatitis screening program intensity, NAFLD and metabolic risk-factor trends, the share of patients moving into fibrosis staging, repeat monitoring intervals, access to imaging capacity, and the observed shift from biopsy toward non-invasive assessment. Results were corroborated with selective bottom-up checks, such as sampled ASP x volume for key modalities, plus channel checks with labs and hospitals to confirm ordering patterns. Where a country-level utilization datapoint was weak, we filled gaps using regional clinical guideline similarity, reimbursement availability, and expert feedback to keep the assumption workable.
For forecasting, we used scenario analysis so adoption timing for non-invasive tools, policy pushes for screening, and payer coverage changes could be reflected without overfitting the model. Scenarios stayed tied to variables that respondents could validate, and the final path was selected after reviewing which assumptions matched current utilization trends.
Data Validation & Update Cycle
After the first model run, outputs were checked against independent signals, including disease-burden trends, diagnostic procedure volumes discussed in clinical literature, and category performance patterns visible in public company disclosures. Variances were reviewed by modality and region, and outliers were traced back to the specific assumption that caused the jump before adjustments were made. A second analyst review was then completed so the final numbers reflect more than one set of eyes.
Reports are refreshed annually to keep assumptions aligned with guideline updates, pricing movements, and changes in testing behavior. Interim updates are made when major policy shifts, approvals, or reimbursement changes materially affect demand. Before delivery, a final pass is performed so clients receive the latest adjusted view rather than an older static snapshot.
Mordor Intelligence's Liver Disease Diagnostics Market Size Measured Against Other Published Estimates
Published market sizes for liver disease diagnostics often diverge because publishers define the diagnostic basket differently, and they also make different choices on price year, currency treatment, and how repeat monitoring is counted. The table highlights that even with a similar disease focus, totals can separate quickly when imaging and procedure-led diagnostics are treated inconsistently.
Key gap drivers here usually include whether elastography is counted as a device-only category or as a broader workflow, whether biopsy-related consumables and endoscopy are included, and whether the value is expressed in current dollars or constant dollars. Another driver is how repeat testing is modeled for chronic hepatitis and fibrosis monitoring, since follow-up cadence assumptions can change totals meaningfully by region.
Benchmark comparison
| Source | Market Size | Gaps in Research Methodology |
|---|---|---|
| Mordor Intelligence | USD 40.55 B (2026) | |
| Global Consultancy A | USD 28.90 B (2026) | This estimate appears to center on in vitro testing revenues and excludes procedure-led diagnostics such as elastography workflows, endoscopy, and biopsy consumables, which lowers the total in imaging-heavy pathways. |
| Industry Association B | USD 46.80 B (2026) | This figure likely adds broader routine liver panels run on general clinical chemistry platforms and uses current-dollar pricing, which can lift totals when non-liver-positioned analyzers and inflation effects are included. |
The table points to scope and price-year handling as the main reasons totals differ, and in Mordor Intelligence's model the count is limited to liver-indication diagnostics across imaging, elastography, endoscopy, biopsy consumables, and lab assays, reported in constant 2024 US dollars. With those rules spelled out, the market value stays traceable to the tested population, modality mix, and pricing inputs that can be rechecked and updated as practice changes.


Key Questions Answered in the Report
What is the current Global Liver Disease Diagnostics Market size?
The Global Liver Disease Diagnostics Market is projected to register a CAGR of 6.79% during the forecast period (2026-2031)
Who are the key players in Global Liver Disease Diagnostics Market?
F. Hoffmann-La Roche Ltd, Echosens, Siemens Healthcare GmbH, Boston Scientific Corporation and Thermo Fisher Scientific Inc. are the major companies operating in the Global Liver Disease Diagnostics Market.
What is the current size of the liver disease diagnostics market?
The liver disease diagnostics market size reached USD 40.55 billion in 2026 and is forecast to hit USD 56.27 billion by 2031.
Which disease segment generates the highest revenue?
MASLD is the largest segment, accounting for 33.41% of market share in 2025 and expanding at a 7.52% CAGR through 2031.
Why are non-invasive imaging techniques gaining traction?
Elastography and MRI-based methods match biopsy accuracy without procedural risks, prompting policy support and patient preference for outpatient testing.
Which region is growing fastest in liver diagnostics?
Asia-Pacific leads growth with a 9.18% CAGR, driven by high Hepatitis B prevalence and rising metabolic disorders.
How are point-of-care biosensors influencing the market?
Portable ALT/AST nano-biosensors deliver minute-level results, enabling community clinics and telehealth models to detect liver injury early and manage patients proactively.
What factors limit adoption of advanced biomarker panels?
High test costs and delayed reimbursement approvals force providers to justify incremental clinical benefit before integrating new assays into routine workflows.
Page last updated on:


 Your data is secure and never sold or shared.


