Market Overview
| Study Period | 2021 - 2031 |
|---|---|
| Forecast Data Period | 2026 - 2031 |
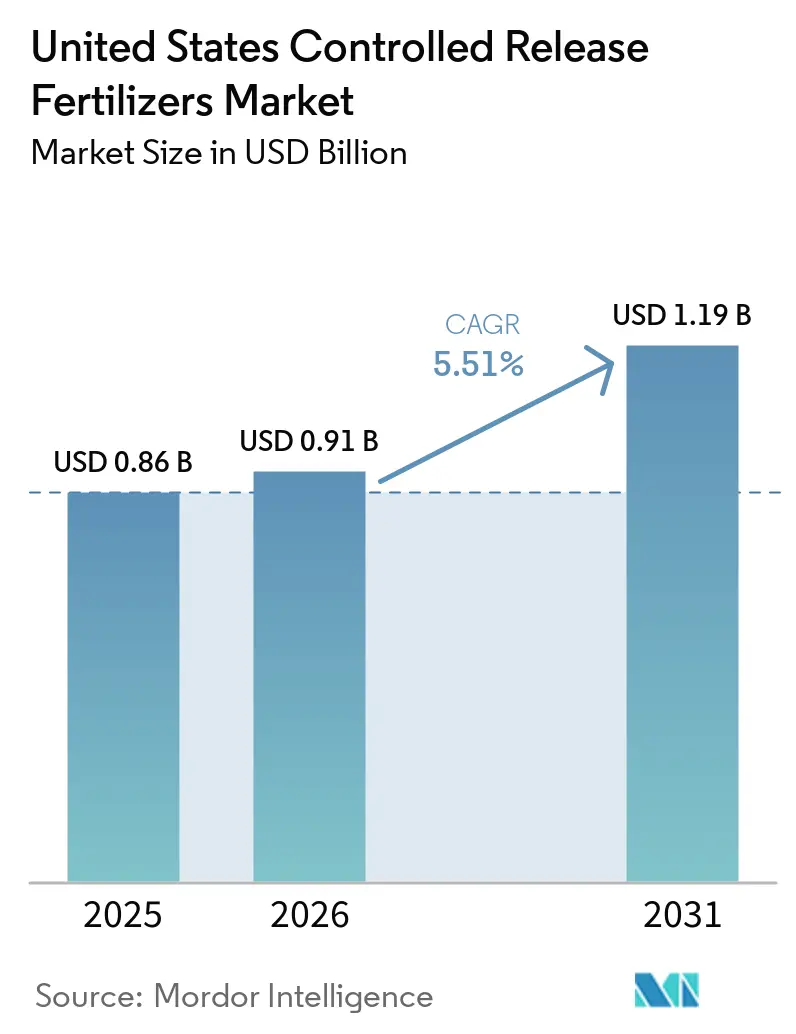
| Base Year Market Size (2025) | USD 0.86 Billion |
| Market Size (2026) | USD 0.91 Billion |
| Market Size (2031) | USD 1.19 Billion |
| Growth Rate (2026 - 2031) | 5.51% CAGR |
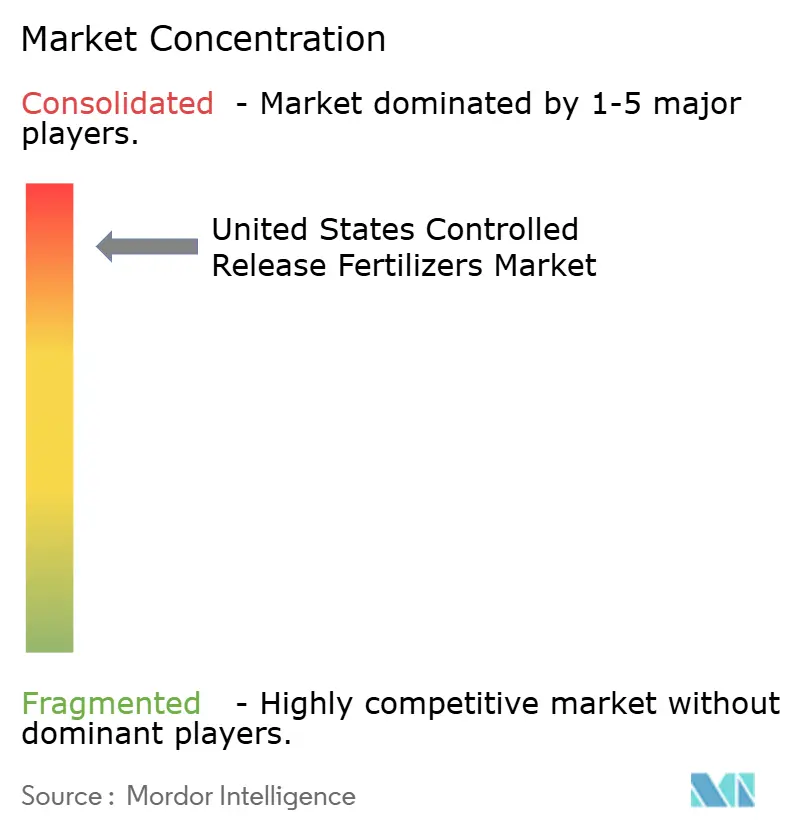
| Market Concentration | High |
Major Players *Disclaimer: Major Players sorted in no particular order Image © Mordor Intelligence. Reuse requires attribution under CC BY 4.0. | |
United States Controlled Release Fertilizers Market Analysis by Mordor Intelligence
The United States controlled release fertilizers market size was valued at USD 0.86 billion in 2025 and estimated to grow from USD 0.91 billion in 2026 to reach USD 1.19 billion by 2031, at a CAGR of 5.51% during the forecast period (2026-2031). Growing use of precision agriculture equipment, federal climate-smart incentives, and state runoff regulations are accelerating adoption across farms and professional turf sites. Polymer-based coating technologies, deeper distribution networks, and rising demand for water-efficient nutrient delivery in drought-prone regions are expected to sustain volume growth. Manufacturers are expanding Gulf Coast capacity to leverage petrochemical feedstocks and shorten lead times. At the same time, breakthroughs in biodegradable polymers promise cost relief and regulatory alignment. These forces collectively reinforce a multi-year demand upswing that positions the United States-controlled release fertilizers market as a critical enabler of sustainable crop production and landscaping services.
Key Report Takeaways
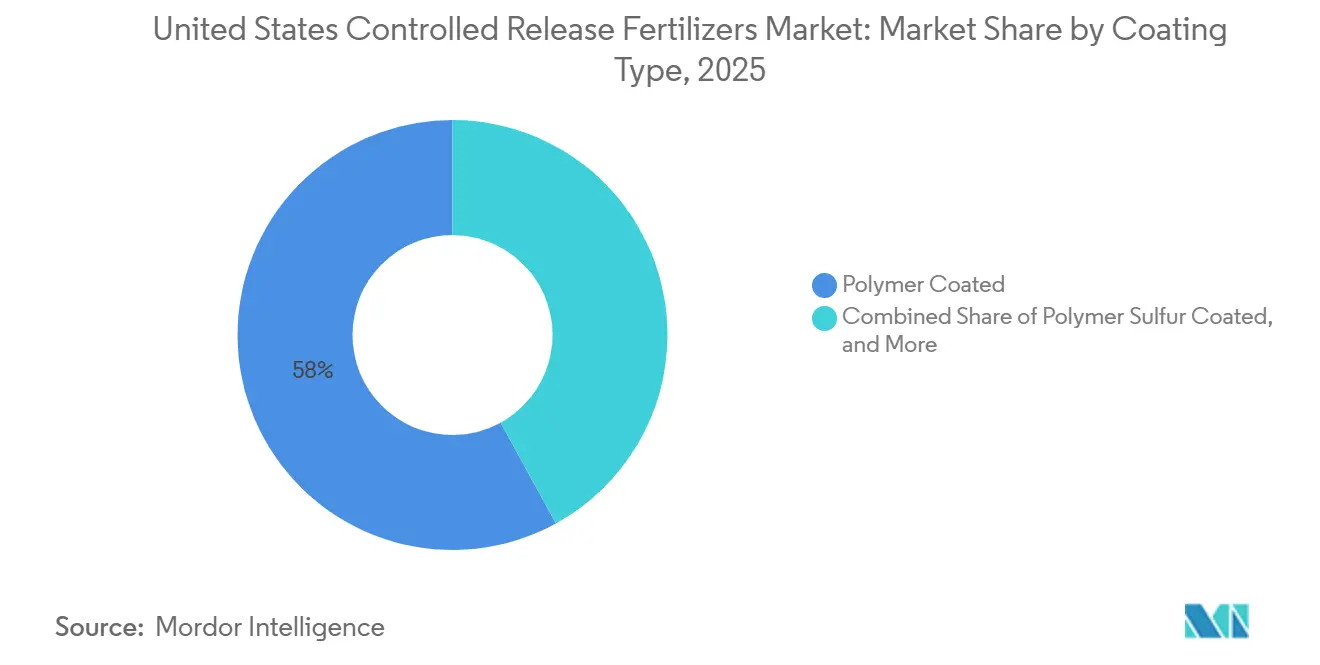
- By coating type, polymer-coated fertilizers held 58.0% of the United States controlled release fertilizers market share in 2025, and polymer-sulfur-coated fertilizers are the fastest-growing segment, forecast to post an 7.4% CAGR through 2026 to 2031.
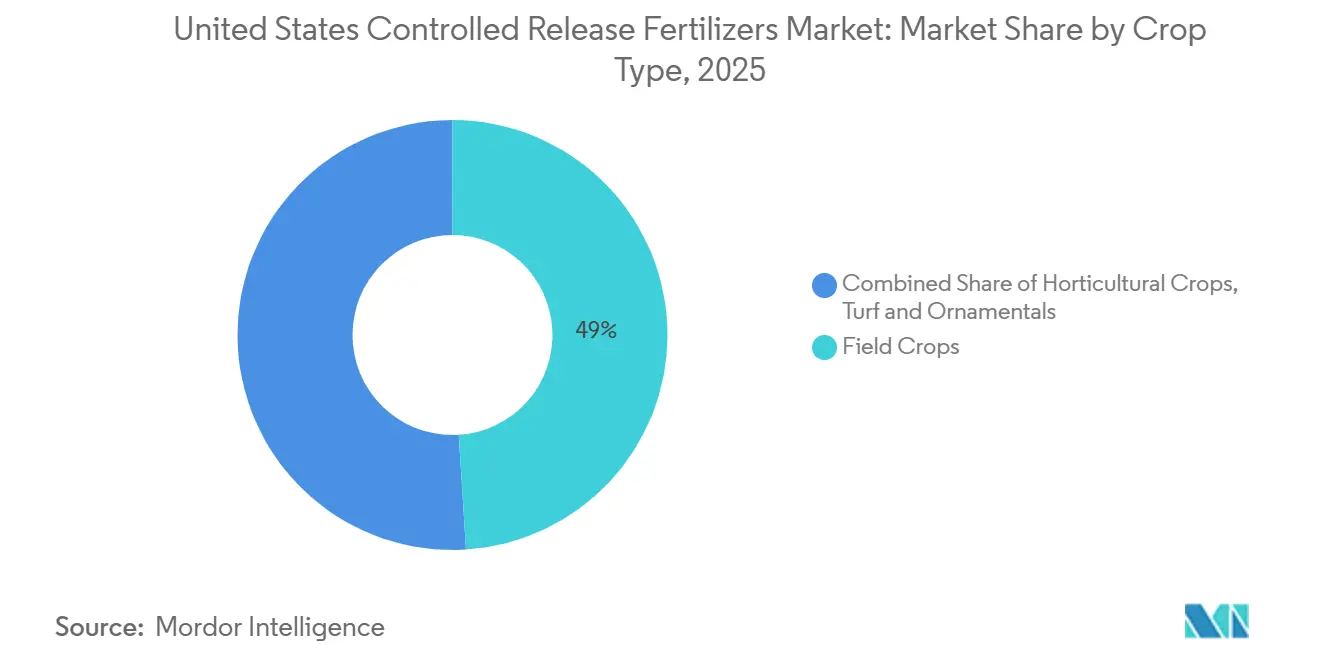
- By crop type, field crops accounted for 49.0% of revenue in 2025, while turf and ornamental crops are the fastest-growing segment projected to expand at a 6.8% CAGR during 2026–2031.
- Nutrien Ltd and ICL Group together commanded 76.58% of the United States controlled release fertilizers market size in 2025, indicating a highly consolidated competitive structure.
Note: Market size and forecast figures in this report are generated using Mordor Intelligence’s proprietary estimation framework, updated with the latest available data and insights as of 2026.
United States Controlled Release Fertilizers Market Trends and Insights
Drivers Impact Analysis*
| Driver | ~ (%) Impact on CAGR Forecast | Geographic Relevance | Impact Timeline |
|---|---|---|---|
| Precision agriculture adoption boosting nutrient use efficiency | +1.8% | Midwest Corn Belt and California Central Valley | Medium term (2-4 years) |
| Stricter state runoff rules encouraging CRF uptake | +1.5% | Ohio and Chesapeake Bay watershed states | Short term (≤ 2 years) |
| Rising turf and ornamental spending in Sun Belt metros | +1.2% | Florida, Texas, Arizona, North Carolina | Medium term (2-4 years) |
| United States manufactures biodegradable coatings lowering cost barriers | +0.9% | National, centered in Louisiana and Georgia | Long term (≥ 4 years) |
| USDA climate-smart pilot incentives for nitrogen use reduction | +0.8% | National focus on conservation priority areas | Short term (≤ 2 years) |
| Expanding polymer coated urea capacity in Gulf Coast states | +0.6% | National distribution from Louisiana and Georgia hubs | Medium term (2-4 years) |
| Source: Mordor Intelligence | |||


Precision Agriculture Adoption Boosting Nutrient Use Efficiency
Variable-rate technology, paired with controlled-release products, optimizes both placement and timing across zones with varying soil profiles. The USDA Economic Research Service reported that the majority of corn acreage precision coverage in 2024 utilized polymer-coated urea, resulting in a 15-20% reduction in total nitrogen use without yield loss [1]Source: Economic Research Service, “Precision Agriculture,” USDA, ers.usda.gov. Wider GPS guidance use minimizes overlap at field edges, where conventional applications often waste nutrients. These gains translate into lower input costs, improved soil health, and compliance with runoff standards, reinforcing broad uptake across large-acreage row-crop operations.
Stricter State Runoff Rules Encouraging CRF Uptake
Ohio’s H2Ohio program covered the majority of the cost-share on controlled-release premiums in 2024, spurring a surge in product trials across 1.3 million acres [2]Source: Soil and Water Conservation Division, “H2Ohio Program,” Ohio Department of Agriculture, agri.ohio.gov. Chesapeake Bay states tightened total maximum daily load mandates, requiring farmers to document nutrient-use efficiency gains. Controlled release technologies meet these obligations by releasing nitrogen only when temperature and moisture conditions favor crop uptake, thereby reducing leaching. Financial penalties for non-compliance further motivate the transition to the United States-controlled release of fertilizers market solutions.
Rising Turf and Ornamental Spending in Sun Belt Metros
United States landscaping expenditures reached a higher value in 2024, with controlled-release formulations lowering labor costs by cutting application frequency[3] Source: Occupational Statistics Branch, “Landscape Services Employment,” Bureau of Labor Statistics, bls.gov. Extended growing seasons in Florida and Texas increase nutrient demand, and homeowners are willing to pay premiums for slow-release nitrogen that keeps lawns green for longer periods. Professional turf firms are increasingly specifying 90-day coated fertilizers that reduce truck rolls and labor hours, making turf a notable growth corridor within the United States' controlled-release fertilizers market.
United States Manufactures Biodegradable Coatings Lowering Cost Barriers
New facilities in Louisiana and Georgia utilize corn starch and soybean oil inputs to produce biodegradable coatings, thereby reducing reliance on Asian resin imports and saving transportation costs. Domestic capacity also shelters supply from currency swings and shipping disruptions. Lower feedstock prices during bumper harvests further narrow the premium gap to conventional urea, boosting uptake among margin-sensitive growers, especially in environmentally regulated watersheds.
Restraints Impact Analysis*
| Restraint | ~ (%) Impact on CAGR Forecast | Geographic Relevance | Impact Timeline |
|---|---|---|---|
| Premium price gap versus conventional urea | -1.4% | National, most acute in commodity crop regions | Short term (≤ 2 years) |
| Supply chain exposure to imported coating resins | -1.1% | National, focused on Gulf Coast production | Medium term (2-4 years) |
| Farmer awareness still low among Corn Belt independents | -0.8% | Iowa, Illinois, Indiana, Nebraska | Medium term (2-4 years) |
| Uncertain ROI under volatile commodity prices | -0.6% | National, cyclical during price downturns | Short term (≤ 2 years) |
| Source: Mordor Intelligence | |||
Premium Price Gap Versus Conventional Urea
Coated fertilizers cost 40-60% more than prilled urea, a hurdle when corn margins tighten. In 2024, natural gas costs eased, but petrochemical inputs for coatings remained volatile, widening the premium[4] Source: Energy Markets Division, “Natural Gas Data,” U.S. Energy Information Administration, eia.gov. Smaller operators with limited cash flow tend to delay adoption until they learn that the adoption demonstrates tangible yield or labor savings, thereby slowing penetration in traditional nitrogen-intensive systems.
Farmer Awareness Still Low Among Corn Belt Independents
Large agribusinesses deploy agronomists who validate the benefits of controlled release, but independent farms often rely on peer opinions. Dealer training programs remain uneven, leaving knowledge gaps about ideal application rates and return on investment. As a result, some growers perceive polymer capsules as a niche product suited only to specialty crops, which slows mainstream adoption.
*Our forecasts treat driver/restraint impacts as directional, not additive. The impact forecasts reflect baseline growth, mix effects, and variable interactions.
Segment Analysis
By Coating Type: Polymer Dominance Drives Technology Evolution
Polymer-coated fertilizers accounted for 58.0% of the United States controlled release fertilizers market share in 2025. Their leadership is supported by scale economies at Gulf Coast production facilities, which help reduce unit costs, and by proven performance across corn, soybean, turf, and specialty crop systems. Polymer-coated urea and polymer-coated multi-nutrient blends remain widely adopted due to their ability to improve nutrient-use efficiency, reduce nutrient losses, and lower application frequency. Continued advancements in coating technologies are anticipated to further strengthen adoption among growers seeking productivity gains and improved environmental performance.
Polymer-sulfur-coated fertilizers represent the fastest-growing segment and are projected to register a CAGR of 7.4% during 2026–2031. Growth is driven by their dual-benefit formulation, which combines controlled nutrient release with supplemental sulfur nutrition that is increasingly required in sulfur-deficient soils. Rising cultivation of sulfur-responsive crops, growing awareness of balanced nutrient management, and the need to improve fertilizer-use efficiency are supporting adoption. In addition, ongoing innovations in coating technologies that enhance nutrient-release performance while maintaining cost competitiveness are anticipated to further accelerate demand for polymer-sulfur-coated fertilizers.


By Crop Type: Field Crops Foundation Supports Specialty Growth
Field crops dominated the United States controlled release fertilizers market size, accounting for 49.0% of revenue in 2025. Corn and soybean growers value the ability of controlled-release fertilizers to synchronize nutrient availability with periods of rapid vegetative growth, reducing nutrient losses through leaching and supporting compliance with nutrient-management plans. Distributors increasingly bundle polymer-coated urea products with soil data analytics and precision agriculture services, creating integrated nutrient-management solutions that encourage repeat purchases. The large acreage devoted to corn, soybeans, and other field crops continues to make this segment the largest consumer of controlled-release fertilizers in the United States.
Turf and ornamental crops are projected to be the fastest-growing segment, registering a CAGR of 6.8% during 2026–2031. Growth is driven by rising demand for high-quality landscaping, increasing investments in golf courses and sports facilities, and the expanding maintenance of residential and commercial green spaces. Controlled-release fertilizers are particularly well suited to turf and ornamental applications because they provide sustained nutrient availability, promote uniform plant growth, enhance visual appeal, and reduce the frequency of fertilizer applications. Greenhouse ornamentals, nursery crops, and landscape plantings also benefit from improved nutrient-use efficiency and reduced labor requirements. With continued urbanization and growing demand for aesthetically attractive landscapes across the United States, adoption of controlled-release fertilizers in turf and ornamental applications is anticipated to accelerate, making this segment an important contributor to future market growth.
Geography Analysis
The Midwest Corn Belt states are projected to account for approximately 44.32% of the United States controlled release fertilizers market demand in 2025. This is primarily due to the benefits of reduced nitrogen losses in intensive corn-soybean rotations. These states utilize polymer-coated urea to meet watershed nutrient caps and achieve cost savings through precision application.
California’s Central Valley is the largest specialty-crop region. High-value crops such as almonds, grapes, and vegetables depend on drip irrigation systems, which benefit from slow-release formulations. This increases the adoption of controlled-release fertilizers and supports premium pricing. Additionally, drought management regulations encourage growers to adopt technologies that reduce runoff into waterways.
Southern states, including Texas, Florida, and Georgia, are projected to experience the highest growth through 2031. Factors such as expanding turf, ornamental, and warm-season vegetable acreage, along with proximity to Gulf Coast production hubs, contribute to reduced freight costs and faster last-mile delivery. Additionally, the strong construction boom in Sun Belt metropolitan areas drives increased demand for commercial landscaping, further boosting regional consumption in the United States controlled release fertilizers market.
Competitive Landscape
The market is highly consolidated, with the top five players holding significant shares. Nutrien Ltd led with a significant share in 2024, leveraging integrated ammonia and coating operations, as well as agronomic advisory teams that cross-sell controlled-release lines into whole-farm nutrition plans. ICL Group held a moderate share, differentiated by sulfur-based and micronutrient coatings favored in turf and specialty crops.
Mid-tier players such as Florikan and Pursell AgriTech pursued niche formulations, including organic-certified polymers and temperature-adaptive capsules, to win over specialty growers. Their agility in R and D and proximity to southeastern distribution centers shorten product-development cycles and secure local loyalty.
Strategic alliances between fertilizer producers and precision software firms intensified in 2024. Koch Fertilizer integrated release-rate modeling into Ag Leader variable-rate platforms, enabling retailers to provide data-backed recommendations that enhance farmer trust. Patent filings for biodegradable coatings and smart-release sensors rose 34%, indicating continuous innovation pressure across the United States controlled-release fertilizers market.
United States Controlled Release Fertilizers Industry Leaders
ICL Group Ltd.
The Mosaic Company
Nutrien Ltd.
Koch Fertilizer LLC
Grupa Azoty S.A.
Florikan ESA LLC (New Mountain Capital)
- *Disclaimer: Major Players sorted in no particular order

Recent Industry Developments
- January 2024: Yara partnered with a US-based company, Pursell Agritech, to integrate their advanced coating technology into Yara's portfolio, highlighting the competitive nature of innovation in the US market.
- September 2022: ICL Group introduced eqo.x, a controlled‑release fertilizer (CRF) technology that uses a fully biodegradable coating.


United States Controlled Release Fertilizers Market Report Scope
Polymer Coated, Polymer-Sulfur Coated, Others are covered as segments by Coating Type. Field Crops, Horticultural Crops, Turf & Ornamental are covered as segments by Crop Type.By Coating Type
| Polymer Coated |
| Polymer-Sulfur Coated |
| Others |
By Crop Type
| Field Crops |
| Horticultural Crops |
| Turf and Ornamental |
| By Coating Type | Polymer Coated |
| Polymer-Sulfur Coated | |
| Others | |
| By Crop Type | Field Crops |
| Horticultural Crops | |
| Turf and Ornamental |


Market Definition
- MARKET ESTIMATION LEVEL - Market Estimations for various types of fertilizers has been done at the product-level and not at the nutrient-level.
- NUTRIENT TYPES COVERED - Urea & Complex
- AVERAGE NUTRIENT APPLICATION RATE - This refers to the average volume of nutrient consumed per hectare of farmland in each country.
- CROP TYPES COVERED - Field Crops: Cereals, Pulses, Oilseeds, and Fiber Crops Horticulture: Fruits, Vegetables, Plantation Crops and Spices, Turf Grass and Ornamentals
| Keyword | Definition |
|---|---|
| Fertilizer | Chemical substance applied to crops to ensure nutritional requirements, available in various forms such as granules, powders, liquid, water soluble, etc. |
| Specialty Fertilizer | Used for enhanced efficiency and nutrient availability applied through soil, foliar, and fertigation. Includes CRF, SRF, liquid fertilizer, and water soluble fertilizers. |
| Controlled-Release Fertilizers (CRF) | Coated with materials such as polymer, polymer-sulfur, and other materials such as resins to ensure nutrient availability to the crop for its entire life cycle. |
| Slow-Release Fertilizers (SRF) | Coated with materials such as sulfur, neem, etc., to ensure nutrient availability to the crop for a longer period. |
| Foliar Fertilizers | Consist of both liquid and water soluble fertilizers applied through foliar application. |
| Water-Soluble Fertilizers | Available in various forms including liquid, powder, etc., used in foliar and fertigation mode of fertilizer application. |
| Fertigation | Fertilizers applied through different irrigation systems such as drip irrigation, micro irrigation, sprinkler irrigation, etc. |
| Anhydrous Ammonia | Used as fertilizer, directly injected into the soil, available in gaseous liquid form. |
| Single Super Phosphate (SSP) | Phosphorus fertilizer containing only phosphorus which has lesser than or equal to 35%. |
| Triple Super Phosphate (TSP) | Phosphorus fertilizer containing only phosphorus greater than 35%. |
| Enhanced Efficiency Fertilizers | Fertilizers coated or treated with additional layers of various ingredients to make it more efficient compared to other fertilizers. |
| Conventional Fertilizer | Fertilizers applied to crops through traditional methods including broadcasting, row placement, ploughing soil placement, etc. |
| Chelated Micronutrients | Micronutrient fertilizers coated with chelating agents such as EDTA, EDDHA, DTPA, HEDTA, etc. |
| Liquid Fertilizers | Available in liquid form, majorly used for application of fertilizers to crops through foliar and fertigation. |


Research Methodology
Mordor Intelligence follows a four-step methodology in all our reports.
- Step-1: IDENTIFY KEY VARIABLES: In order to build a robust forecasting methodology, the variables and factors identified in Step-1 are tested against available historical market numbers. Through an iterative process, the variables required for market forecast are set and the model is built on the basis of these variables.
- Step-2: Build a Market Model: Market-size estimations for the forecast years are in nominal terms. Inflation is not a part of the pricing, and the average selling price (ASP) is kept constant throughout the forecast period for each country.
- Step-3: Validate and Finalize: In this important step, all market numbers, variables and analyst calls are validated through an extensive network of primary research experts from the market studied. The respondents are selected across levels and functions to generate a holistic picture of the market studied.
- Step-4: Research Outputs: Syndicated Reports, Custom Consulting Assignments, Databases & Subscription Platforms


