Market Overview
| Study Period | 2020 - 2031 |
|---|---|
| Forecast Data Period | 2026 - 2031 |
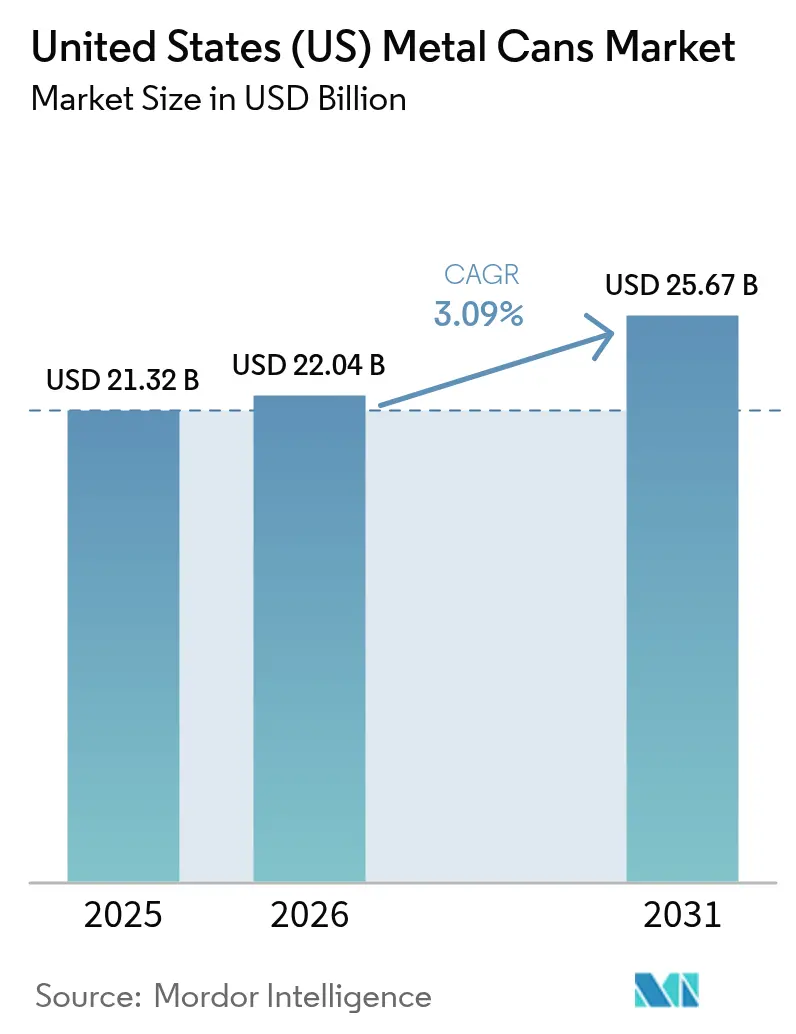
| Base Year Market Size (2025) | USD 21.32 Billion |
| Market Size (2026) | USD 22.04 Billion |
| Market Size (2031) | USD 25.67 Billion |
| Growth Rate (2026 - 2031) | 3.09% CAGR |
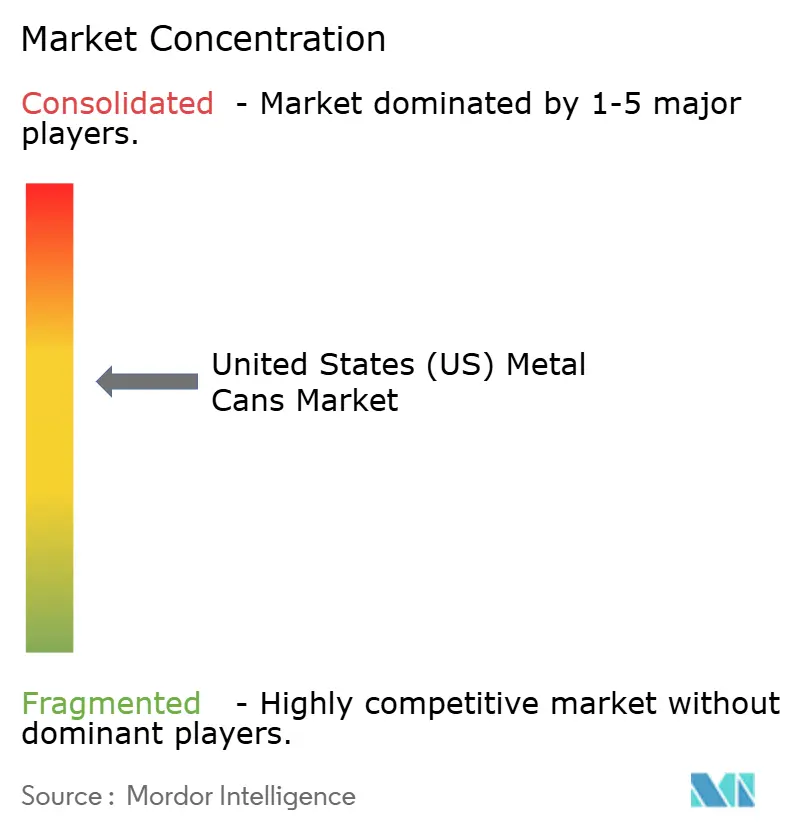
| Market Concentration | Medium |
Major Players *Disclaimer: Major Players sorted in no particular order Image © Mordor Intelligence. Reuse requires attribution under CC BY 4.0. | |
United States (US) Metal Cans Market Analysis by Mordor Intelligence
The United States metal cans market size was valued at USD 21.32 billion in 2025 and is estimated to grow from USD 22.04 billion in 2026 to reach USD 25.67 billion by 2031, at a CAGR of 3.09% during the forecast period (2026-2031). Volume gains in ready-to-drink beverages and personal-care aerosols are cushioning the United States metal cans market against price swings in primary aluminum and share erosion to flexible pouches. Aluminum retains a commanding lead because a 43-45% recycling rate aligns with corporate circular-packaging pledges, while federal incentives for low-carbon smelting de-risk long-term supply. Two-piece drawn-and-ironed (D and I) cans account for nearly four-fifths of unit revenue thanks to throughput that tops 2,500 cans per minute, and slim sub-250 milliliter formats are accelerating as craft distillers and energy-shot brands seek higher revenue per fluid ounce. Digital printing is simultaneously lowering minimum economic order volumes to 50,000 units, fragmenting what was once a scale-driven supply chain, and allowing regional fillers to compete on speed and customization. Meanwhile, pending regulations on bisphenol-A substitutes and Midwest aluminum-premium volatility inject cost uncertainty, but have not derailed growth expectations for the United States metal cans market through 2031.
Key Report Takeaways
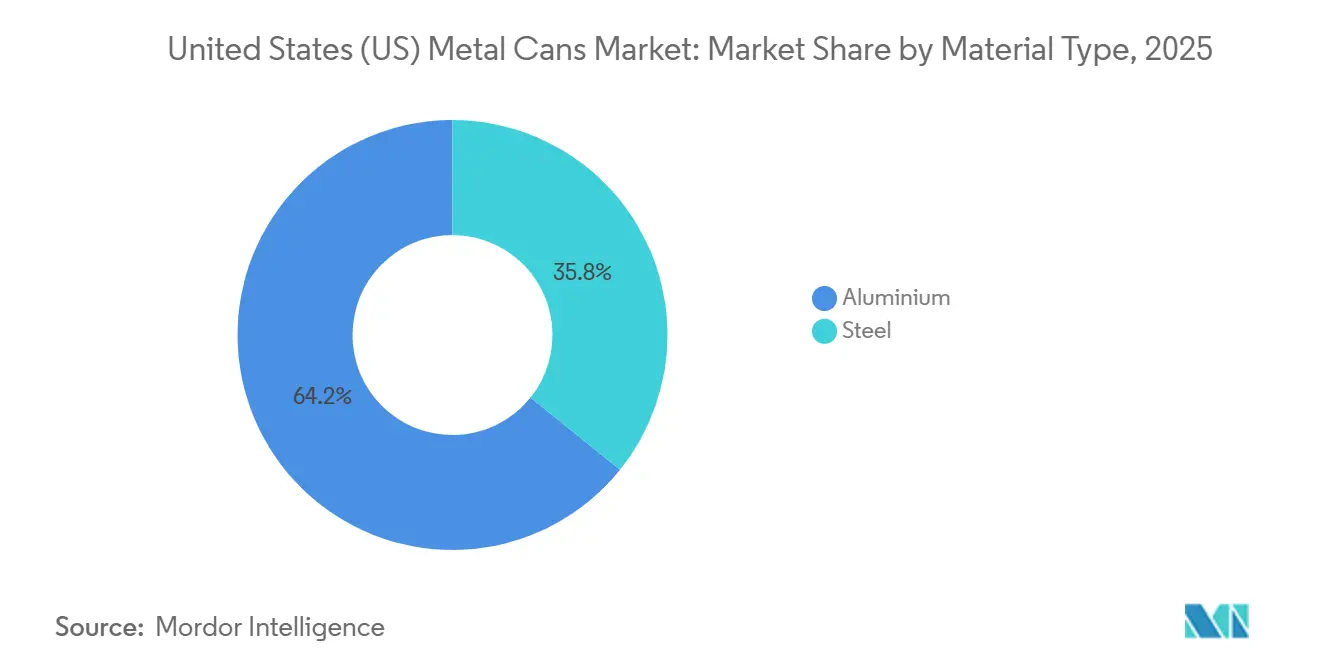
- By material type, aluminum led with 64.23% revenue share in 2025, while it is projected to expand at a 3.48% CAGR from 2026-2031.
- By can structure, two-piece designs captured 77.91% of the United States metal can market in 2025; monobloc aerosol formats are the fastest-growing, with a 3.62% CAGR to 2031.
- By capacity, the 250-500 milliliter segment accounted for 46.21% of the United States metal cans market share in 2025, whereas formats below 250 milliliters are forecast to advance at a 3.84% CAGR through 2031.
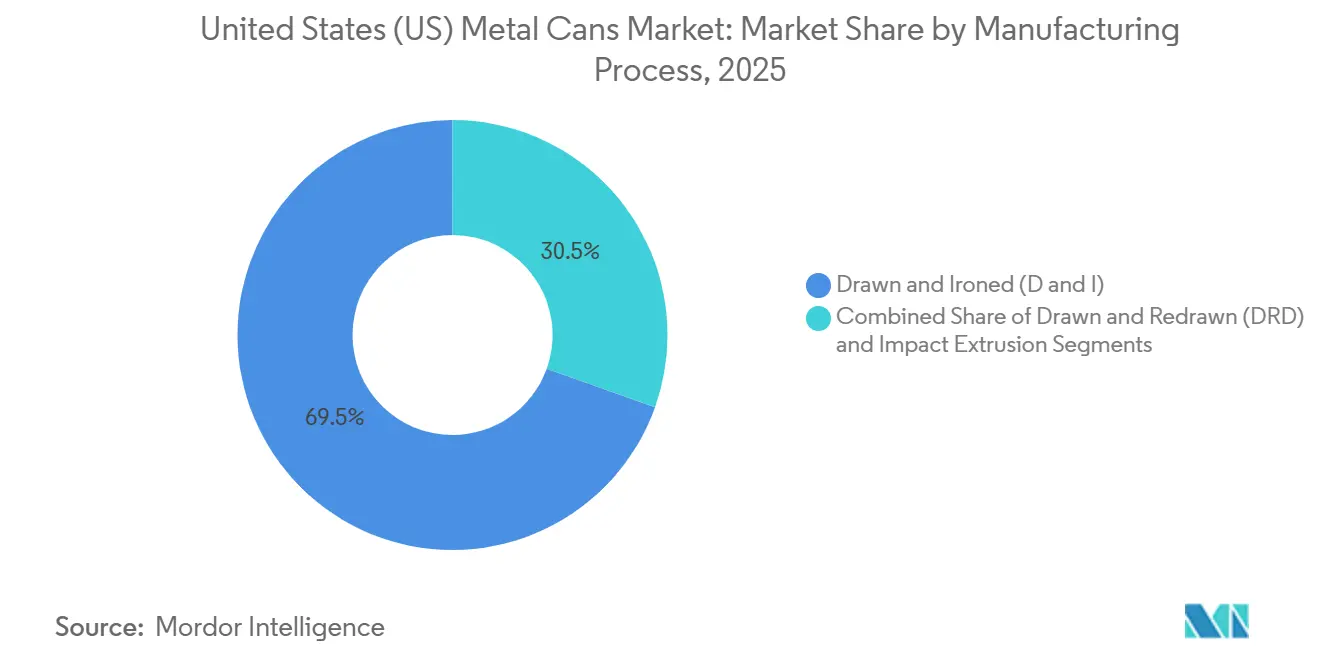
- By manufacturing process, drawn-and-ironed lines held 69.54% of revenue in 2025, while drawn-and-redrawn tooling posts the highest projected CAGR at 3.57% over 2026-2031.
- By end-user industry, beverages accounted for 58.87% of 2025 demand, yet personal care and cosmetics exhibit the strongest outlook, with a 4.43% CAGR to 2031.
Note: Market size and forecast figures in this report are generated using Mordor Intelligence’s proprietary estimation framework, updated with the latest available data and insights as of 2026.
United States (US) Metal Cans Market Trends and Insights
Drivers Impact Analysis*
| Driver | (~) % Impact on CAGR Forecast | Geographic Relevance | Impact Timeline |
|---|---|---|---|
| High Recyclability Rates of Metal Packaging | +0.8% | Deposit-Return States in West Coast and Midwest | Long Term (≥ 4 Years) |
| Convenience and Extended Shelf Life Offered by Canned Foods | +0.5% | National, Higher in Midwest and Southeast | Medium Term (2–4 Years) |
| Craft-Beer and RTD Beverage Boom Boosting Can Demand | +0.9% | Nationwide Brewing Clusters | Short Term (≤ 2 Years) |
| Brand-Owner Circular-Packaging Pledges Securing Can Volumes | +0.6% | Headquarters on Northeast and West Coast | Long Term (≥ 4 Years) |
| DOE-Backed Low-Carbon Secondary Aluminum Capacity Expansions | +0.4% | Kentucky, South Carolina, Ohio | Long Term (≥ 4 Years) |
| Digital Can Printing Enabling Profitable Micro-Batch SKUs | +0.3% | Nationwide Craft Beverage Hubs | Medium Term (2–4 Years) |
| Source: Mordor Intelligence | |||
High Recyclability Rates Drive Packaging Material Substitution
Metal cans retain closed-loop appeal because a recycled unit saves 95% of the energy required for primary smelting. Aluminum scrap fetched USD 991-1,338 per tonne in 2025 and steel cans achieved a 70% capture rate, ensuring strong residual value that brand owners increasingly monetize through take-back programs.[1]Aluminum Association, “Aluminum Recycling,” aluminum.org Deposit-return laws in California, Oregon, and Michigan push redemption rates beyond 80%, forming regional scrap pools that lower smelter feedstock costs and underpin supply security. These economics have prompted Ball Corporation to target a 90% aluminum-can recycling rate and 85% recycled content by 2030, commitments that filter down to supplier scorecards. As municipal optical-sorting upgrades spread, the United States metal cans market benefits from predictable scrap flows that mitigate raw-material price risk.[2]Ball Corporation, “Sustainability Report 2024,” ball.com
Convenience and Extended Shelf Life Offered by Canned Foods
Retort-sterilized cans give ambient shelf life of 24 months, eliminating refrigeration and trimming retail shrink. Although pantry-loading linked to COVID-19 receded by 2024, inflation-sensitive households still favor canned beans and proteins that cost 30-40% less per serving than fresh alternatives during off-season months. Steel-can lightweighting from 0.24 millimeters to 0.21 millimeters has removed 12% of material mass without sacrificing 90 psi pressure ratings. Regulatory hurdles such as FDA low-acid canned-food filings discourage new entrants and protect the installed base of autoclaves, sustaining incremental growth in the United States metal cans market despite pouch competition.
Craft-Beer and RTD Beverage Boom Boosting Can Demand
Craft breweries shifted from 62.8% can usage in 2021 to 76% in 2024 as cans double the shelf life of hop-forward styles by blocking light and oxygen. Ready-to-drink cocktails and energy drinks use slim cans to capture portability premiums, and federal labeling rules that class malt-based cocktails as beer accelerate the trend. Surplus two-piece capacity freed by shrinking carbonated-soft-drink volumes now serves these high-margin categories. Variety four-packs climbed 11% in 2024, a format well suited to digital printing that lets brands rotate artwork without plate charges, thus fueling ongoing unit growth for the United States metal cans market.
Brand-Owner Circular-Packaging Pledges Securing Can Volumes
Fortune 500 beverage and personal-care firms lock in multi-year take-or-pay contracts to satisfy 2030 recycled-content goals. Such agreements guarantee 85-90% utilization of new D and I lines costing USD 200-250 million, lowering break-even horizons. California’s SB-54, which mandates 65% recycled content by 2032, intensifies this pull by favoring infinitely recyclable substrates. While polyethylene-terephthalate moves toward 100% recycled loops, mechanical degradation limits bottle reuse cycles, whereas can-to-can recycling maintains metal integrity indefinitely, reinforcing aluminum’s role in the United States metal cans market.
Restraints Impact Analysis*
| Restraint | (~) % Impact on CAGR Forecast | Geographic Relevance | Impact Timeline |
|---|---|---|---|
| Proliferation of Alternate Packaging Formats Such as PET and Flexible Pouches | -0.7% | Nationwide, Higher in CSD and Juice | Medium Term (2–4 Years) |
| Volatility in Aluminum and Steel Input Prices | -0.5% | Great Lakes Manufacturing Corridor | Short Term (≤ 2 Years) |
| Domestic Can-Sheet Capacity Constraints Creating Supply Risk | -0.3% | Southeast and West Coast Fillers | Short Term (≤ 2 Years) |
| BPA-Substitute Migration Concerns Affecting Consumer Trust | -0.2% | Proposition 65 States | Long Term (≥ 4 Years) |
| Source: Mordor Intelligence | |||
Proliferation of Alternate Packaging Formats Such as PET and Flexible Pouches
Polyethylene-terephthalate commands a 20-30% unit-cost edge over aluminum in 500-milliliter and larger sizes, and resealability adds consumer convenience. Flexible pouches offer 40% weight savings and lower freight by USD 0.02-0.04 per unit, an attractive margin lever for high-volume juice producers. As mechanical recycling for polyethylene-terephthalate tops 2 million tonnes per year, its circularity narrative blunts aluminum’s sustainability advantage. Brand owners now treat packaging as a portfolio, shifting volume to whichever substrate minimizes total delivered cost, creating a lasting drag on the United States metal cans market.
Volatility in Aluminum and Steel Input Prices
The Midwest premium peaked at USD 0.7323 per pound in 2024, compressing margins for fillers lacking hedging mechanisms.[3]Reuters, “Aluminum Price Volatility,” reuters.com Section 232 tariffs further narrowed supply options until their scheduled 2025 review, while tinplate prices vacillated between USD 950 and USD 1,150 per tonne. Large can makers pass these costs through via indexed contracts, but independent fillers endure six- to nine-month lags before price resets, prompting some to trial polyethylene-terephthalate or glass. Cost whiplash therefore restrains near-term growth for the United States metal cans market even as structural demand improves.
*Our forecasts treat driver/restraint impacts as directional, not additive. The impact forecasts reflect baseline growth, mix effects, and variable interactions.
Segment Analysis
By Material Type: Aluminum Maintains Leadership Through Circularity
Aluminum accounted for 64.23% of 2025 revenue and continues to widen its lead, underpinned by 95% energy savings in recycling and a scrap value of USD 1,338 per tonne. The United States metal cans market for aluminum formats is propelled by Department of Energy grants totaling more than USD 650 million to restart and modernize secondary smelters. ELYSIS inert-anode technology cuts aerosol-can emissions by 70%, letting personal-care brands market net-zero packs at a modest premium. Steel’s 70% recycling rate and retort compatibility keep it relevant for canned soups and pet food, yet heavier gauges and lower scrap incentives cap its expansion. Overall, aluminum’s superior freight efficiency and corporate sustainability fit will sustain a 3.48% CAGR, preserving its dominance of the United States metal cans market.
Steel cans nevertheless hold critical niches in three-piece food applications where internal pressure thresholds exceed aluminum’s economical wall thickness. Investment in magnetic recovery lines maintains steel’s high capture rate, and gauge reductions to 0.21 millimeters have narrowed cost gaps. Consequently, steel’s footprint stabilizes near one-third of the United States' metal cans market share, anchoring categories that prize rigidity over lightweighting.


By Can Structure: Two-Piece Efficiency Outpaces Emerging Aerosols
Two-piece D and I cans delivered 77.91% share in 2025, owing to 95% material utilization and 2,500-unit-per-minute speeds that drive conversion costs below USD 0.04. Seamless walls eliminate light-strike risk and have helped the United States metal cans market size for beverages remain resilient against glass downsizing. Monobloc aerosol cans, although just 4% of revenue, register the fastest 3.62% CAGR because Ball’s ReAl alloy lowers slug weight by 30% and accepts 600-dpi graphics. Three-piece welded formats remain important for soups and specialty cocktails larger than 100 millimeters in diameter, but slower line speeds and higher scrap rates cap growth.
Going forward, two-piece lines will retain scale advantage as craft brewers, energy-drink brands, and RTD cocktails anchor billion-unit demand pools. Yet rapid aerosol adoption in personal care ensures that monobloc producers capture incremental share and enrich the product mix for the United States metal cans market.
By Capacity/Size: Sub-250 ml Formats Accelerate Premiumization
Mainstay 250-500 milliliter cans held 46.21% share in 2025 because legacy fillers run 12-ounce templates that dominate soft drinks and mainstream beer. The United States metal cans market size for formats under 250 milliliters, however, is forecast to grow 3.84% annually as energy shots, espresso martinis, and hard seltzers monetize higher revenue per ounce. Brands accept a USD 0.03-0.04 unit premium on slim cans because retail mark-ups lift margins by 400-600 basis points.
Larger 500-1,000 milliliter options will hover near one-third of market revenue, buoyed by 16-ounce energy drinks that sustain double-digit growth. Crowler cans above 1,000 milliliters enjoy niche taproom demand but face portability headwinds, limiting their trajectory within the United States metal cans market.
By Manufacturing Process: D and I Throughput Underpins Cost Leadership
Drawn-and-ironed processes accounted for 69.54% of 2025 revenue, underscoring their unmatched economy of scale. Predictive maintenance keeps uptime near 99.7%, reinforcing cost dominance. In contrast, drawn-and-redrawn tooling, growing at a 3.57% CAGR, excels at producing oblong or pear-shaped cans that command 20-30% retail premiums. Impact extrusion, at roughly 8% share, gains momentum from personal-care aerosols that require seamless walls and tight propellant tolerances.
Capital barriers for new D and I lines shield incumbents, yet specialty packers gravitate toward lower-capex drawn-and-redrawn equipment for boutique SKUs. The outcome is a diversified process mix that still orbits around D and I cost leadership inside the United States metal cans market.

By End-User Industry: Personal Care Surges Past Food and Beverages
Beverage brands accounted for 58.87% of can output in 2025, but their 3.1% CAGR is modest compared with the 4.43% pace forecast for personal care and cosmetics. Deodorants and dry shampoos adopt lightweight monobloc cans that showcase thermochromic inks, justifying a USD 0.10 premium over PET bottles. Food maintains a sizeable 22% share, relying on three-piece steel cans for 24-month shelf stability, although flexible pouches divert some juice and dairy volume.
Pharmaceutical aerosols and industrial sprays together occupy single-digit percentages yet deliver steady demand. Overall, premiumization in personal-care SKUs adds value faster than volume, reshaping revenue distribution within the United States metal cans market through 2031.
Geography Analysis
The United States metal cans market exhibits pronounced regional clustering that mirrors beverage-filling, brewing, and recycling infrastructure. West Coast states such as California and Oregon combine high deposit-return redemption rates with dense craft-beer ecosystems, concentrating sub-250 milliliter energy-shot launches and accelerating personal-care aerosol adoption. The Rocky Mountain corridor, led by Colorado, anchors aluminum-slug forging and supports high D and I line utilization for gluten-reduced craft lager volumes shipped nationwide.
Midwestern manufacturing centers in Ohio, Michigan, and Illinois leverage their historical steelmaking roots to supply three-piece food cans, while Kentucky and South Carolina emerge as hubs for recycled-aluminum smelting following Department of Energy grants. Gulf Coast ports in Texas handle imported can sheet when domestic mills run at capacity, a situation that briefly elevated Midwest premiums in the summer of 2024.
On the East Coast, beverage-can plants in North Carolina and Virginia serve RTD cocktail growth, yet the closure of rolling mills in West Virginia and Virginia tightened supply, driving some fillers to negotiate multi-year offtake pacts. Deposit-free Southeastern states witness steeper input-cost erosion because scrap availability lags, but proximity to growing population centers sustains demand. Overall, geography shapes logistics costs and recycling loops, making localized material flow a key competitive lever in the United States metal cans market.
Competitive Landscape
The U.S. metal cans market is highly concentrated, with the top five suppliers controlling more than 80% of beverage‑can capacity, which pushes smaller independents into niche segments and contract decoration. Ball Corporation shipped 107.4 billion cans globally in 2024 and introduced Eyeris digital printing across U.S. plants in 2025, cutting lead times to just two weeks for limited‑edition runs. Crown Holdings, meanwhile, reinvested EUR 1.8 billion from its European tinplate divestiture into U.S. D and I expansions aimed at the fast‑growing RTD cocktail segment.
Silgan Holdings diversified into plastic closures through its EUR 380 million acquisition of Weener Plastik, seeking cross‑selling synergies with its metal container portfolio. Ardagh Metal Packaging and Trivium Packaging, on the other hand, tackled aluminum‑premium volatility by negotiating indexed supply contracts, a strategy designed to stabilize costs in a turbulent raw‑material environment. These moves highlight how incumbents are balancing scale advantages with diversification and supply‑chain resilience.
At the same time, digital printing technology is disrupting the traditional scale moat by lowering economic order quantities, enabling independent decorators to offer 50,000‑unit runs with high‑resolution artwork. This shift is reshaping competitive dynamics, as speed of service, sustainability credentials, and analytics‑driven uptime emerge as the new battlegrounds in the U.S. metal cans market. Smaller players gain leverage through agility and customization, while larger incumbents must adapt to maintain their dominance in a rapidly evolving landscape.
United States (US) Metal Cans Industry Leaders
Crown Holdings Inc.
Ball Corporation
Silgan Holdings Inc.
Ardagh Metal Packaging S.A.
CAN-PACK S.A.
- *Disclaimer: Major Players sorted in no particular order

Recent Industry Developments
- November 2025: Ball Corporation commercialized the ELYSIS carbon-free aluminum aerosol can, produced via inert-anode electrolysis that emits oxygen instead of greenhouse gases, cutting lifecycle emissions by 70% relative to conventional smelting and enabling premium personal-care brands to claim net-zero packaging.
- August 2025: Novelis commissioned a 600,000-tonne-per-year rolling mill in Bay Minette, Alabama, dedicated to beverage-can sheet with 90% recycled content, and signed a long-term supply agreement with Ball Corporation that indexes pricing to London Metal Exchange plus a fixed premium.
- January 2025: The European Union’s ban on bisphenol-A in metal-can coatings under Regulation 2024/3190 took effect, prompting U.S. can makers to accelerate adoption of tetramethyl bisphenol-F diglycidyl ether alternatives to maintain export eligibility.
- December 2024: Crown Holdings completed the divestiture of its European Tinplate business to KPS Capital Partners for EUR 1.8 billion (USD 1.91 billion), redeploying capital to expand U.S. beverage-can capacity and strengthen its position in high-growth ready-to-drink cocktail and energy-drink segments.


United States (US) Metal Cans Market Report Scope
The United States Metal Cans Market Report is Segmented by Material Type (Aluminum, Steel), Can Structure (Two-Piece, Three-Piece, Monobloc Aerosol), Capacity/Size (Less Than 250 ml, 250-500 ml, 500-1,000 ml, More Than 1,000 ml), Manufacturing Process (Drawn and Ironed, Drawn and Redrawn, Impact Extrusion), and End-User Industry (Food, Beverage, Personal Care and Cosmetics, Pharmaceuticals, Paints and Industrial Chemicals, Automotive Fluids and Lubricants, Other End-User Industry). The Market Forecasts are Provided in Terms of Value (USD).
By Material Type
| Aluminium |
| Steel |
By Can Structure
| Two-Piece |
| Three-Piece |
| Monobloc Aerosol |
By Capacity / Size
| Less Than 250 ml |
| 250-500 ml |
| 500-1,000 ml |
| More Than 1,000 ml |
By Manufacturing Process
| Drawn and Ironed (D and I) |
| Drawn and Redrawn (DRD) |
| Impact Extrusion |
By End-User Industry
| Food |
| Beverage |
| Personal Care and Cosmetics |
| Pharmaceuticals |
| Paints and Industrial Chemicals |
| Automotive Fluids and Lubricants |
| Other End-User Industry |
| By Material Type | Aluminium |
| Steel | |
| By Can Structure | Two-Piece |
| Three-Piece | |
| Monobloc Aerosol | |
| By Capacity / Size | Less Than 250 ml |
| 250-500 ml | |
| 500-1,000 ml | |
| More Than 1,000 ml | |
| By Manufacturing Process | Drawn and Ironed (D and I) |
| Drawn and Redrawn (DRD) | |
| Impact Extrusion | |
| By End-User Industry | Food |
| Beverage | |
| Personal Care and Cosmetics | |
| Pharmaceuticals | |
| Paints and Industrial Chemicals | |
| Automotive Fluids and Lubricants | |
| Other End-User Industry |


Key Questions Answered in the Report
What is the current value of the United States metal cans market?
It was valued at USD 22.04 billion in 2026 and is projected to reach USD 25.67 billion by 2031.
Which material dominates U.S. can production?
Aluminum leads with 64.23% revenue share, driven by high recyclability and new low-carbon smelting capacity.
Which can size is growing the fastest?
Formats below 250 milliliters are forecast to expand at a 3.84% CAGR through 2031, fueled by RTD cocktails and energy shots.
Why are personal-care brands shifting to metal cans?
Monobloc aluminum aerosols cut weight by 30%, offer 360° digital graphics, and help meet recycled-content pledges.
How will digital printing influence can supply dynamics?
By lowering minimum order quantities to 50,000 units, it allows regional fillers to compete on customization and speed.
What is the main risk to future demand?
Cheaper polyethylene-terephthalate bottles and flexible pouches could divert volume, especially in carbonated soft drinks.
Page last updated on:


