Market Overview
| Study Period | 2021 - 2031 |
|---|---|
| Forecast Data Period | 2026 - 2031 |
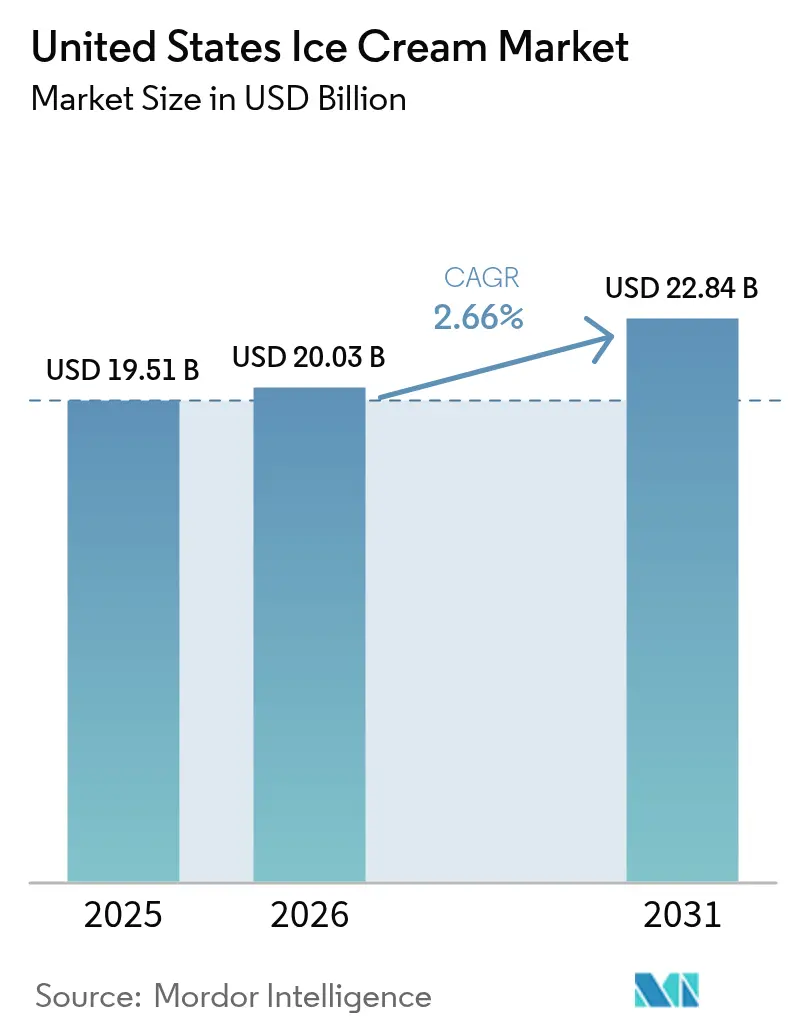
| Base Year Market Size (2025) | USD 19.51 Billion |
| Market Size (2026) | USD 20.03 Billion |
| Market Size (2031) | USD 22.84 Billion |
| Growth Rate (2026 - 2031) | 2.66% CAGR |
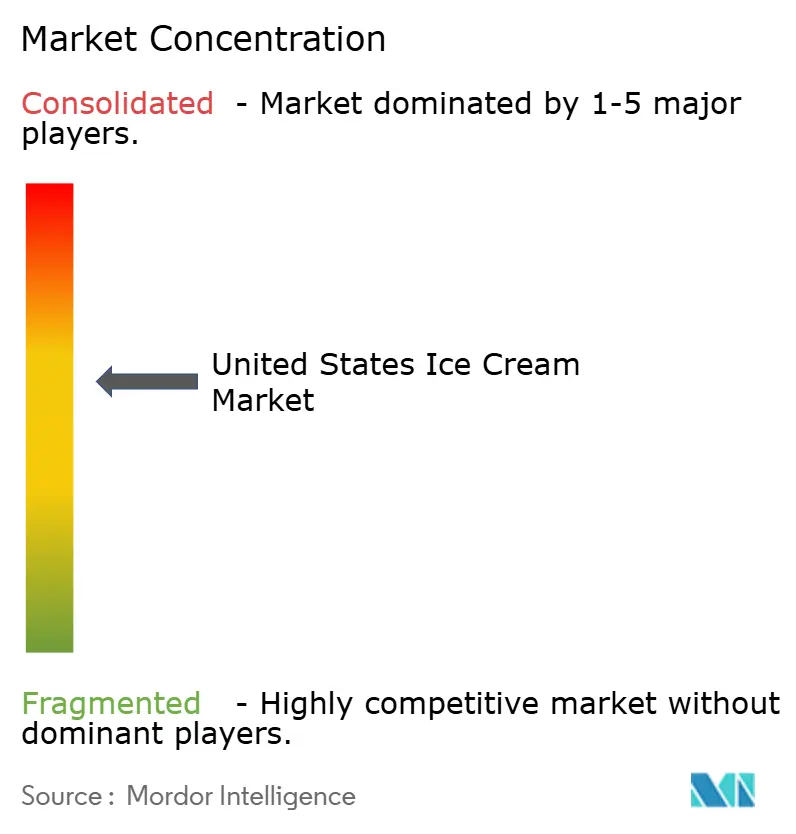
| Market Concentration | Medium |
Major Players
*Disclaimer: Major Players sorted in no particular order Image © Mordor Intelligence. Reuse requires attribution under CC BY 4.0. |
|
United States Ice Cream Market Analysis by Mordor Intelligence
The United States ice cream market size was valued at USD 19.51 billion in 2025 and estimated to grow from USD 20.03 billion in 2026 to reach USD 22.84 billion by 2031, at a CAGR of 2.66% during the forecast period (2026-2031). This growth highlights a mature yet resilient market, where premiumization continues to drive value growth despite the stabilization of overall volume. The market benefits from entrenched consumption habits, supported by the country's well-established cold-chain infrastructure and a plentiful domestic dairy supply, which collectively ensure consistent baseline demand. Additionally, the increasing popularity of premium artisanal ice cream, the expansion of plant-based innovations catering to evolving consumer preferences, and the adoption of technology-enabled distribution channels are creating new revenue opportunities. These factors collectively sustain the market's momentum and contribute to its long-term growth potential. Meanwhile, regulatory vigilance under 21 CFR 135.110 and ongoing input-cost volatility in dairy and sugar continue to shape strategic decisions across the value chain.
Key Report Takeaways
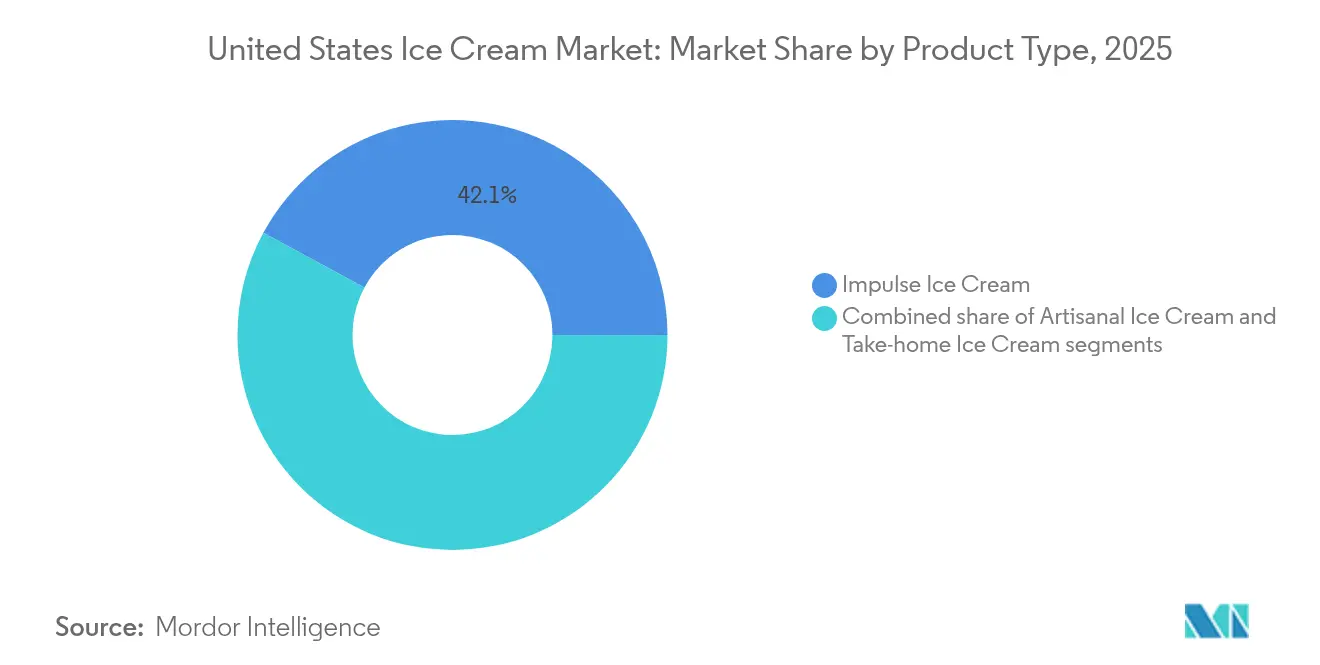
- By product type, impulse ice cream held 42.12% of the United States ice cream market share in 2025 while the artisanal segment is growing the fastest at 3.34% CAGR to 2031.
- By category, dairy products dominated with 79.55% revenue share in 2025; non-dairy alternatives are forecast to expand at a 3.25% CAGR through 2031.
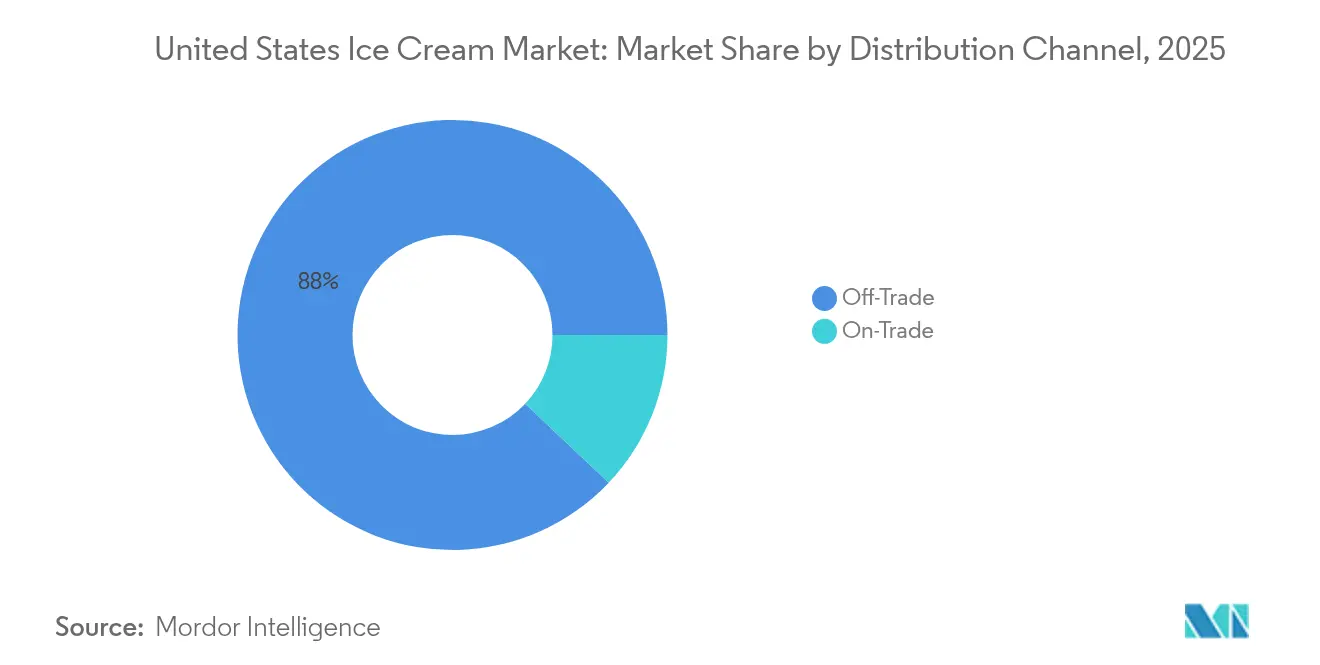
- By distribution channel, off-trade accounted for 87.95% of the United States ice cream market size in 2025 whereas on-trade is projected to post the quickest growth at 3.62% CAGR over the same period.
Note: Market size and forecast figures in this report are generated using Mordor Intelligence’s proprietary estimation framework, updated with the latest available data and insights as of 2026.
United States Ice Cream Market Trends and Insights
Drivers Impact Analysis*
| Driver | (~) % Impact on CAGR Forecast | Geographic Relevance | Impact Timeline |
|---|---|---|---|
| Growing demand for premium and artisanal ice cream | +0.8% | National, with concentration in urban markets | Medium term (2-4 years) |
| Innovation in exotic and unique flavors | +0.5% | National, with early adoption in coastal regions | Short term (≤ 2 years) |
| Expansion of healthier, low-sugar, and dairy-free options | +0.6% | National, with stronger uptake in health-conscious demographics | Medium term (2-4 years) |
| Effective marketing via digital channels and influencers | +0.4% | National, with higher impact in younger demographics | Short term (≤ 2 years) |
| Surge in plant-based and vegan ice cream alternatives | +0.7% | National, with concentration in metropolitan areas | Long term (≥ 4 years) |
| Growing emphasis on eco-friendly and sustainable packaging | +0.3% | National, with regulatory drivers in select states | Long term (≥ 4 years) |
| Source: Mordor Intelligence | |||


Growing demand for premium and artisanal ice cream
The growing demand for premium and artisanal ice cream is a significant driver of the United States ice cream market, supported by the country’s high consumption levels. In 2024, United States ice cream producers churned out a remarkable 1.31 billion gallons, according to the International Dairy Foods Association, with the average American enjoying around 19 pounds or about 4 gallons of ice cream annually [1]Source: International Dairy Foods Association, "Ice Cream Sales & Trends", www.idfa.org. This sustained enthusiasm for ice cream is increasingly shaped by consumers’ preference for high-quality, indulgent, and unique flavor experiences. Shoppers are willing to pay a premium for products made with natural ingredients, minimal processing, and innovative recipes that emphasize craftsmanship and authenticity. Artisanal brands highlighting locally sourced dairy, small-batch production, and creative flavors are gaining popularity, while leading manufacturers are expanding their premium product offerings to capture this growing demand.
Innovation in exotic and unique flavors
Innovation in exotic and unique flavors is a key driver of the United States ice cream market, as consumers increasingly seek novelty and personalization in their dessert choices while remaining strongly loyal to classic favorites. According to a survey conducted by the International Dairy Foods Association, Vanilla, Chocolate, Strawberry, and Butter Pecan remain among the most preferred flavors in the country. At the same time, the survey highlights diverse topping preferences, with 35% of consumers favoring hot fudge, 29% choosing whipped cream, and 24% opting for caramel sauce [2]Source: International Dairy Foods Association, "IDFA survey finds consumers' top ice cream flavors", www.idfa.org. This balance between tradition and innovation is fueling growth in the ice cream market, as brands experiment with global-inspired flavors such as matcha, miso caramel, ube, and spicy-sweet combinations to satisfy adventurous palates. Manufacturers are also investing in research and development to launch limited-edition and seasonal offerings that enhance consumer engagement and brand loyalty. The push toward creative flavor experiences not only differentiates products in a competitive market but also supports premium positioning and repeat purchases across both retail and foodservice channels.
Expansion of healthier, low-sugar, and dairy-free options
The expansion of healthier, low-sugar, and dairy-free options is a major driver of the United States ice cream market, reflecting evolving consumer preferences toward wellness-oriented indulgence. As more Americans adopt lifestyles focused on health, fitness, and dietary balance, demand is rising for ice cream formulations that cater to specific nutritional needs without compromising taste or texture. This trend has fueled innovations such as low-calorie, plant-based, keto-friendly, and high-protein varieties made with natural sweeteners and alternative milk sources like almond, oat, and coconut. Leading brands and emerging startups are actively investing in product reformulation and clean-label ingredients to appeal to health-conscious consumers seeking guilt-free indulgence. The growing availability of these better-for-you options across retail shelves and foodservice outlets is expanding the category’s reach and reinforcing the market’s long-term growth potential.
Effective marketing via digital channels and influencers
Effective marketing through digital channels and influencers is driving growth in the United States ice cream market by strengthening brand visibility, consumer engagement, and purchase intent among younger demographics. Social media platforms such as Instagram, TikTok, and YouTube have become powerful tools for showcasing innovative flavors, limited-edition launches, and behind-the-scenes craftsmanship through visually appealing content. Influencer partnerships and user-generated campaigns further amplify brand reach, fostering authenticity and community-driven promotion. Ice cream brands are increasingly leveraging data analytics and digital advertising to target specific consumer segments based on preferences, lifestyle, and regional trends. This dynamic, interactive approach to marketing not only enhances brand loyalty but also accelerates consumer trial and repeat purchases, supporting sustained market expansion.
Restraints Impact Analysis*
| Restraint | (~) % Impact on CAGR Forecast | Geographic Relevance | Impact Timeline |
|---|---|---|---|
| Health concerns over sugar and saturated fat content | -0.4% | National, with stronger impact in health-conscious demographics | Medium term (2-4 years) |
| Competition from alternative frozen desserts and snacks | -0.3% | National, with regional variations in competitive intensity | Short term (≤ 2 years) |
| Volatile prices of key raw materials like dairy and sugar | -0.5% | National, with regional variations based on supply proximity | Short term (≤ 2 years) |
| Seasonal demand fluctuations affecting sales stability | -0.2% | National, with stronger impact in northern climate regions | Short term (≤ 2 years) |
| Source: Mordor Intelligence | |||
Health concerns over sugar and saturated fat content
Health concerns over sugar and saturated fat content act as a major restraint on the United States ice cream market, as consumers grow increasingly aware of the nutritional impact of traditional ice cream formulations. The scale of this health challenge is substantial, with the International Diabetes Federation reporting that 13.7% of adults in the United States are affected by diabetes as of 2024, translating to approximately 38,536,400 cases [3]Source: International Diabetes Federation, "United States", www.idf.org. Rising rates of obesity, diabetes, and cardiovascular diseases have motivated many Americans to reduce their intake of high-calorie, high-sugar, and high-fat foods, leading some to limit or substitute conventional ice cream consumption. Regulatory emphasis on nutritional labeling and public health campaigns further reinforce these behavioral shifts, pressuring manufacturers to reformulate products with healthier ingredients. Although indulgence remains a key purchase driver, the perception of ice cream as an occasional treat rather than a regular dessert continues to challenge market growth, particularly among health-conscious demographics seeking better dietary management.
Competition from alternative frozen desserts and snacks
Competition from alternative frozen desserts and snacks is a key restraint in the United States ice cream market, as consumers increasingly diversify their choices toward newer, health-oriented, and functional frozen treats. Products such as frozen yogurt, gelato, sorbet, dairy-free novelties, and protein-enriched frozen snacks are gaining traction among health-conscious and vegan consumers seeking lower-calorie or nutrient-enhanced options. These alternatives often position themselves as lighter or more natural choices, directly competing with traditional ice cream for shelf space and consumer spending. Moreover, innovative frozen snack bars and better-for-you dessert brands are continuously expanding their retail presence, intensifying market competition. This growing preference for variety and wellness-focused indulgence is challenging established ice cream manufacturers to continuously innovate and adapt their product portfolios to retain market share.
*Our forecasts treat driver/restraint impacts as directional, not additive. The impact forecasts reflect baseline growth, mix effects, and variable interactions.
Segment Analysis
By Product Type: Artisanal Growth Outpaces Volume Leaders
Impulse ice cream continues to dominate the United States ice cream market, accounting for a commanding 42.12% share in 2025. Its strong performance is driven by widespread availability across retail channels, from supermarkets to convenience stores, ensuring high accessibility for consumers. The segment’s success is also supported by its alignment with on-the-go consumption habits, capturing both planned and spontaneous purchases. Major brands have strategically positioned impulse ice cream products through promotional tie-ins and seasonal flavor launches to sustain consumer interest. Additionally, single-serve packaging formats and expanding freezer presence in smaller retail outlets have reinforced its market penetration. This extensive distribution network and convenience-focused appeal have solidified impulse ice cream's position as the market leader, reflecting its ability to combine accessibility, affordability, and variety effectively.
The artisanal ice cream segment, on the other hand, represents the fastest-growing category, registering an impressive CAGR of 3.34%, far outpacing the overall market expansion. This growth is fueled by rising consumer preference for premium, small-batch products that emphasize craftsmanship and authentic ingredients. Artisanal brands leverage narratives around locally sourced dairy, handmade preparation, and unique flavor innovation to differentiate themselves from mass-market offerings. The trend toward indulgence with consciousness—balancing rich taste with clean labels and natural ingredients—has further attracted a niche but rapidly expanding consumer base. Premium pricing within this segment has not deterred demand; rather, it underscores consumers’ willingness to pay more for perceived quality and exclusivity. As a result, the artisanal segment continues to reshape the competitive landscape, driving diversification and elevating value perception within the U.S. ice cream market.


By Category: Dairy Dominance Faces Plant-Based Disruption
Dairy ice cream continues to hold a dominant position in the United States ice cream market, capturing a substantial 79.55% share in 2025. This leadership underscores consumers’ strong attachment to traditional taste, texture, and mouthfeel that dairy-based formulations uniquely deliver. The segment’s dominance is further supported by well-established brand portfolios and consistent product innovation in flavors and formats. Manufacturers have successfully leveraged nostalgia and indulgence while introducing cleaner ingredient labels and reduced-sugar options to retain a broad consumer base. Dairy ice cream’s affordability and wide availability across retail and foodservice channels reinforce its entrenched position in American households. Its enduring popularity highlights how familiarity and sensory satisfaction continue to outweigh newer dietary or ethical considerations for the majority of consumers.
In contrast, non-dairy ice cream is emerging as the fastest-growing segment, advancing at an impressive CAGR of 3.25% amid shifting consumer preferences toward health and sustainability. Growth in this category is closely tied to the rising incidence of lactose intolerance, vegan lifestyles, and increasing awareness of environmental impacts linked to dairy farming. Brands in the non-dairy space have successfully expanded consumer reach through innovations using plant-based bases such as almond, oat, coconut, and soy. These formulations replicate creamy textures and distinctive flavor experiences comparable to traditional ice cream, appealing to a broader audience beyond strict vegans. The segment also benefits from premium positioning, as consumers are willing to experiment with healthier and ethically conscious choices. As a result, non-dairy ice cream continues to gain traction within retail and online channels, signaling a structural shift that will gradually diversify the competitive dynamics of the U.S. ice cream market.
By Distribution Channel: Off-Trade Leadership with On-Trade Recovery
Off-trade distribution channels remain the dominant sales avenue in the United States ice cream market, commanding an impressive 87.95% share in 2025. This segment’s strength is underpinned by the extensive presence of grocery stores, convenience outlets, and specialty retailers that ensure broad consumer accessibility. The convenience of take-home packaging formats and multipack options continues to align well with household consumption patterns. Promotional pricing, brand variety, and strong visibility within retail freezers further enhance consumer engagement and repeat purchase behavior. Additionally, the expansion of e-commerce and click-and-collect platforms has reinforced the off-trade segment’s accessibility and competitiveness. As a result, these channels maintain an essential position in driving volume sales, solidifying their role as the cornerstone of the U.S. ice cream distribution landscape.
The on-trade segment, although smaller in scale, represents the fastest-growing distribution channel with a notable CAGR of 3.62%. This growth momentum is propelled by the resurgence of foodservice establishments, quick-service restaurants, and experiential dining formats post-pandemic. Increasing consumer interest in indulgent desserts and freshly served ice cream experiences within cafes and restaurants has enhanced the appeal of on-trade channels. These outlets provide opportunities for premium presentation, customization, and seasonal flavor innovation that distinguish them from retail offerings. Moreover, partnerships between ice cream brands and hospitality operators are expanding availability across dining venues, movie theaters, and leisure spaces. As experiential consumption continues to gain traction, the on-trade segment is expected to play a transformative role in shaping future demand patterns and diversifying consumption occasions across the U.S. ice cream market.
Geography Analysis
The United States ice cream market exhibits notable geographic diversity in consumption patterns and growth drivers across regions. The Northeast and Midwest regions traditionally hold strong market shares due to high population density and well-established retail infrastructures, supporting widespread availability of dairy and frozen dessert products. In these areas, premium and artisanal ice creams are seeing growing interest, driven by urban consumers seeking unique flavor profiles and high-quality ingredients. Meanwhile, the South benefits from a combination of large population bases and warmer climates, which historically fuel strong demand for take-home and impulse ice cream products through grocery and convenience channels. The region’s expanding urban centers continue to attract investments from major ice cream brands aiming to strengthen distribution and reach.
The Western United States, including key states such as California and Washington, stands out as a rapidly evolving market segment with pronounced growth in health-conscious and plant-based ice cream alternatives. This region’s progressive consumer demographics emphasize sustainability, dietary inclusivity, and premium offerings, which have catalyzed the rise of vegan and low-sugar frozen desserts. Innovations in product formulations coupled with active marketing campaigns around clean-label and eco-friendly attributes have resonated particularly well with West Coast consumers. Additionally, the thriving foodservice and specialty retail scene enhances exposure to artisanal and experiential ice cream formats, contributing to the region’s higher-than-average market growth rates. This blend of health focus and premiumization marks the West as a key driver in the U.S. ice cream market expansion.
Across all regions, e-commerce and direct-to-consumer platforms are increasingly influential, transcending geographic boundaries and enhancing market access. Online sales channels have grown significantly, supported by consumer demand for convenience, subscription services, and greater product variety not always available in physical stores. Seasonal variations in consumption remain relevant, with summer months driving peak sales nationwide, but regional weather variations also influence consumption patterns, with warmer states experiencing longer high-demand periods. The geographic landscape of the U.S. ice cream market is thus shaped by a combination of established regional preferences, demographic trends, innovation adoption, and evolving retail formats, making it a dynamic and highly segmented market environment.
Competitive Landscape
The United States ice cream market demonstrates a moderate concentration score of 6, indicating a balanced competitive environment where a few major players hold significant influence while smaller regional and niche brands coexist and thrive. Established multinational corporations such as Unilever and Nestlé leverage their scale advantages across production, distribution, and marketing to sustain their leadership positions. These companies employ vertical integration strategies, controlling multiple stages of the supply chain, and diversify their brand portfolios to cater to varied consumer preferences. Their expansive distribution networks and strong brand equity create significant barriers for many competitors, enabling them to capture broad market share across multiple segments and channels.
At the same time, the market is characterized by persistent pressure from regional specialists and emerging entrants, particularly in the plant-based and artisanal product categories. Low barriers to entry for these smaller players allow them to innovate rapidly and target niche consumer segments with unique value propositions such as organic ingredients, locally sourced dairy, and vegan formulations. This dynamic fosters a bifurcated market structure, wherein volume leaders focus on mass-market appeal and operational efficiency, while premium specialists emphasize quality, craftsmanship, and brand storytelling. Regional brands frequently capitalize on local consumer loyalty and trends, challenging the dominance of global giants on a more localized scale. This dual nature of competition enriches the product landscape and offers consumers a wider range of choices.
The competitive intensity in the U.S. ice cream market thus reflects a nuanced interplay between scale-driven advantages and innovation-driven disruption. High barriers to scaling production and distribution maintain the dominance of large corporations, while the relatively open landscape for product innovation encourages a growing cohort of artisanal and plant-based entrants. This segmentation allows both traditional and emerging players to carve out distinct strategic spaces, enabling the market to evolve with shifting consumer preferences. As premiumization, health consciousness, and sustainability continue to shape demand trends, the competitive landscape is expected to remain dynamic, with companies balancing the pursuit of volume growth and differentiation through product innovation and brand positioning.
United States Ice Cream Industry Leaders
-
Blue Bell Creameries LP
-
Froneri International Limited
-
Unilever PLC
-
Nestlé S.A
-
Ferrero International SpA
- *Disclaimer: Major Players sorted in no particular order

Recent Industry Developments
- July 2025: See’s Candies and McConnell’s Fine Ice Creams have teamed up to celebrate National Ice Cream Month, unveiling three new co-branded flavors. Drawing inspiration from See’s classic treats, the new flavors include: Brown Sugar with Milk Bordeaux, PB&J with Peanut Butter Patties, and Strawberry with Strawberry Creams. These flavors can be found nationwide at McConnell’s online store and Scoop Shops.
- September 2024: Hiland Dairy Foods announced expansion of its Tyler, Texas facility with 90,000 square feet of additional processing, filling, and storage capacity, targeting completion by Q1 2026 to meet growing regional demand for dairy products including ice cream products.
- August 2024: Idaho Milk Products announced a USD 200 million investment to build a 183,000-square-foot dual ice cream and powder blending facility at its Jerome, Idaho campus, with construction beginning fall 2024 and commercial production expected by May 2026.
- July 2024: Turkey Hill Dairy has announced a strategic collaboration with Mattel, Inc. to introduce two limited-edition Barbie®-inspired ice cream flavors: Strawberry Marshmallow and Frosted Cupcake. This partnership celebrates Barbie's 65th anniversary, marking a significant milestone for the iconic brand. Additionally, it aligns with the summertime demand for fresh and playful product offerings, appealing to consumers seeking unique and nostalgic experiences.


United States Ice Cream Market Report Scope
Off-Trade, On-Trade are covered as segments by Distribution Channel.
By Product Type
| Artisanal Ice Cream |
| Impulse Ice Cream |
| Take-Home Ice Cream |
By Category
| Dairy |
| Non-Dairy (Plant-Based) |
Distribution Channel
| On-Trade | |
| Off-Trade | Supermarkets/Hypermarkets |
| Specialist Retailers | |
| Convenience Stores | |
| Online Retail Stores | |
| Other Distribution Channels |
| By Product Type | Artisanal Ice Cream | |
| Impulse Ice Cream | ||
| Take-Home Ice Cream | ||
| By Category | Dairy | |
| Non-Dairy (Plant-Based) | ||
| Distribution Channel | On-Trade | |
| Off-Trade | Supermarkets/Hypermarkets | |
| Specialist Retailers | ||
| Convenience Stores | ||
| Online Retail Stores | ||
| Other Distribution Channels | ||


Market Definition
- Butter - Butter is a yellow-to-white solid emulsion of fat globules, water, and inorganic salts produced by churning the cream from cows’ milk
- Dairy - Dairy product include milk and any of the foods made from milk, including butter, cheese, ice cream, yogurt, and condensed and dried milk.
- Frozen Desserts - Frozen dairy dessert means and includes products containing milk or cream and other ingredients which are frozen or semi-frozen prior to consumption, such as ice milk or sherbet, including frozen dairy desserts for special dietary purposes, and sorbet
- Sour Milk Drinks - Sour milk is thick, curdled milk, with a sour taste, obtained from the fermentation of milk. Sour milk drinks such as kefir, laban, buttermilk have been considered in the study
| Keyword | Definition |
|---|---|
| Cultured Butter | Cultured butter is prepared by having the raw butter go through chemical processing and has been added with certain emulsifiers and foreign ingredients. |
| Uncultured Butter | This type of butter is one which has not been processed in any way |
| Natural Cheese | The type of cheese in its most natural form. It is made from natural and simple products and ingredients, including fresh and natural salts, natural colors, enzymes, and high-quality milk. |
| Processed Cheese | Processed cheese undergoes the same processes as natural cheese; however, it requires more steps and many different forms of ingredients. Making processed cheese involves melting natural cheese, emulsifying it, and adding preservatives and other artificial ingredients or colorings. |
| Single Cream | Single cream contains around 18% fat. It’s a single layer of cream that appears over boiled milk. |
| Double Cream | Double cream contains 48% fat, more than double the amount of fat of single cream. It’s heavier and thicker than single cream |
| Whipping Cream | This has a much higher fat percentage than single cream (36%). Used to top cakes, pies, and puddings and as a thickener for sauces, soups, and fillings. |
| Frozen Desserts | Desserts that are meant to be eaten in frozen condition. E.g., sherbets, sorbets, frozen yogurts |
| UHT Milk (Ultra-high temperature milk) | Milk heated at a very high temperature. Ultra-high-temperature processing (UHT) of milk involves heating for 1–8 sec at 135–154°C. which kills the spore-forming pathogenic microorganism, resulting in a product with a shelf-life of several months. |
| Non-dairy butter/Plant-based butter | Butter made from plant-derived oil such as coconut, palm, etc. |
| Non-dairy Yogurt | Yogurt made from typically made from nuts, like almonds, cashews, coconuts, and even other foods like soybeans, plantains, oats, and peas |
| On-trade | It refers to restaurants, QSRs, and bars. |
| Off-trade | It refers to supermarkets, hypermarkets, on-line channels, etc. |
| Neufchatel cheese | One of the oldest kinds of cheese in France. It is a soft, slightly crumbly, mold-ripened, bloomy-rind cheese made in the Neufchâtel-en-Bray region of Normandy. |
| Flexitarian | It refers to a consumer preferring a semi-vegetarian diet, that is centered on plant foods with limited or occasional inclusion of meat. |
| Lactose Intolerance | Lactose intolerance is a reaction in digestive system to lactose, the sugar in milk. It causes uncomfortable symptoms in response to the consumption of dairy products. |
| Cream Cheese | Cream cheese is a soft and creamy fresh cheese with a tangy taste made from milk and cream. |
| Sorbets | Sorbet is a frozen dessert made using ice combined with fruit juice, fruit purée, or other ingredients, such as wine, liqueur, or honey. |
| Sherbet | Sherbet is a sweetened frozen dessert made with fruit and some sort of dairy product such as milk or cream. |
| Shelf stable | Foods that can be safely stored at room temperature, or "on the shelf," for at least one year and do not have to be cooked or refrigerated to eat safely. |
| DSD | Direct Store Delivery is the process in supply chain management wherein the product is delivered from manufacturing plant directly to the retailer. |
| OU Kosher | Orthodox Union Kosher is a kosher certification agency based in New York City. |
| Gelato | Gelato is a frozen creamy dessert made with milk, heavy cream and sugar. |
| Grass-fed Cows | Grass-fed cows are allowed to graze in pastures, where they eat a variety of grasses and clover. |


Research Methodology
Mordor Intelligence follows a four-step methodology in all our reports.
- Step-1: Identify Key Variables: In order to build a robust forecasting methodology, the variables and factors identified in Step 1 are tested against available historical market numbers. Through an iterative process, the variables required for market forecast are set, and the model is built on the basis of these variables.
- Step-2: Build a Market Model: Market-size estimations for the forecast years are in nominal terms. Inflation is not a part of the pricing, and the average selling price (ASP) is kept constant throughout the forecast period for each country.
- Step-3: Validate and Finalize: In this important step, all market numbers, variables, and analyst calls are validated through an extensive network of primary research experts from the market studied. The respondents are selected across levels and functions to generate a holistic picture of the market studied.
- Step-4: Research Outputs: Syndicated Reports, Custom Consulting Assignments, Databases & Subscription Platforms


